HAL Id: hal-00131723
https://hal.archives-ouvertes.fr/hal-00131723
Preprint submitted on 19 Feb 2007
HAL is a multi-disciplinary open access
archive for the deposit and dissemination of
sci-entific research documents, whether they are
pub-lished or not. The documents may come from
teaching and research institutions in France or
abroad, or from public or private research centers.
L’archive ouverte pluridisciplinaire HAL, est
destinée au dépôt et à la diffusion de documents
scientifiques de niveau recherche, publiés ou non,
émanant des établissements d’enseignement et de
recherche français ou étrangers, des laboratoires
publics ou privés.
Submillimetre/TeraHertz Astronomy at Dome C with
CEA filled bolometer array
Vincent Minier, Gilles Durand, Pierre-Olivier Lagage, Michel Talvard, Tony
Travouillon, Maurizio Busso, Gino Tosti
To cite this version:
Vincent Minier, Gilles Durand, Pierre-Olivier Lagage, Michel Talvard, Tony Travouillon, et al..
Sub-millimetre/TeraHertz Astronomy at Dome C with CEA filled bolometer array. 2007. �hal-00131723�
hal-00131723, version 1 - 19 Feb 2007
EAS Publications Series, Vol. ?, 2007
SUBMILLIMETRE/TERAHERTZ ASTRONOMY AT
DOME C WITH CEA FILLED BOLOMETER ARRAY
Vincent Minier
1, Gilles Durand
1, Pierre-Olivier Lagage
1, Michel
Talvard
1, Tony Travouillon
2, Maurizio Busso
3and Gino Tosti
3Abstract. Submillimetre/TeraHertz (e.g. 200, 350, 450 µm) astronomy is the prime technique to unveil the birth and early evolution of a broad range of astrophysical objects. A major obstacle to carry out submm observations from ground is the atmosphere. Preliminary site testing and atmospheric transmission models tend to demonstrate that Dome C could offer the best conditions on Earth for submm/THz astronomy. The CAMISTIC project aims to install a filled bolometer-array cam-era with 16x16 pixels on IRAIT at Dome C and explore the 200-µm windows for potential ground-based observations.
1
Submm astronomy: science drivers and novel bolometer technology
Submillimetre (submm) astronomy is the prime technique to unveil the birth and early evolution of a broad range of astrophysical objects. It is a relatively new branch of observational astrophysics which focuses on studies of the cold Universe, i.e., objects radiating a significant − if not dominant − fraction of their energy at wavelengths ranging from ∼ 100 µm to ∼ 1 mm. Submm continuum observations are particularly powerful to measure the luminosities, temperatures and masses of cold dust emitting objects . Examples of such objects include star-forming clouds in our Galaxy, prestellar cores and deeply embedded protostars, protoplanetary disks around young stars, as well as nearby starburst galaxies and dust-enshrouded high-redshift galaxies in the early Universe (Fig. 1).
Observations of submm continuum emission are usually carried out with bolome-ter detectors. Recently, CEA (DSM/DAPNIA/SAp and DRT/LETI) has devel-opped a novel bolometer technology for the PACS submm/far-infrared imager on
This work has been undertaken within the framework of the EC ARENA network activities. 1
Service d’Astrophysique/DAPNIA/DSM, CEA Saclay, 91191 Gif-sur-Yvette, France 2
TMT project, California Institute of Technology, Pasadena 91125 CA, USA 3
Dipartimento di Fisica, Universit`a di Perugia, Via A. Pascoli, I-06100 Perugia, Italy c
EDP Sciences 2007 DOI: (will be inserted later)
2 Title : will be set by the publisher
0.3 pc
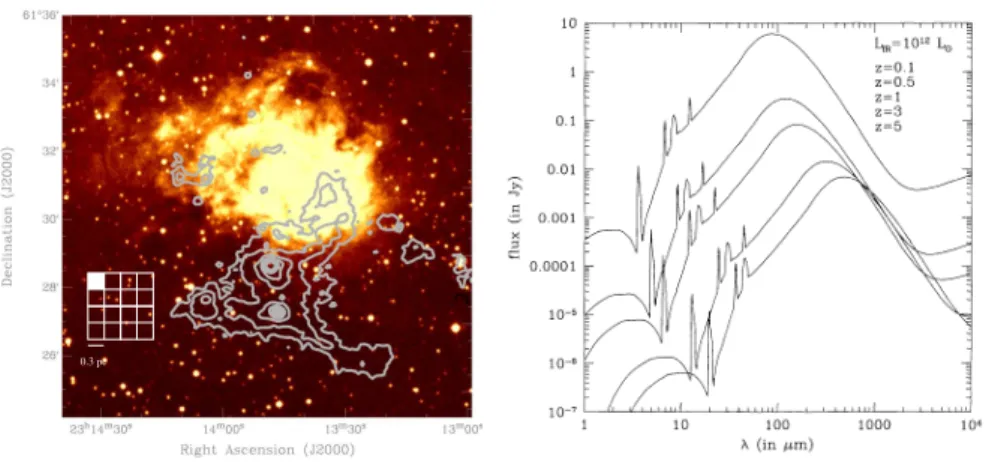
Fig. 1.Left: NGC7538, a high-mass star-forming region at 2.6 kpc. The grey contours
are the 1.2 mm continuum emission that was imaged with MAMBO-2/IRAM-30m and overlaid on the DSS optical image of the HII region. High-mass protostellar objects are localed in the mm emission clumps to the south of the HII region (Pestalozzi et al. 2006). As high-mass protostellar objects emit the bulk of their energy between 60 and 400 µm (Minier et al. 2005), submm/THz continuum mapping is a unique tool to study them. Right: Spectral Energy Density of ultra-luminous galaxies for redshift z=0.1 to 5. Submm/THz continuum observations measure SED peaks for z=3 to 5 (Guiderdoni et al. 1998).
the Herschel Space Observatory. The R&D was based on a unique and innovating technology that combines all silicon technology (resistive thermometers, absorb-ing grids, multiplexabsorb-ing) and monolithic fabrication. The bolometers are assembled on a mosaic ”CCD-like” array that provides full sampling of the focal plane with ∼ 2000 pixels that are arranged in units of 256 pixels. They are cooled down to 300 mK to optimise the sensitivity down to the physical limit imposed by the photon background noise. The PACS bolometer arrays have passed all the qualification tests (Billot et al. 2006). The newly started ArT´eMiS project at CEA Saclay cap-italises on this achievement by developing submm (200-450 µm) bolometer arrays with ∼ 4100 pixels for ground-based telescopes. A prototype camera operating in the 450 µm atmospheric window has successfully been tested in March 2006 on the KOSMA telescope (Talvard et al. 2006).
Placed on a 12-m single-dish telescope that is located on a dry site (25% PWV<0.5 mm) , a bolometer camera with ∼4100 pixels at 200-450 µm will be particularly powerful to undertake wide field surveys of star-forming complexes in our Galaxy as well as deep field surveys of dust-enshrouded high-redshift galaxies in the early Universe (see Talvard et al. 2006 for an overview of ArTeMiS science cases). Beside Herschel and ALMA, large-format submm imagers will provide (1) better angular resolution than Herschel around ∼ 200 µm and (2) wider-field
100 200 300 400 500 600 700 800 900 1000 0 10 20 30 40 50 60 70 80 90 100 Wavelength (µm) Transmission (%)
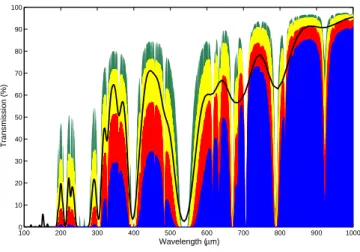
Fig. 2.Modeled atmospheric transmission for submm/mm wavelengths. Colour plots are
ATM models (Pardo et al. 2001) for Chajnantor with PWV equal to 0.1 mm (green), 0.2 mm (yellow), 0.5 mm (red) and 1 mm (blue). The solid line represents the atmospheric transmission expected at Dome C for PWV=0.17 mm (Lawrence 2004).
mapping capabilities than ALMA, making large-scale surveys possible.
2
Atmosphere transmission: Chajnantor vs. Dome C
A major obstacle to carry out submm observations from ground is the atmosphere. Astronomical observations in the submm/THz spectral bands (e.g. 200, 350, 450 µm) can only be achieved from extremely cold, dry and stable sites (e.g. high altitude plateau, Antarctica) or from space (e.g. the Herschel Space Observatory) to overcome the atmosphere opacity and instability that are mainly due to water vapour absorption and fluctuations in the low atmosphere. Chile currently offers the best accessible (all-year long) sites on Earth, where the precipitable water vapour (PWV) content is often less than 1 mm. Chile hosts the best astronomical facilities such as ESO VLT, APEX and the Chajnantor plateau will be the ALMA site. At longer term, and particularly if global warming severely restricts the 200-350-450-µm windows on ESO sites, Antarctica conditions with less than 0.2 mm PWV, could offer an exciting alternative for THz/submm astronomy (Fig. 2). This is an attractive opportunity for the 200-µm windows, especially, which are normally explored with Space telescopes (e.g. Herschel).
In order to determine the respective performances of a submm bolometer array at Chajnantor and Dome C, we have modeled the atmospheric transmisssion of the two sites. Using the freely available Atmospheric Transmission Model (ATM; Pardo et al. 2001), we have computed the transmission statistics at 200 and 450 µm. As input to the model, PWV of the two sites are necessary. In the case
4 Title : will be set by the publisher 0 20 40 60 80 100 0 0.1 0.2 0.3 0.4 0.5 0.6 0.7 0.8 Cumul. Frequency (%) Transmission 450 microns Dome C Chajnantor 0 20 40 60 80 100 0 0.05 0.1 0.15 0.2 0.25 Cumul. Frequency (%) Transmission 200 microns Dome C Chajnantor
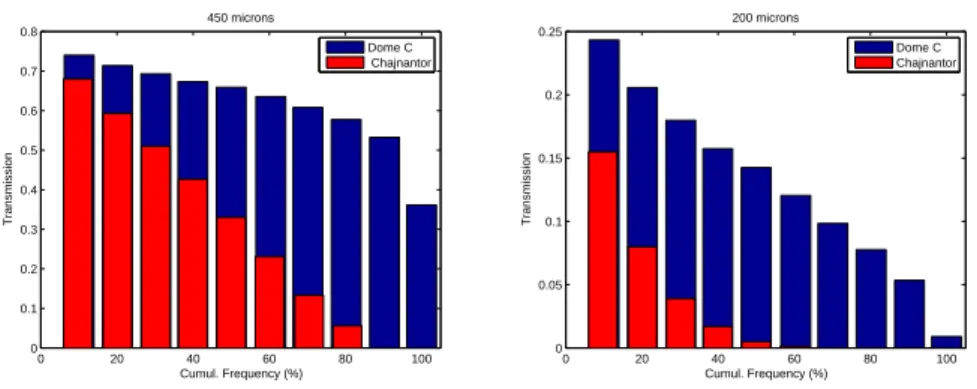
Fig. 3. Atmospheric transmission vs. cumulative time frequency for Chajnantor (red)
and Dome C (blue). Left: 450 µm. Dome C modeled transmission remains above 50% during 90% of the time. Right: 200 µm. The window opens only less than 10% of the time for a transmission above 20%.
of Chajnantor, the PWV statistics available in Peterson et al. (2003) were used. These statistics span a total period of ∼ 5 years. In the case of Dome C, no PWV data is available for a long period of time including winter. The closest site where a large amount of statistics are available is the South Pole. The difference between the South Pole and Dome C, in terms of PWV are expected to be small. Transmission measurements in the summer time at 350 µm made at both sites by Calisse et al. (2004) suggest that the transmissions are similar while Dome C has better stability than the South Pole. For this model, we therefore use the PWV data from the South Pole available in Peterson et al. (2003) and extrapolate the corresponding atmospheric transmission at Dome C using the model in Lawrence et al. (2004). Our transmission calculations for Dome C must therefore be considered conservative.
Fig. 3-left shows the results of the transmission statistics at Dome C and Chajnantor for 450 µm. At this wavelength, the transmission of the two sites is only comparable for the best 10 percent of the time. For non-exclusive use of telescope time for this wavelength, Chajnantor is therefore the optimal site as sub-mm observatories (e.g. APEX, ASTE, NANTEN-2) are already in place and is therefore cheaper than Dome C were no sub-mm facilities are currently available. For exclusive use of telescope time for the 450 µm window, Dome C becomes however a more attractive site. This window remains above a transmission of 50% for more than 90% of the time while the transmission at Chajnantor drops far quicker to a median value of 35%. At 200 µm, this difference is even more severe. As shown in Fig. 3-right, observing from Chajnantor requires exceptional conditions on the APEX site at this wavelength. Even at Dome C, the best conditions are required to attempt the observation of bright sources.
The stability of these windows is an equally important parameter when com-paring the sites. Fast variations of the PWV mean that the transmission can vary
0 20 40 60 80 100 0 0.2 0.4 0.6 0.8 1 450 microns @ 25% stability Cumul. Freq. (%) Transmission 0 20 40 60 80 100 0 0.1 0.2 0.3 0.4 0.5 200 microns @ 25% stability Cumul. Freq. (%) Transmission 0 20 40 60 80 100 0 0.2 0.4 0.6 0.8 1 450 microns @ 50% stability Cumul. Freq. (%) Transmission 0 20 40 60 80 100 0 0.1 0.2 0.3 0.4 0.5 200 microns @ 50% stability Cumul. Freq. (%) Transmission
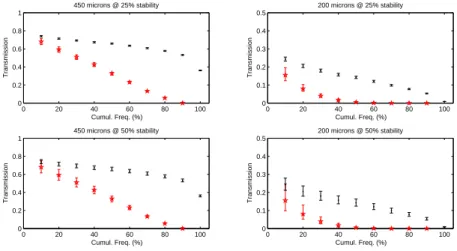
Fig. 4. Atmospheric transmission vs. cumulative frequency at Dome C (black circles)
and Chajnantor (red stars). The error bars correspond to the modeled standard deviation of the transmission for the 25% and 50% stability percentiles. 25% stability means the stability level that is expected 25% of the winter time.
significantly during an observation. Peterson et al. (2003) have calculated the statistics of the standard deviation of the PWV over periods of 2 hours (typical observation time) for South Pole and Chajnantor. Using the 25% and 50% per-centile of the distribution of this number for the two sites, we have calculated the corresponding standard deviation of the transmission at 200 and 450 µm as a definition for stability and applied the South Pole values to Dome C modeled transmission in Fig. 3. These results are shown in Fig. 4. In this figure, the error bars correspond to the standard deviation of the transmission. The model for Dome C stands out as being far more stable than Chajnantor where the trans-mission in median stability conditions can varies by up to 20%. It is only at 200 µm, for the worse 50% stability conditions that the stability at Dome C becomes an issue.
The Antarctic plateau is therefore a potentially ideal site for submm/THz observations. The conditions are probably always ideal for observations at 450 µm and is a potential ground based site where 200 µm observations can be made paving the path for complementary observations with higher angular resolution to the Herschel Space mission.
3
Site testing and science qualification
Chajnantor plateau in Chile is currently presented as the best submm astron-omy site on Earth. However, our analysis in Sect. 2 predicts that the French-Italian Concordia base could be a potentially remarkable observatory on Earth
6 Title : will be set by the publisher
for submm/THz astronomy. A site testing campaign that is specifically designed for submm/THz astronomy is clearly required. The transparency (i.e. the optical depth τ ) and the stability (i.e. the sky noise στ) must be measured to determine
whether Dome C is a better site than Chajnantor.
The road map for site testing that we propose to follow at CEA Saclay will consist of three steps. (1) The GIVRE experiment (2007) in collaboration with IPEV and LUAN, Nice aims to determine the impact of frost and icing on hardware at the Concordia station. (2) The SUMMIT 200 µm tipper experiment (2008) in collaboration with UNSW, Sydney aims to measure τ and therefore obtain a clear estimate of the atmosphere transmission. (3) The CAMISTIC project (2009-2010) at CEA Saclay aims to install a filled bolometer-array camera with 16x16 pixels on the IRAIT telescope (Tosti et al. 2006) at Dome C and explore the 200-µm (i.e. THz) windows for ground-based observations. CAMISTIC will perform site testing on the atmospheric transmission and sky noise in the 200-µm range. Sky noise measurements will be performed through sky imaging with the whole bolometer array. On a 80-cm telescope (IRAIT), the near field is located at 1.6 km for 200 µm. This means that the overlap between the bolometer pixel beams will be greater than 50% until about 1 km, and above the near-field limit, the pixel beams completely diverge. If the water vapour cells responsible for the fluctuations in the atmosphere background power (i.e. sky noise) are located below ∼ 1 km, the pixels ”see” through the same atmosphere column and sky noise. However, if these water vapour cells are above 1.6 km, then non adjacent pixels on the array ”see” through different atmosphere column and can potentially provide a map of the sky noise.
In the future this site testing campaign should demonstrate whether Dome C is the best site on Earth for submm/THz astronomy and therefore open the path to large (> 10) diameter telescopes at the Concordia station (see Olmi et al., this volume).
References
Billot, N., Agn`ese, P., Augu`eres, J.-L., B´eguin, A., et al. 2006, in: Mather, J.C.; MacEwen, H.A.; de Graauw, M.W.M., Proceedings of the SPIE, Volume 6265, 9 Calisse, P.G., Ashley, M.C.B., Burton, M.G., et al. 2004, PASA, 21, 256
Guiderdoni, B., Hivon, E., Bouchet, F.R., & Maffei, B. 1998, MNRAS, 295, 877 Lawrence, J.S. 2004, 16, 482
Minier, V., Burton, M.G., Hill, T. et al. 2005, A&A 429, 945
Pardo, J.R., Cernicharo, J., & Serabyn, E. 2001, IEEE Trans. on Antennas and Propa-gation, 49/12, 1683
Pestalozzi, M.R., Minier, V., Motte, F., & Conway, J.E. 2006, A&A, 448, L57 Peterson, J.B., Radford, S.J.E., Ade, P.A.R., et al. 2003, PASP, 115, 383
Talvard, M., Andr´e, P., Rodriguez, L., Minier, V. et al. 2006, in: Zmuidzinas J., Holland W.S., Withington S., and Duncan W.D., Proceedings of the SPIE, Volume 6275, 2 Tosti, G., Busso, M., Nucciarelli, G., et al. 2006, in: Stepp L.M., Proceedings of the