HAL Id: inserm-02437931
https://www.hal.inserm.fr/inserm-02437931
Submitted on 14 Jan 2020
HAL is a multi-disciplinary open access
archive for the deposit and dissemination of
sci-entific research documents, whether they are
pub-lished or not. The documents may come from
teaching and research institutions in France or
abroad, or from public or private research centers.
L’archive ouverte pluridisciplinaire HAL, est
destinée au dépôt et à la diffusion de documents
scientifiques de niveau recherche, publiés ou non,
émanant des établissements d’enseignement et de
recherche français ou étrangers, des laboratoires
publics ou privés.
Jérôme Audoux, Mikaël Salson, Christophe Grosset, Sacha Beaumeunier,
Jean-Marc Holder, Thérèse Commes, Nicolas Philippe
To cite this version:
Jérôme Audoux, Mikaël Salson, Christophe Grosset, Sacha Beaumeunier, Jean-Marc Holder, et al..
SimBA: A methodology and tools for evaluating the performance of RNA-Seq bioinformatic pipelines.
BMC Bioinformatics, BioMed Central, 2017, 18 (1), pp.428. �10.1186/s12859-017-1831-5�.
�inserm-02437931�
S O F T W A R E
Open Access
SimBA: A methodology and tools for
evaluating the performance of RNA-Seq
bioinformatic pipelines
Jérôme Audoux
1,2, Mikaël Salson
3, Christophe F. Grosset
4, Sacha Beaumeunier
1,2, Jean-Marc Holder
1,2,
Thérèse Commes
1,2and Nicolas Philippe
1,2*Abstract
Background: The evolution of next-generation sequencing (NGS) technologies has led to increased focus on
RNA-Seq. Many bioinformatic tools have been developed for RNA-Seq analysis, each with unique performance characteristics and configuration parameters. Users face an increasingly complex task in understanding which bioinformatic tools are best for their specific needs and how they should be configured. In order to provide some answers to these questions, we investigate the performance of leading bioinformatic tools designed for RNA-Seq analysis and propose a methodology for systematic evaluation and comparison of performance to help users make well informed choices.
Results: To evaluate RNA-Seq pipelines, we developed a suite of two benchmarking tools. SimCT generates
simulated datasets that get as close as possible to specific real biological conditions accompanied by the list of genomic incidents and mutations that have been inserted. BenchCT then compares the output of any bioinformatics pipeline that has been run against a SimCT dataset with the simulated genomic and transcriptional variations it contains to give an accurate performance evaluation in addressing specific biological question. We used these tools to simulate a real-world genomic medicine question s involving the comparison of healthy and cancerous cells. Results revealed that performance in addressing a particular biological context varied significantly depending on the choice of tools and settings used. We also found that by combining the output of certain pipelines, substantial performance improvements could be achieved.
Conclusion: Our research emphasizes the importance of selecting and configuring bioinformatic tools for the
specific biological question being investigated to obtain optimal results. Pipeline designers, developers and users should include benchmarking in the context of their biological question as part of their design and quality control process. Our SimBA suite of benchmarking tools provides a reliable basis for comparing the performance of RNA-Seq bioinformatics pipelines in addressing a specific biological question. We would like to see the creation of a reference corpus of data-sets that would allow accurate comparison between benchmarks performed by different groups and the publication of more benchmarks based on this public corpus. SimBA software and data-set are available at http:// cractools.gforge.inria.fr/softwares/simba/.
Keywords: RNA-Seq, Transcriptomics, Benchmark, Pipeline optimization
*Correspondence: [email protected]
1SeqOne, IRMB, CHRU de Montpellier -Hopital St Eloi, 80 avenue Augustin Fliche, 34295 Montpellier, France
2Institute of Computational Biology, Montpellier, 860, Rue Saint-Priest, 34095 Montpellier Cedex 5, France
Full list of author information is available at the end of the article
© The Author(s). 2017 Open Access This article is distributed under the terms of the Creative Commons Attribution 4.0 International License (http://creativecommons.org/licenses/by/4.0/), which permits unrestricted use, distribution, and reproduction in any medium, provided you give appropriate credit to the original author(s) and the source, provide a link to the Creative Commons license, and indicate if changes were made. The Creative Commons Public Domain Dedication waiver (http://creativecommons.org/publicdomain/zero/1.0/) applies to the data made available in this article, unless otherwise stated.
Background
RNA-seq technology: power and versatility
The unprecedented evolution of next-generation sequenc-ing (NGS) technologies in transcriptomics (RNA-Seq) has shaped computational biology and facilitated new advances in genomic medicine [1]. RNA-Seq examines the dynamic nature of the cell’s transcriptome, the portion of genome that is actively transcribed into RNA molecules which allows researchers to determine when and where genes are turned on or off in a variety of cell types and circumstances.
RNA-Seq offers benefits in the detection of novel tran-scripts as it does not require context-specific probes ren-dering it more flexible than microarrays that cannot be modified to reflect evolving requirements. However, for RNA-Seq to evolve beyond the realm of analytic research to clinical use, performance benchmarking of the RNA-Seq-specific bioinformatic tools are needed to ensure accuracy and reproducibility [2].
RNA-seq analysis process: dependence on the biological question
Given the increasing variety of biological questions being investigated using RNA-Seq analysis [3], the community has developed a broad range of bioinformatic tools to address specific needs. This growing selection of tools should, in theory, make it possible for users to design highly optimized pipelines that deliver best results for any specific biological question. The traditional process of the RNASeq analysis [4] consists of a multistep pipeline -starting with mapping, followed by the quantification of known transcript or gene and finally statistical analysis of the expression including differential expression analy-sis and clustering. RNA-Seq can also be used to identify new genes and transcript variants including splice junc-tions, SNVs, indels or gene fusions predictions that are of particular relevance in the study of cancer [5].
An important consideration in analyzing RNA-Seq is that, due to the complexity of interpretation, pipelines must be optimized to the biological question being inves-tigated to yield meaningful results. Some analyses require more sensitivity while others put emphasis on precision. Other factors such as the sequencing protocol and com-pute resources available also have to be considered. How-ever, despite all the work done in optimizing specific tools, few people have sufficient understanding of their char-acteristics to make informed choices on the best ones to include in a given pipeline, or how they should be con-figured. To make matters worse, the number of distinct permutations of pipeline components and configurations creates a real combinatorial challenge.
One strategy that helps the researcher address this prob-lem is the systematic evaluation of software alternatives based on a set of simulated reads. For instance, in a recent
benchmarking study [6], the authors assessed RNA-Seq alignment tools on three human and malaria datasets at the read, junction and base levels. However, their bench-mark suffered from limitations that could impact their conclusions. We question the relevance of the metrics used in their comparisons: the way multiple alignments are discarded (those do not use the standard NH tag in the SAM file), the fact that highly-expressed junc-tions have more weight in the junction-level analysis than under-expressed ones, and the fact the the authors rely solely on the CIGAR string to assess the alignment (while some ambiguous alignments might have distinct CIGAR strings). The authors use the dataset with the highest mutation rate of 3% to tune the parameters., so RNA-Seq benchmarking efforts to-date have tended to provide a review of the pipeline tools available at a given time, with a focus on individual components such as aligners [7–10], variant callers [11–13] or quantification methods [7, 14].
Other comparison strategies are based on modeling rules and computing metrics from real data sets of reads [15, 16] as it is assumed that simulating NGS reflecting the biological complexity and technical biases associated with sequencing is impossible. Recently, an original approach, TEASER, was introduced [17] to compare genomic align-ers in a dynamic and flexible manner using a platform with a simple SaaS application to generate reports auto-matically. However, TEASER is not applicable to RNA-seq analysis. It can be complicated to transpose a specific benchmarking result to another biological context and to use results to optimize configuration a selected pipeline. As a result, many researchers rely on well known, highly publicized pipelines using standard configurations that may be ill-adapted to examining their particular biolog-ical question. As an example, it is not uncommon to see researchers using, for instance, TopHat2 with default parameters1. We believe that SimBA will make it easier to conceive benchmarks adapted to a specific biological question.
RNA-seq challenge: The need for standard data-sets and benchmarking methodology
Combining a set of tools to create a complete analy-sis pipeline requires expertise and familiarity with the characteristics of each candidate software component of the workflow. This has implications for researchers and clinicians alike, as using the right pipeline, correctly con-figured, limits false positives and ensures that relevant genomic events are surfaced. This emphasizes the need for a benchmarking methodology that provides concrete information on the pipeline and configuration settings that yield best results for a given biological question.
Traditional simulation approaches like BEERS [10] or
Flux Simulator(Flux) [18] aim to model RNA-Seq exper-iments in silico by sequencing reads from a reference
genome according to annotated transcripts and by model-ing different experimental behaviors. BEERS is an easy-to-use simulator of simplified reads, whose main weakness is that it does not take into account the preparation of the library that precedes the sequencing itself (frag-mentation, RT-PCR, etc.). Flux provides a more realis-tic view as it models the wet-lab process and the type of sequencer and simulates sequence errors using tech-niques based on heuristic models. Flux also benefits from excellent documentation and a high configurabil-ity of each step of the simulation. However, though it does an excellent job in simulating the expression pro-file, library preparation and sequencing, it does not take into account the underlying biological significance of the reference transcriptome (genome modifications, cancer-ous cells, etc.). Other approaches to simulating cancercancer-ous data directly in sequenced reads using BAMSurgeon [19], rather than modifying a reference genome and its annotations.
Many of these approaches do not allow tools to be benchmarked in the context of a specific biological ques-tion [10]. This drives users to develop new methods based on their own private data-sets. Some initiatives have emerged such as Dream Challenge that provide sets of data for benchmarking but without the curation that pro-vides test data relevant to each requirements that would enable consistent and reproducible comparisons.
Implementation
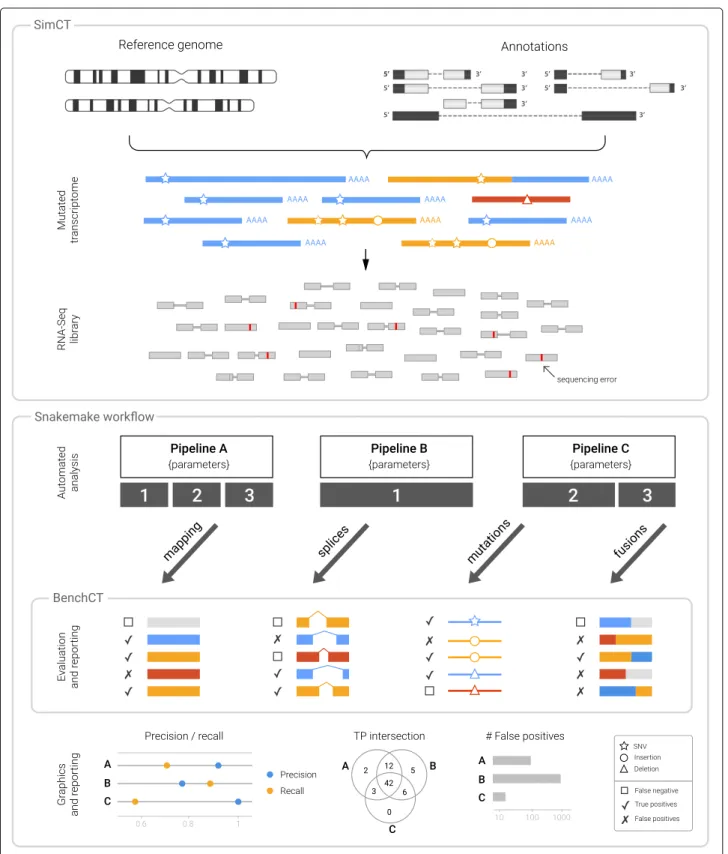
We have developed SimBA (Simulation & Benchmarking Analysis), a software suite designed to evaluate the per-formance of an entire RNA-Seq pipeline in the context of a specific biological question. SimBA provides an inte-grated environment (see Fig. 1) that lets the users generate benchmark reports that evaluate the workflow of their choice. It is comprised of two components:
SimCT A configurable generator of simulated RNA-Seq data that can emulate specific biological mechanism (ie. SNVs, indels, fusions) and provide robust data sets covering cases such as fusion genes (or fusions).
BenchCT A qualitative evaluation tool which assess any pipeline results against a simulated dataset to obtain a clear understanding of its performance character-istics in answering a particular biological question. In this paper, we illustrate how this vision applies in genomic medicine by building a set of RNA-Seq data sim-ulations of a somatic condition and propose an automated workflow using Snakemake [20] to compare tools in three qualitative RNA-Seq use cases: SNVs, indels and fusion genes. The Snakefile used to generate all results presented in the article is available at https://github.com/jaudoux/ simba-publication-pipeline.
SimCT: RNA-Seq operation
SimCT is a complete and modular workflow to simu-late RNA-Seq data from a reference genome and known transcript annotations.
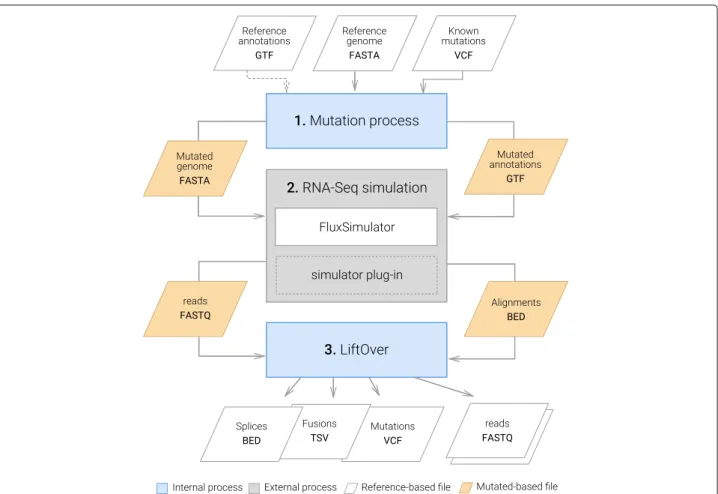
SimCTworks in three steps (see Fig. 2):
1. The first step introduces a set of variants in the reference genome.SimCT then generates a haploid mutated genome in FASTA format and a set of GTF annotations whose coordinates are converted for this modified reference.
2. We then process the modified reference files using FluxSimulator, that offers good performance in generating a random expression profile and simulating reads by reproducing a complete“in silico” RNA-Seq protocol.
3. In the final step, the reads and corresponding alignments produced byFluxSimulator are sent to post-processing where alignment coordinates are converted to the coordinates of the original reference genome. The errors are then extracted from read sequence (encoded in lowercase byFluxSimulator) and a new FASTQ file is produced with alignments and errors encoded in the read name, similar to the approach in RNF [21].
Mutation process
Single nucleotide variants (SNVs) or insertion and dele-tions (indels) are introduced in the reference genome either randomly or guided by a reference VCF file (only biallelic sites are supported for the moment). Both mutation sources can be used together with --vcf-ratio option, that defines the ratio of muta-tions taken from the VCF file provided, to those generated randomly. Overlap between mutations is forbidden.
Random mutations Random mutations are generated given a defined rate per chromosome with equal prob-ability for each of the four bases. The lengths of indels is chosen randomly between 1 and the max indel length (default is 15).
Gene fusions
Gene fusions (fusions) are generated by randomly pick-ing two exons from the annotations, and combinpick-ing their two parent genes into a fusion gene. This is accomplished by merging the upstream part of the parent gene of one exon with the downstream part of the parent gene of the other exon. Both fused exons are then merged to force the fusion junction between the two ends. The new fusion gene is saved in a separate FASTA file, and annotations of the fusions transcripts are added to the GTF file.
Fig. 1 Overview of the SimBA benchmarking procedure. A benchmarking pipeline implemented with SimBA is composed of three components, i/ Simulation of synthetic data using SimCT, ii/ Processing of the synthetic data using a pipeline manager (i.e Snakemake [20], iii/ Qualitative evaluation of the results using BenchCT
Fig. 2 SimCT method. SimCT uses a reference FASTA and GTF annotations as input. A first process is intended to introduced biological variations in this reference to create a mutated reference. This new reference is then transfered to FluxSimulator, in order to generate an RNA-Seq experiment. Finaly FluxSimulator output are post-processed to transfer the coordinates from the mutated genome to the original reference
Read name format
SimCT includes the alignment position and errors of the simulated reads in their names, making it easier for developers to identify bugs or algorithm flaws in their alignment software. The read format is defined as :
read_id :(chr, (−)pos, cigar(; )?)+ : base64(err_pos?) The read name is composed of three components: (i) the read id from 0 to nb_reads− 1, (ii) a list of SAM-like [22] read alignments (chr, starting position and cigar chain), (iii) the positions of sequencing errors (if any) encoded in base64. For paired-end reads, a single read name is generated for both reads by using a single read_id, con-catenating the alignments and merging the positions of sequencing errors.
Dataset characteristics
In addition to the FASTQ file containing reads with their alignments, SimCT also saves splice and fusion junctions and mutations supported by the sequenced reads in sep-arate files. Fusion junctions are defined as either non
colinear junctions (junctions on distinct chromosomes,
or in reverse order), or colinear junctions with a junc-tion length longer than a pre-defined threshold (300kb by default). This means, that colinear fusion junctions are not necessarily produced by the fusions introduced, but can also result from very large splice junctions of unfused genes.
BenchCT: RNA-Seq qualitative analysis assessment
To assess the RNA-Seq analysis results based on sim-ulated data, we have developed BenchCT. It loads the reference “truth database” of known dataset character-istics and compares it to the output files (SAM, BED, VCF, software specific files) of the pipelines being eval-uated. For each characteristic, BenchCT classifies pre-dictions as TP (true positives), FP (false positives) or FN (false negatives). We then compute two metrics for qualitative analysis: (precision = TP/(TP + FP) and
recall = sensitivity = TP/(TP + FN)). BenchCT
uses genomic interval-trees available as CracTools-core
modules, useful for quickly checking whether a posi-tion is at a given distance of the known posiposi-tion in the “truth database”.
Evaluation procedures
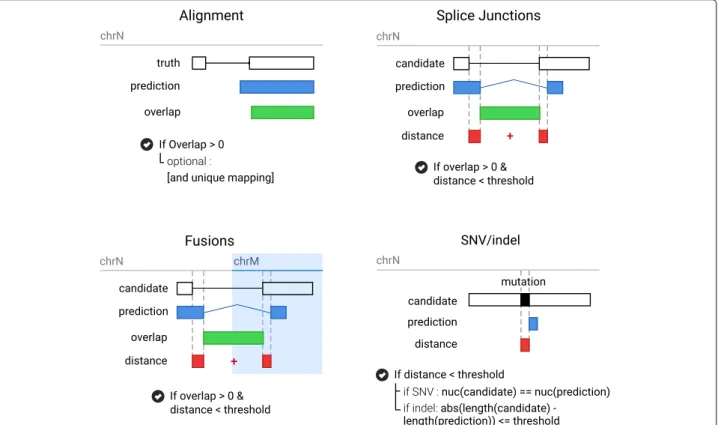
With BenchCT, we propose standardized procedures for the binary classification of alignments, splice junctions, indels, SNVs and fusions predictions. For each of these events, we have proposed a means of comparison of results with the “truth database” (see Fig. 3). In the case where several alignments can correctly be made, it may be possible to find multiple event/mutation scenarios that explain the simulated data-set. In such cases, BenchCT attempts to score these solutions as correct using a heuris-tic approach.
Alignment evaluation BenchCTalignment evaluation is performed as follows: if a proposed alignment overlaps the real alignment by at least one base (encoded in the read name), it is considered as true. Parameters can be set to ignore some alignments (ie. multi-mapped reads) that are counted as false positives (FP). If multiple alignments are found for the same read, only the first one encountered is evaluated and the others ignored.
Splice junction evaluation BenchCTdefines splice junc-tions as genomic intervals (or GI).
GI= (chr, start, end, strand)
True splice junctions are loaded in a GI-tree. This data structure, built with a set of interval-trees for each chro-mosome strand, can later be queried against a splice junction predicted by an analysis pipeline to find overlap-ping true splice junctions. An evaluated splice prediction
p, defined as a GI, is then searched in the GI-tree and any resulting overlapping GIs are then included in the set C of candidates. For each candidate c ∈ C we compute the distance
d(p, c) = |pstart− cstart| + |pend− cend|
If the distance d is less or equal than the threshold defined (default value is 10), the splice is considered true.
If multiple predictions correspond to the same can-didate, only the first is counted as a TP and the others ignored. If multiple candidates match a predic-tion, we select the one having the minimum distance (arg mincd(p, c)). The same treatment applies to indels, SNVs and fusions.
Indels and SNVs evaluation The mutations are eval-uated with the same GI procedure were start and end
Fig. 3 BenchCT evaluation procedures. Each event is evaluated with benchCT with a specific procedure that allow approximate matching. For alignement, only overlap between the prediction and the truth is evaluated. For Splice junctions and Fusions we expect an overlap between the prediction and a candidate in the truth database with a limited agreement distance according to the threshold. For mutation (SNV and Indel), similar procedure is used, as well as the verification of the mutation. For SNVs we evaluate the mutated sequence and for insertions and deletions, the length of the mutation
positions are equal, and the strand is left undefined. The GI p used to search the GI-tree is defined as
p= (pchr, ppos− threshold, ppos+ threshold)
For indels we evaluate the distance between the pre-dicted indel length and the observed one according to the threshold. For SNVs we also verify the validity of the predicted mutated nucleotide. The default threshold for mutations is 5.
Fusions evaluation Fusions are evaluated in the same way as the other GI-based evaluations; fusion intervals are defined as(chr1, pos1, strand1, chr2, pos2, strand1) and
transformed into regular GI with chr= chr1·chr2, start=
pos1, end= length(chr1)+pos2, strand= strand1·strand2.
The default distance threshold for fusions is set to 20.
Simulated dataset
Simulated dataset used in the results were generated using the primary assembly of the version GRCh38 of the human genome. Annotations were downloaded from Ensembl FTP (version 86) in GTF format. SNVs were introduced at a rate of 0.0014 and 0.0016 (‘-s‘ option) for normal and somatic condition respectively. Insertions and dele-tions were introduced at a rate of 0.0001 (‘-d‘ and ‘-i‘ options) in both conditions with max indel length set to default (15). SimCT was used with vcffile and --vcf-ratio 0.95options to randomly take 95% of the mutations from the VCF file of common SNP provided by dbSNP (version 20160527). Finally 100 fusions (number chosen arbitrarily) were introduced for the somatic con-dition. This does not mean that all of the fusions genes are expressed and found in the RNA-Seq data as this depends on the expression profile randomly generated by
FluxSimulator.
Expression profiles were generated using the follow-ing parameters for FluxSimulator: k = −0.7, x0 =
15, 000, 25, 000 for normal and somatic conditions respec-tively, x1 = x20, NB_MOLECULES= 106. NB_MOLECULES
is the number of expressed transcript molecules. Param-eters k and x0 are part of a mixed power and
exponen-tial law of the expression profile, where k is the expo-nent of the rank of gene expression. This means that the smaller k the smaller the decay of the expression resulting in highly expressed transcripts having closer expression levels. x and x1 govern the parameter of
the exponential decay by multiplying the rank of gene expressionk. This mostly affects the tail of the gene expres-sion spacing the differences further out between lowly expressed genes. Parameter ranges were estimated for mammalian cells by nonlinear fitting to expression lev-els observed in experimental results by the developers of
FluxSimulator [18] and were chosen accordingly in the
suggested ranges. For a more detailed explanation we refer to the paper and webpage of FluxSimulator.
Two data-sets were generated for each of the condi-tions (normal and somatic), varying the length of the reads (101bp and 150bp) for a given sequencing depth of 160 million paired-end reads. The fragment length was set to 250bp with a standard deviation of 50bp and initial biological material was set 10 million molecules. Finally we provided FluxSimulator a custom error model cali-brated on Illumina Hiseq 2500 data retrieved from SRA (SRR1611183), mapped with GEM mapper [23] and cali-brated with FluxSimulator ‘-t errormodel’ option.
Tools and parameters
Mutation discovery pipelines
Twelve mutation discovery pipelines were defined: 1. Three based on STAR mapping; (1) STAR with
Freebayes, (2) STAR with GATK (HaplotypeCaller), and (3) STAR with SAMtools (mpileup and bcftools). 2. Three with Hisat2 mapping; (4) Hisat2 with
Freebayes, (5) Hisat2 with GATK (HaplotypeCaller), and (6) Hisat2 with SAMtools (mpileup and bcftools). 3. Three with Hisat2_2pass mapping; (7) Hisat2_2pass
with Freebayes, (8) Hisat2_2pass GATK
(HaplotypeCaller), and (9) Hisat2_2pass SAMtools (mpileup and bcftools).
4. One using CRAC mapping software (10) that integrates its own calling algorithm.
5. Two “meta-calling” pipelines that are the union of the results of two pipelines using bcftools merge command; (11) A combination of STAR-GATK and CRAC variants, and (12) A combination of
STAR-GATK and Hisat2_2pass-GATK.
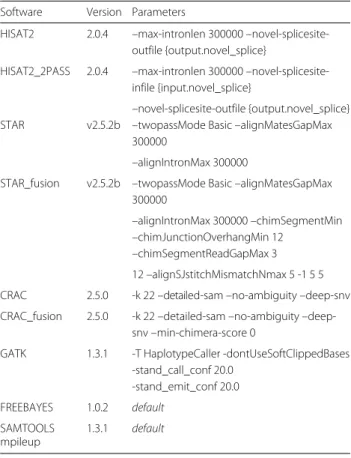
Mapping software settings and versions are described in the Table 1, they are identical for all datasets. Hisat2_2pass consists in running Hisat2 a second time on the same dataset using splice junctions discovered at the first pass.
The variant calling pre-processing procedure has been adapted from GATK best practices [24]. For all mapping procedures we applied the following procedure:
1. Mark duplicates withPicardTools.
2. ApplySplitNTrim (GATK command) procedure which splits reads into exon segments (removing Ns but maintaining grouping information) and hard-clip any sequences overhanging into the intronic regions. 3. ApplyReassignOneMappingQuality (GATK
command) read filter to reassign all good alignments to the default value of 60.
This re-calibration pipeline produced a BAM file used by the variant calling software whose versions and set-tings are described in Table 1. For the CRAC pipeline
Table 1 Software versions and parameters used to generate the
results
Software Version Parameters
HISAT2 2.0.4 –max-intronlen 300000 –novel-splicesite-outfile {output.novel_splice}
HISAT2_2PASS 2.0.4 –max-intronlen 300000 –novel-splicesite-infile {input.novel_splice}
–novel-splicesite-outfile {output.novel_splice} STAR v2.5.2b –twopassMode Basic –alignMatesGapMax
300000
–alignIntronMax 300000
STAR_fusion v2.5.2b –twopassMode Basic –alignMatesGapMax 300000
–alignIntronMax 300000 –chimSegmentMin –chimJunctionOverhangMin 12
–chimSegmentReadGapMax 3 12 –alignSJstitchMismatchNmax 5 -1 5 5 CRAC 2.5.0 -k 22 –detailed-sam –no-ambiguity –deep-snv CRAC_fusion 2.5.0 -k 22 –detailed-sam –no-ambiguity
–deep-snv –min-chimera-score 0
GATK 1.3.1 -T HaplotypeCaller -dontUseSoftClippedBases -stand_call_conf 20.0 -stand_emit_conf 20.0 FREEBAYES 1.0.2 default SAMTOOLS mpileup 1.3.1 default
we have used the cractools extract command that produces a VCF file from a BAM file produced with CRAC.
Gene fusions discovery pipeline
For gene fusions we ran special versions of CRAC and STAR called CRAC_fusion and STAR_fusion that are described in the Table 1. Hisat2 was not included here, since it does not support fusion discovery. STAR_fusion and CRAC_fusion parameters were set to classify as a fusion, colinear junctions having a distance superior to 300kb identical to SimCT fusions definition.
STAR_fusion was run with the --chimSegmentMin option varying from 10 to 30 (10, 12, 14, 16, 18, 20, 22, 24, 26, 28, 30).This option controls the minimum mapped length of the two segments that is allowed. The fusions detected by STAR are listed in the file called Chimeric.out.junctionthat contains one line per chimeric alignment. These alignments were summarized based on the chimeric breakpoints, and filtered-out to remove chimeric alignments not defined at the base level (field 8 >= 0) and further filtered with a minimum recurrence threshold of 2.
The fusions from CRAC were extracted from the BAM file using cractools extract and further filtered
with a minimum recurrence threshold of 2. We then cre-ated multiple versions of CRAC_fusion by filtering fusions based on their chim_values from 0 to 1 (0, 0.2, 0.4, 0.6, 0.8, 0.85, 0.9, 0.95, 1). This options controls the algorithmic quality of chimeric junctions detected by CRAC based on a machine learning procedure [25].
Evaluation and reporting
BenchCT parameters
BenchCT was run using default threshold parameters described in “Evaluation procedures” section. For align-ments we used the option “max_hits” to limit evaluation to alignments having the SAM’s “NH” field equal to 1.
Reporting
The automatic reporting procedure includes an preci-sion/recall plot for each evaluated event, displaying these two metrics (computed by BenchCT) along with the Fscore that is used to order the pipelines.
Fscore= 2 ×recall× precision recall+ precision
BenchCT was parametrized to output true positives (TP) that were used to build intersection plots with Upset [26] R package.
Results
Our objective was to create a use-case relevant to genomic medicine by creating realistic simulated RNA-Seq data-sets and using them to compare performance of twelve state-of-the-art pipelines. Our benchmarks determined the ability of each pipeline to detect biological events relevant to the needs of genomic medicine.
A corpus for medicine genomxic
We generated four sets of RNA-Seq data relevant to genomic medicine, with documented characteristics that correspond to specific biological questions, in order to provide a consistent and reproducible basis for the evalu-ation of pipelines.
The four data-sets were designed to address the sequencing of human samples in two biological contexts; normal and somatic cells. The normal condition contains a genomic layer of polymorphisms with rates close to the observations of 1000 genomes [27]. To improve our sim-ulation quality, 95% of introduced mutations were taken from common human polymorphisms [28]. The somatic condition contains higher mutation rates, a more complex gene expression profile and gene fusions.
Two data-sets were generated for each of these condi-tions, varying the length of the reads (101bp and 150bp) and using a sequencing depth of 2x80 million paired-end reads. These two lengths were chosen to mimic the
Illumina Hiseq 2500 sequencing platform which typi-cally produces these read lengths. The deep sequencing was used to create a base dataset that can be further sub-sampled for other applications.
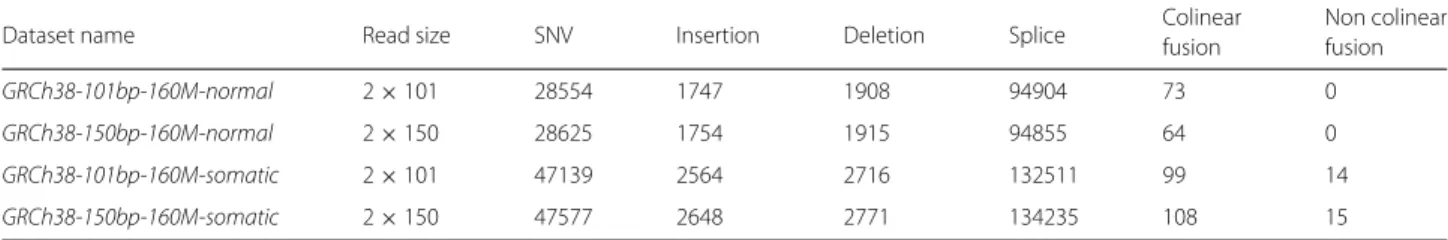
The Table 2 is a summary of the four data-sets that con-stitute our genomic medicine corpus; a detailed descrip-tion of SimCT and FluxSimulator parameters is described in “Simulated dataset” section of the method.
Aligner selection
The first step in the bioinformatic analysis process is alignment. For this reason, we selected three aligners for the benchmark; (i) CRAC [29] for its high precision, (ii) STAR [30] for its sensitivity and, (iii) Hisat2 [31] which offers a good compromise between precision and recall (Additional file 1: Figures S2 and S3).
We then evaluated the predictions of twelve variant call-ing pipelines based on these three aligners and three vari-ant callers (see “Mutation discovery pipelines” section). Then, we used SimBA to optimize mapping software predictions for gene fusions by independently tuning their parameters (see “Gene fusions discovery pipeline” section).
In the following, we discuss only part of results, by selecting representative dataset and evaluation metrics. Complete results are available as supplementary material.
Benchmarking performance in SNV detection
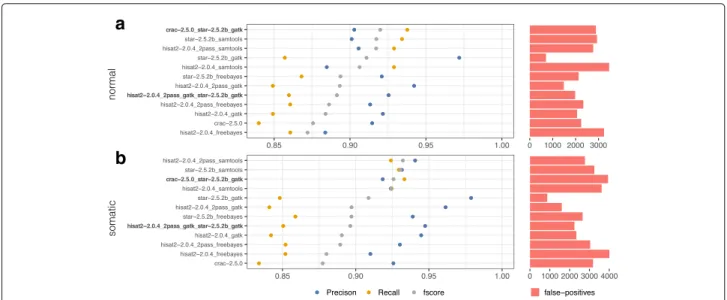
This benchmarking resulted in the following observations for SNV detection (see Fig. 4).
Performance in identifying SNVs varies significantly depending on the pipeline. An example of this is the STAR-GATK pipeline which is the most accurate (>97%) while all other pipelines provide precision of between 90 and 95%. The SAMtools [32] caller has a much higher recall than GATK [33] and Freebayes [34] regardless of the aligner (∼92% vs ∼ 85%).
We observed significant differences in calling pipeline performance between “normal” (Fig. 4a) and “somatic” (Fig. 4b) data-sets. For example, Hisat2_2pass-GATK results vary from 91 to 94% of precision between normal and tumoral data-sets (datasets A and B), implying that there is background noise that is progressively smoothed by the addition of new real biological events.
Performance differences also occurred when different variant calling procedures are used with the same aligner. If we consider the example of SAMtools vs STAR-GATK in Fig. 4a, we obtain results of 90%/93% versus 97%/86% in term of precision/recall.
Performance was heavily impacted by the configuration settings of any given tool. For example, when Hisat2 is run in two-pass mode, precision is improved (+5% on aver-age) but processing time (∼ 1h10 with 10 CPUs) double (Additional file 1: Figure S1).
Our experiments show that the size of the reads has no discernible impact on the SNV results delivered by the pipelines which allowed us to focus our attention on the 150bp data-sets (Additional file 1: Figure S4).
We also discovered that the performance of the pipelines can be significantly improved by combining certain complementary tools. The meta-calling pipelines were defined based on the true positive intersections (ex: Fig. 5b) to maximize the recall for both SNVs and indels. As an example, in the Fig. 4b, CRAC and STAR-GATK identify each ∼ 4000 true SNV’s which allows a gain in recall from 85% for both tools independently to 93% when they are combined, while maintaining excellent precision. It must be stressed that all the pipelines are not nec-essarily complementary. For example, the meta-pipeline Hisat2-GATK + STAR-GATK perform worse than the “simple” STAR+GATK pipeline (ex: Fig 4b similar recall but precision decreases from 98 to 95%).
Benchmarking performance in detecting insertions and deletions
The insertion and deletion benchmarks displayed the same tendencies on all four data-sets (Additional file 1: Figures S5 and S6); In general, CRAC is very accu-rate (> 99% precision with fewer than 10 false posi-tives per data-set), STAR-GATK is very sensitive (> 75% recall) and Hisat2_2pass-GATK provides a good preci-sion/recall compromise (Fscore ∼ 0.8). We selected the
GRCh38-150bp-160M-somaticdata-set for insertion call-ing in Fig. 5.
In all cases the meta-pipeline CRAC+STAR-GATK pro-duced best results with ∼ 85% recall, ∼ 97% precision and an Fscore > 0.9. We observed the same trend with the other “meta-pipeline”
Hisat2_2pass-GATK+STAR-Table 2 Summary of the data-sets characteristics
Dataset name Read size SNV Insertion Deletion Splice Colinearfusion Non colinearfusion
GRCh38-101bp-160M-normal 2× 101 28554 1747 1908 94904 73 0
GRCh38-150bp-160M-normal 2× 150 28625 1754 1915 94855 64 0
GRCh38-101bp-160M-somatic 2× 101 47139 2564 2716 132511 99 14
a
b
Fig. 4 Precision and recall of SNV calling. a SNV precision/recall in GRCh38-150bp-normal data-set. b SNV detection in GRCh38-150bp-somatic data-set
a
b
Fig. 5 Precision and recall of indel calling. a Insertion precision/recall in GRCh38-150bp-somatic. b Intersections of true positives insertions found by calling pipelines in the GRCh38-150bp-somatic data-set
GATK, as we did in the case of SNVs; sensitivity was scarcely better than STAR-GATK while precision was lower.
To illustrate this performance difference between the pipelines, let us consider the number of actual dele-tions identified by each; STAR-GATK identified 2091 deletions, Hisat2_2pass-GATK+STAR-GATK performed slightly better with 2125 more true positives (+ 1pt) while CRAC+STAR-GATK performed substantially better iden-tifying 2295 (+ 10pts).
A key point is that by combining outputs of complemen-tary tools, it is possible to improve recall without precision loss as can be seen in the case of the CRAC+STAR-GATK combination. The Freebayes caller seems less well suited to RNA-Seq using default parameters with less pre-cision and recall than the two other callers. A final point to consider is the impact of the biological event being examined on the performance between the benchmarked tools. For example, the Hisat2_2pass-SAMtools pipeline, though well suited to detection of SNVs performs poorly in detecting indels with precision that falls from 94 to 80% and recall that falls from 92 to 54% (Fig. 4b vs Fig. 5a).
Benchmarking performance in detecting gene fusions
In this third use-case, we examined fusion detection and, specifically, the detection of reads with a chimeric junction.
Many studies on the subject have been published [35–37] but none have fully addressed the problem of alignment associated with this type of event. This is signif-icant as incorrect or ambiguous alignment can, by itself, generate substantial numbers of false fusions. We selected two mappers optimized for the detection of fusions; CRAC with the integration of a model based on machine learning [25] and STAR that recently added a procedure to identify reads associated with fusions. We varied two parameters in these tools, CRAC’s chim_value and STAR’s
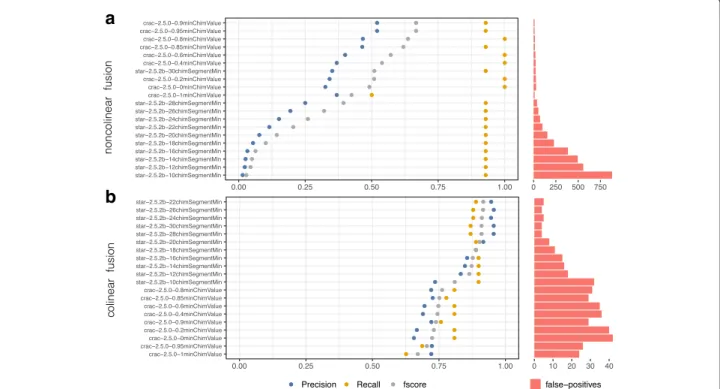
chim_segment. Figure 6 confirms that these two param-eters have tremendous impact on precision related to fusion detection (especially those that are non-colinear).
Observing the influence of the cutoff parameter on
Fscore, there is a direct correlation (Fig. 6a); the greater the value of STAR’s chim_segment or CRAC’s chim_value, the more the precision increases (rising from 0 at 10% of precision for a chim_segment varying from 10 to 30). This underlines the importance of testing candidate pipelines with different cutoff values against a reference data-set to identify the best settings to address any given biological question.
It is however difficult to declare STAR or CRAC bet-ter suited for our simulated data-sets as somatic data-sets have a very low number of true fusions to realistically simulate the biological question (see Table 2). Indeed, between the 101bp and the 150bp data-sets performances
a
b
Fig. 6 Precision and recall of gene fusion detection. Evaluation of gene fusions detection pipelines on the GRCh38-101bp-160-somatic dataset. Fusions were splited in two category with an individual evaluation. a Colinear fusion where the fusion involves to genomic locations that are located on the same strand of the same chromosome with a distance superior to 300kb. b non-colinear fusions wich does not satisfy the colinear criteria
of STAR and CRAC are very different. STAR, with 30 chim_segment, yields a better Fscore (0.65) than CRAC (0.25) with a 0.85 chim_value (see Fig. 6). It is very unlikely that these differences are due to the length of sequences, but rather to the nature of fusions in each data-set (see Additional file 1: Figures S7 to S8).
We also observe that colinear fusion predictions are more accurate than in the case of non-colinear fusions for both aligners, (see Fig. 6 a and b).
Nevertheless, sensitivity for both types of fusions is high when using both CRAC and STAR with an average value of between 80% and 90% of fusions detected on all data-sets examined.
In conclusion, it can be said that the principal challenge in exploring fusions is to correctly configure the tools for the specific data-set being examined as this significantly reduces the number of false-positives produced during the alignment phase. Indeed, eliminating false chimeric align-ments at the very first step of a fusion gene detection pipeline is much safer than using empirical filters based on annotations later on, as true fusions could be incorrectly filtered out.
Discussion
Limitation of benchmarked tools studies
Numerous benchmarking studies of RNA-Seq analysis tools have since been conducted the appearance of RNA-Seq. The problem is that each study relies on its own simulated data-sets as a basis for the comparison of tools rendering comparisons between tools evaluated in differ-ent studies difficult. The methodology used to assess how close the predictions are to the truth also varies from one study to another. A further source of difficulty is that the tools themselves are constantly being upgraded mak-ing it virtually impossible to obtain a reliable, updated view of the performance of all the available tools on the market at a given moment in time. This means that it is impossible to reliably compare performance figures between studies to draw conclusions on the best pipelines to use to answer a specific biological question. As an example, the RGASP project [8] only represents a picture of benchmarked tools at the time of the study, though most of the tools benchmarked have been upgraded since. Such difficulties underline the need for a benchmark methodology that can reflect results of latest software versions.
We believe that in order to have an accurate pic-ture of performance of available tools, the community must have access to a corpus of realistic simulated data-sets that emulate various biological conditions. The impact of results on the variant calling (see “Benchmarking performance in SNV detection” section) according to the mutation rate of the input data-set illus-trates the need to have standardized reference data-sets
that allow an equitable, accurate benchmarking of all tools according to a biological context.
Need a solution to benchmark tools
Because the examination of some biological questions require more sensitivity while others require higher pre-cision or must be capable of running using limited com-putational resources, users need a solution that offer possibility to choose the right bioinformatic components for an analysis depending on the specific biological ques-tion and computaques-tional environment available.
To illustrate this, our study relies on two standard cases of biological questions; variant calling and gene fusion detection. The proposed approach changes the focus of bioinformatic benchmarking from evaluations of discrete algorithmic components to an evaluation of a complete pipeline’s ability to provide meaningful answers to genomic medicine problems. This facilitates the evalu-ation of new tools by the community fostering more rapid innovation in this field.
Even if an original approach based on this principle [17] was announced, enabling users to quickly compare genomic aligners in a dynamic and flexible manner, the proposed approach is only dedicated to the benchmark of genomic aligners. Thus, to the best of our knowledge, there is no modular, interactive solution to benchmarking RNA-Seq software.
SimBA a modular benchmarking workflow
We have designed SimBA, as two independent compo-nents, SimCT and BenchCT, that were conceived in a modular fashion with the objective of extending their features and scope of relevance.
SimCT’s modular design makes it possible to include other read simulators to handle emerging sequencing technologies such as “Oxford Nanopore” or “PacBio” sequencers via a “plug-in” architecture. A similar “plug-in” approach to profile simulators has also been adopted.
SimCT is not restricted to RNA-Seq as WGS or exome sequencing simulators could be integrated to produce multi-omics analysis benchmarks. The modularity of
SimCT, makes it easy to extend it in the near-term to the sequencing of multi-clonal tumoral transcriptomes, where a sample contains a heterogenous mixture of cancer cell clones that have emerged from a common ancestor.
BenchCTis a complete solution, featuring an easy instal-lation, advanced algorithms, fast execution, multi-core architecture support. BenchCT is also highly configurable thanks to its YAML setup file. BenchCT was designed to provide an easy way to benchmark tools with inter-pretable metrics, sensitivity and precision. However, we plan to incorporate the evaluation of expression estimates into SimBA as the community defines more standardized comparison metrics [7, 14]. In future, we also intend to
include other qualitative evaluation cases, such as tran-script reconstruction.
Conclusion
We propose SimBA, an open benchmarking solution that can be used to generate simulated data-sets with high configurability as well as a means to evaluate the perfor-mances of analysis pipelines as they relate to various qual-itative questions such as read alignment, variant calling and gene fusion detection.
In this paper, we have created a means for comparison of results related to questions relevant to genomic medicine by producing reference data-sets that mimic cancerous cells and the investigation of important events in this type of pathology such as mutations, indels and fusions. The results described in our paper emphasize the need for a benchmarking tool that can: (i) Simulate reference data-sets emulating a specific biological context, (ii) Calibrate a pipeline for a data-set specific to a biological question,
(iii)Aggregate and compare results of a variety of bioin-formatic tools to explore how the combination of various tools impacts the overall performance.
By contrast to the existing work on the RNA-seq anal-ysis, we focused on the necessity of proposing a flexible and integrated benchmarking suite that helps users opti-mize their workflows for biological questions. SimBA gives a standard analysis methodology and benchmark data-sets which guarantee a high level of accuracy and reproducibility.
Availability and requirements Project name:SimBA;
Project home page:http://cractools.gforge.inria.fr/ softwares/simba/;
Operating systems:Linux/MAC;
Programming language:Perl;
Other requirements:Perl5, cpanm, Flux Simulator, cractools-core;
License:MIT
Endnote
1A preliminary search on Google Scholar with “Tophat2
‘default parameters”’ returns about 1000 results compared to 4,500 for TopHat2 alone
Additional file
Additional file 1: Supplemental Materials: SimBA: A methodology and
tools for evaluating the performance of RNA-Seq bioinformatic pipelines. (PDF 259 kb)
Abbreviations
BAM: Binary sequence alignement/map (SAM) format; BED: Browser extensible data format; Flux: FluxSimulator; FN: False negative; FP: False positive; Fusion: Gene fusion; GI: Genomic interval; GI-tree: Genomic interval-tree; GTF: Gene
transfer format; Indel: Insertion and deletion; NGS: Next generation
sequencing; NA-Seq: RNA-Sequencing; SaaS: Software as a service; SNV: Single nucleotive variant; TP: True positive; VCF: Variant call format; YAML: YAML ain’t markup language; WGS: Whole genome sequencing
Acknowledgments
We thank Anthony Boureux, for supporting the computing infrastructure used to generate the results in this study. We also thank Vincent Maillol and Eric Rivals for earlier work on this project.
Funding
JA is a doctoral fellow of the Fondation pour la Recherche Médicale (FRM, BIOINFO2013 call, grant noDBI20131228566). SB is fellowship of SATT AxLR, la
Région Occitanie, and Montpellier Métropole Méditerranée. Institute of Computational Biology, Investissement d’Avenir.
Availability of data and materials
SimBA software suite as well as the four simulated data-sets and the Snakemake pipeline used to generate the results for this study are freely available at http://cractools.gforge.inria.fr/softwares/simba/.
Authors’ contributions
JA, TC, MS and NP initiated the project. JA, MS and NP performed the analytic work and implementation of the pipeline. JA, SB and NP performed the experimental work and contributed to pipeline testing. JA, CG, JMH and NP contributed to the writing of the paper. All authors read and approved the final manuscript.
Ethics approval and consent to participate
Not applicable.
Consent for publication
Not applicable.
Competing interests
The authors declare that they have no competing interests. Publisher’s Note
Springer Nature remains neutral with regard to jurisdictional claims in published maps and institutional affiliations.
Author details
1SeqOne, IRMB, CHRU de Montpellier -Hopital St Eloi, 80 avenue Augustin
Fliche, 34295 Montpellier, France.2Institute of Computational Biology,
Montpellier, 860, Rue Saint-Priest, 34095 Montpellier Cedex 5, France.
3University Lille, CNRS, Centrale Lille, Inria, UMR 9189 - CRIStAL - Centre de
Recherche en Informatique Signal et Automatique de Lille, F-59000 Lille, France.4University Bordeaux, Inserm, BMGIC, U1035, 33076 Bordeaux, France.
Received: 20 January 2017 Accepted: 8 September 2017
References
1. Byron SA, Van Keuren-Jensen KR, Engelthaler DM, Carpten JD, Craig DW. Translating RNA sequencing into clinical diagnostics: Opportunities and challenges. Nat Rev Genet. 2016;17(5):257–71. doi:10.1038/nrg.2016.10. 2. Seqc/Maqc-Iii Consortium. A comprehensive assessment of RNA-seq
accuracy, reproducibility and information content by the Sequencing Quality Control Consortium. Nat Biotechnol. 2014;32(9):903–14. doi:10.1038/nbt.2957.
3. Conesa A, Madrigal P, Tarazona S, Gomez-Cabrero D, Cervera A, McPherson A, Szcze´sniak MW, Gaffney DJ, Elo LL, Zhang X, Mortazavi A. A survey of best practices for RNA-seq data analysis. Genome Biol. 2016;17:13. doi:10.1186/s13059-016-0881-8.
4. Garber M, Grabherr MG, Guttman M, Trapnell C. Computational methods for transcriptome annotation and quantification using RNA-seq. Nat Methods. 2011;8(6):469–77. doi:10.1038/nmeth.1613.
5. Seo JS, Ju YS, Lee WC, Shin JY, Lee JK, Bleazard T, Lee J, Jung YJ, Kim JO, Shin JY, Yu SB, Kim J, Lee ER, Kang CH, Park IK, Rhee H, Lee SH, Kim JI, Kang JH, Kim YT. The transcriptional landscape and mutational profile of lung adenocarcinoma. Genome Res. 2012. doi:10.1101/gr.145144.112.
6. Baruzzo G, Hayer KE, Kim EJ, Di Camillo B, FitzGerald GA, Grant GR. Simulation-based comprehensive benchmarking of RNA-seq aligners. Nat Methods. 2016;advance online publication. doi:10.1038/nmeth.4106. 7. Kanitz A, Gypas F, Gruber AJ, Gruber AR, Martin G, Zavolan M.
Comparative assessment of methods for the computational inference of transcript isoform abundance from RNA-seq data. Genome Biol. 2015;16:150. doi:10.1186/s13059-015-0702-5.
8. Engström PG, Steijger T, Sipos B, Grant GR, Kahles A, The RGASP Consortium, Rätsch G, Goldman N, Hubbard TJ, Harrow J, Guigó R, Bertone P. Systematic evaluation of spliced alignment programs for RNA-seq data. Nat Methods. 2013;10(12):1185–91.
doi:10.1038/nmeth.2722.
9. Caboche S, Audebert C, Lemoine Y, Hot D. Comparison of mapping algorithms used in high-throughput sequencing: Application to Ion Torrent data. BMC Genomics. 2014;15:264. doi:10.1186/1471-2164-15-264. 10. Grant GR, Farkas MH, Pizarro AD, Lahens NF, Schug J, Brunk BP,
Stoeckert CJ, Hogenesch JB, Pierce EA. Comparative analysis of RNA-Seq alignment algorithms and the RNA-Seq unified mapper (RUM). Bioinformatics (Oxford, England). 2011;27(18):2518–28. doi:10.1093/bioinformatics/btr427.
11. Sun Z, Bhagwate A, Prodduturi N, Yang P, Kocher J-PA. Indel detection from RNA-seq data: Tool evaluation and strategies for accurate detection of actionable mutations. Brief Bioinform. 2016;069.
doi:10.1093/bib/bbw069.
12. Piskol R, Ramaswami G, Li JB. Reliable Identification of Genomic Variants from RNA-Seq Data. Am J Human Genet. 2013;93(4):641–51.
doi:10.1016/j.ajhg.2013.08.008.
13. Quinn EM, Cormican P, Kenny EM, Hill M, Anney R, Gill M, Corvin AP, Morris DW. Development of Strategies for SNP Detection in RNA-Seq Data: Application to Lymphoblastoid Cell Lines and Evaluation Using 1000 Genomes Data. PLOS ONE. 2013;8(3):58815.
doi:10.1371/journal.pone.0058815.
14. Teng M, Love MI, Davis CA, Djebali S, Dobin A, Graveley BR, Li S, Mason CE, Olson S, Pervouchine D, Sloan CA, Wei X, Zhan L, Irizarry RA. A benchmark for RNA-seq quantification pipelines. Genome Biol. 2016;17:74. doi:10.1186/s13059-016-0940-1.
15. Giese SH, Zickmann F, Renard BY. Specificity control for read alignments using an artificial reference genome-guided false discovery rate. Bioinformatics (Oxford, England). 2014;30(1):9–16.
doi:10.1093/bioinformatics/btt255.
16. Kumar PKR, Hoang TV, Robinson ML, Tsonis PA, Liang C. CADBURE: A generic tool to evaluate the performance of spliced aligners on RNA-Seq data. Sci Rep. 2015;5:13443. doi:10.1038/srep13443.
17. Smolka M, Rescheneder P, Schatz MC, von Haeseler A, Sedlazeck FJ. Teaser: Individualized benchmarking and optimization of read mapping results for NGS data. Genome Biol. 2015;16:235. doi:10.1186/s13059-015-0803-1. 18. Griebel T, Zacher B, Ribeca P, Raineri E, Lacroix V, Guigó R, Sammeth M.
Modelling and simulating generic RNA-Seq experiments with theflux simulator. Nucleic Acids Res. 2012;40(20):10073–83. doi:10.1093/nar/gks666. 19. Ewing AD, Houlahan KE, Hu Y, Ellrott K, Caloian C, Yamaguchi TN, Bare JC,
P’ng C, Waggott D, Sabelnykova VY, et al. Combining tumor genome simulation with crowdsourcing to benchmark somatic
single-nucleotide-variant detection. Nat Methods. 2015;12(7):623–30. 20. Köster J, Rahmann S. Snakemake—a scalable bioinformatics workflow engine.
Bioinformatics. 2012;28(19):2520–2. doi:10.1093/bioinformatics/bts480. 21. Bˇrinda K, Boeva V, Kucherov G. RNF: A general framework to evaluate
NGS read mappers. Bioinformatics. 2016;32(1):136–9. doi:10.1093/bioinformatics/btv524.
22. Li H, Handsaker B, Wysoker A, Fennell T, Ruan J, Homer N, Marth G, Abecasis G, Durbin R, 1000 Genome Project Data Processing Subgroup. The Sequence Alignment/Map format and SAMtools. Bioinformatics (Oxford, England). 2009;25(16):2078–9. doi:10.1093/bioinformatics/btp352. 23. Marco-Sola S, Sammeth M, Guigó R, Ribeca P. The GEM mapper: Fast,
accurate and versatile alignment by filtration. Nat Methods. 2012;9(12): 1185–8. doi:10.1038/nmeth.2221.
24. GATK Calling Variants in RNAseq. https://software.broadinstitute.org/ gatk/guide/article?id=3891. Accessed 21 Jan 2017.
25. Beaumeunier S, Audoux J, Boureux A, Ruffle F, Commes T, Philippe N, Alves R. On the evaluation of the fidelity of supervised classifiers in the prediction of chimeric RNAs. BioData Mining. 2016;9:34.
doi:10.1186/s13040-016-0112-6.
26. Lex A, Gehlenborg N, Strobelt H, Vuillemot R, Pfister H. UpSet: Visualization of Intersecting Sets. IEEE Trans Vis Comput Graph. 2014;20(12):1983–92. doi:10.1109/TVCG.2014.2346248.
27. The 1000 Genomes Project Consortium. A global reference for human genetic variation. Nature. 2015;526(7571):68–74. doi:10.1038/nature15393. 28. Kitts A, Sherry S. The Single Nucleotide Polymorphism Database (dbSNP)
of Nucleotide Sequence Variation: National Center for Biotechnology Information (US). The NCBI Handbook; 2011.
29. Philippe N, Salson M, Commes T, Rivals E. CRAC an integrated approach to the analysis of RNA-seq reads. Genome Biol. 2013;14(3):30.
doi:10.1186/gb-2013-14-3-r30.
30. Dobin A, Davis CA, Schlesinger F, Drenkow J, Zaleski C, Jha S, Batut P, Chaisson M, Gingeras TR. STAR: Ultrafast universal RNA-seq aligner. Bioinformatics. 2012;635. doi:10.1093/bioinformatics/bts635. 31. Kim D, Langmead B, Salzberg SL. HISAT: A fast spliced aligner with low
memory requirements. Nat Methods. 2015;12(4):357–60. doi:10.1038/nmeth.3317.
32. Li H. A statistical framework for SNP calling, mutation discovery, association mapping and population genetical parameter estimation from sequencing data. Bioinformatics (Oxford, England). 2011;27(21): 2987–93. doi:10.1093/bioinformatics/btr509.
33. McKenna A, Hanna M, Banks E, Sivachenko A, Cibulskis K, Kernytsky A, Garimella K, Altshuler D, Gabriel S, Daly M, DePristo MA. The Genome Analysis Toolkit: A MapReduce framework for analyzing next-generation DNA sequencing data. Genome Res. 2010;20(9):1297–303.
doi:10.1101/gr.107524.110.
34. Garrison E, Marth G. Haplotype-based variant detection from short-read sequencing. arXiv:1207.3907 [q-bio]. 2012. 1207.3907.
35. Kumar S, Vo AD, Qin F, Li H. Comparative assessment of methods for the fusion transcripts detection from RNA-Seq data. Sci Rep. 2016;6:21597. doi:10.1038/srep21597.
36. Liu S, Tsai WH, Ding Y, Chen R, Fang Z, Huo Z, Kim S, Ma T, Chang TY, Priedigkeit NM, Lee AV, Luo J, Wang HW, Chung IF, Tseng GC. Comprehensive evaluation of fusion transcript detection algorithms and a meta-caller to combine top performing methods in paired-end RNA-seq data. Nucleic Acids Res. 2015;1234. doi:10.1093/nar/gkv1234. 37. Carrara M, Beccuti M, Lazzarato F, Cavallo F, Cordero F, Donatelli S,
Calogero RA. State-of-the-art fusion-finder algorithms sensitivity and specificity. BioMed Res Int. 2013;2013:340620. doi:10.1155/2013/340620.
• We accept pre-submission inquiries
• Our selector tool helps you to find the most relevant journal • We provide round the clock customer support
• Convenient online submission • Thorough peer review
• Inclusion in PubMed and all major indexing services • Maximum visibility for your research
Submit your manuscript at www.biomedcentral.com/submit