HAL Id: hal-03023985
https://hal.archives-ouvertes.fr/hal-03023985
Submitted on 25 Nov 2020HAL is a multi-disciplinary open access archive for the deposit and dissemination of sci-entific research documents, whether they are pub-lished or not. The documents may come from teaching and research institutions in France or abroad, or from public or private research centers.
L’archive ouverte pluridisciplinaire HAL, est destinée au dépôt et à la diffusion de documents scientifiques de niveau recherche, publiés ou non, émanant des établissements d’enseignement et de recherche français ou étrangers, des laboratoires publics ou privés.
Identification of small molecules disrupting the ubiquitin
proteasome system in malaria Running tittle: Inhibition
of P. falciparum Ubiquitin Proteasome System
Lydia Mata-Cantero, María Chaparro, Gonzalo Colmenarejo, Concepción Cid,
Álvaro Cortés, Manuel Rodriguez, Julio Martín, F Javier Gamo, Maria
Gomez- Lorenzo
To cite this version:
Lydia Mata-Cantero, María Chaparro, Gonzalo Colmenarejo, Concepción Cid, Álvaro Cortés, et al.. Identification of small molecules disrupting the ubiquitin proteasome system in malaria Running tit-tle: Inhibition of P. falciparum Ubiquitin Proteasome System. ACS Infectious Diseases, American Chemical Society, 2019, 5 (12), pp.2105-2117. �10.1021/acsinfecdis.9b00216�. �hal-03023985�
1
Identification of small molecules disrupting the ubiquitin proteasome
1
system in malaria
2 3
Running tittle: Inhibition of P. falciparum Ubiquitin Proteasome System
4 5
Lydia Mata-Cantero1, María Jesús Chaparro1,Gonzalo Colmenarejo1,*, Concepción Cid1, 6
Álvaro Cortés1, Manuel S. Rodriguez2, Julio Martín1, F. Javier Gamo1 and Maria G. Gomez-7
Lorenzo1,# 8
9
1Tres Cantos Medicines Development Campus, Diseases of the Developing World. 10
GlaxoSmithKline. Severo Ochoa 2, Tres Cantos 28760, Madrid, Spain.
11
2ITAV, Université deToulouse, CNRS and IPBS, Université de Toulouse, CNRS. 1 place Pierre 12
Potier, Oncopole entrée B, 31106 Toulouse, France.
13
* Current address: IMDEA Food, Biostatistics and Bioinformatics Unit. Ctra Cantoblanco 8 E-14 28049, Madrid, Spain 15 16 #Corresponding author: 17
Maria G. Gomez-Lorenzo: maria.g.gomez@gsk.com
18 19 E-mail addresses: 20 LMC lydia.c.mata@gsk.com 21 MJC maria.j.chaparro@gsk.com 22 CC conchacidcalzada@gmail.com 23 GC colmenarejo.gonzalo@gmail.com 24 AC alvarocortesc@gmail.com 25 FJG francisco-javier.b.gamo@gsk.com 26 JM Julio.J.Martin@gsk.com 27 MSR Manuel.RODRIGUEZ@itav.fr 28 29 30
2 Graphical abstract 31 32 33 Abstract 34 35
The Ubiquitin Proteasome System (UPS) is one of the main proteolytic pathways in
36
eukaryotic cells, playing an essential role in key cellular processes such as cell cycling and signal
37
transduction. Changes in some of the components of this pathway have been implicated in
38
various conditions, including cancer and infectious diseases such as malaria. The success of
39
therapies based on proteasome inhibitors has been shown in human clinical trials. In addition to
40
its proven tractability, the essentiality of the Plasmodium falciparum UPS underlines its potential
41
as a source of targets to identify new antimalarial treatments. Two assays, previously developed
42
14,747 P. falciparum inhibition growth
996
544 increased the levels ub-proteins
Dose response 100 µM (1/3) n=2 AlphaLISA
Dose response 100 µM (1/3) n=2 DELFIA
Single shot 10 µM n=2 AlphaLISA
311 validated
• PfpIC50>4 (β2 and β1)
Asym max>70%
• Human pIC50<4 Inactive
Asym max<50% 16
6
Human proteasome assays
P. falciparum selective P. falciparum proteasome assays
100 µM (1/3) n=2 % inhibition Pf26S>50% P. falciparum pIC50>4 NON-PROTEASOME INHIBITORS PROTEASOME INHIBITORS pIC50 Pf26S<4 % inhibition Pf26S<50% 169 1 cluster 28 clusters + 36 singletons: - 50 aminoalcohols - 61 phenols 82
6 Clusters with more than 3 compounds/cluster
295 Actives n≥1 AlphaLISA and n ≥ 1 DELFIA UPS SCREENING CAMPAIGN
n≥3 Alphalisa/DELFIA pEC50 Alphalisa/DELFIA >4.5 PROTEIN X UBA UBA UBA UBA GST UB UB UB UB Protein A Donor bead Excitation 680 nm FK2 ab anti ubiquitin O2 GSH Acceptor bead Emission 615 nm GST-TUBEs Eu- Ab Streptavidin plates Enhancement solution Emission 615 nm FK2 Ab Eu PROTEIN X UBA UBA UBA UBA Biotin UB UB UB UB Streptavidin Biotin TUBEs AlphaLISA (Mata-cantero et al. 2015)
P. falciparum growth inhibition
DELFIA
3
to quantify the parasite protein ubiquitylation levels in a high throughput format, have been used
43
to identify compounds that inhibit parasite growth by targeting P. falciparum UPS. Among the
44
positive hits, specific inhibitors of the P. falciparum proteasome have been identified and
45
characterized. Hits identified using this approach may be used as starting points for development
46
of new antimalarial drugs. They may also be used as tools to further understand proteasome
47
function, and to identify new targets in P. falciparum UPS.
48 49
Abbreviations
50
UPS, ubiquitin proteasome system; DUB, deubiquitinase; TUBEs, tandem ubiquitin binding
51
entities; UBA, ubiquitin-associated domains; iRBCs, infected red blood cells; HTS, high
52
throughput screening; S/B, signal to background; CV, coefficient of variation; SD, standard
53
deviation; Ub, ubiquitin; TCAMs, Tres Cantos antimalarial Set; PFI, Property Forecast Index; IFI,
54
Inhibition Frequency Index; ACTs, artemisinin combination therapies; NA, non-adjusted
55 56
Keywords
57
Plasmodium falciparum, proteasome, UPS, inhibitor, screening, ubiquitylation
58 59
Introduction
60 61
The most severe form of malaria is caused by the protozoan parasite Plasmodium
62
falciparum. This disease is one of the deadliest infectious diseases in the world, causing more
63
than 400,000 deaths per year (1). Current first-line treatment is based on artemisinin combination
64
therapies (ACTs). However, the malaria parasite has developed resistance against all widely used
65
antimalarials, and ACTs are not an exception. Increasing drug resistance has led to an urgent
66
need for developing new therapies effective not only on acute infection with high parasite loads
67
in blood, but also on different stages of the parasite to block transmission. Thus, identification of
68
drugs targeting different mechanisms in different stages of the parasite is crucial for malaria
69
eradication (2).
4
In recent years, P. falciparum ubiquitin proteasome system (UPS) has been considered a
71
promising target for drug development (3, 4). Ubiquitylation is a post-translational change in which
72
ubiquitin (Ub) is covalently bound to the target protein. This process requires the sequential action
73
of three groups of enzymes, E1 ubiquitin-activating enzymes, E2 ubiquitin-conjugating enzymes,
74
and E3 ligases. E3 ligases are the main responsible for substrate specificity leading to the transfer
75
of ubiquitin from the E2 ligase to the final substrate. This ubiquitylation process can also be
76
reverted by the action of deubiquitylation enzymes (DUBs). The cooperative interplay between
77
the ubiquitylation and deubiquitylation processes determines the prevalence of certain
78
ubiquitylated proteins in the cell and, thus, the activation/deactivation of specific functions (5).
79
Eukaryotic 26S proteasome consists of a 20S core, responsible for catalytic activity, and two
80
regulatory 19S particles located at both sides that control entry of ubiquitylated proteins into the
81
proteolytic core. 20S comprises four heptameric rings, of which the outer rings are formed by
82
alpha subunits and the inner rings by catalytic beta subunits, β1 (caspase-like), β2 (trypsin-like)
83
and β5 (chymotrypsin-like) (6).
84
UPS controls key processes in eukaryotic cells including apoptosis, cell cycle and DNA
85
repair. Thus, UPS deregulation has been related to multiple diseases such as cancer,
86
neurological disorders, and pathogen infections (7). In 2003, the proteasome inhibitor bortezomib
87
was the first drug within the UPS approved by the US Food and Drug Administration for the
88
treatment of multiple myeloma. Several UPS inhibitors have subsequently been launched or
89
tested in clinical trials (8, 9).
90
In addition to its proven tractability as drug target, different studies have revealed the
91
essentiality of P. falciparum UPS in its survival and transmission (10, 11). Irreversible inhibition of
92
parasite growth on all parasite stages has been seen using different types of human proteasome
93
inhibitors, some of them within the nanomolar range (3). Moreover, they also show a synergistic
94
behavior in resistant parasites when combined with artemisinin (3, 12). While P. falciparum
95
proteasome exhibits a high degree of homology with its human counterpart, some divergences
96
have been foundin the β2 active site by cryo-electron microscopy (12, 13). These divergences
97
are being exploited to develop inhibitors with selectivity for the parasite proteasome to avoid side
98
effects (12-14).
5
On the other hand, most studies of P. falciparum UPS are focused on the P. falciparum
100
proteasome remaining the UPS upstream components understudied. Although all the main UPS
101
components have been identified in the parasite genome in silico, only some of them have been
102
tested experimentally (15, 16). While E1 and E2 paralogs are highly conserved, E3 ligases and
103
DUBs are highly divergent, thus offering the possibility to develop selective drugs.
104
The objective of this study was to identify inhibitors with potential to interfere with any of the
105
steps involved in the parasite UPS. For that, two previously reported cellular assays that
106
quantitatively measure changes in ubiquitylated protein levels (17) were used. As a key
107
advantage, these methods do not require extensive or previous knowledge of the targets they are
108
hitting. A high throughput screening (HTS) campaign was run with the Tres Cantos AntiMalarial
109
Set (TCAMS), a GSK compound collection of ca 13K compounds that inhibits P. falciparum in
110
vitro growth (18). As a result, we were able to identify new chemical entities that inhibit the parasite
111
proteasome, validating the approach used. Moreover, compounds acting through other
112
components of the parasite UPS were also identified. All these hits can be followed up to develop
113
new antimalarial drugs with novel modes of action.
114
115
Results and discussion
116 117
High throughput screening at single shot with AlphaLISA assay
118 119
Two cellular assays previously developed were used to run an HTS campaign (17).
120
Progression cascade of the whole HTS can be found in the graphical abstract. In both assays,
121
the signal measured is proportional to the amount of ubiquitylated proteins amount present in P.
122
falciparum cells, allowing the identification of UPS inhibitors that are able to change the total levels
123
of ubiquitylated proteins in cells.
124
The homogeneous AlphaLISA assay was selected to perform the primary screening
125
campaign, as it can be run in 1536-well plates and requires no washing steps. AlphaLISA is a
126
cellular assay where compounds are incubated with infected red blood cells (iRBCs) for 1 hour.
127
This time of incubation was chosen to rule out that the changes measured in the total pool of
6
ubiquitylated protein after treatment are the result of the effect of the compound on other pathways
129
instead of on the UPS.
130
As the assay is cell-based the selected compound collection consisted of the TCAM set (18)
131
and other compounds from the GlaxoSmithKline HTS screening collection which inhibited P.
132
falciparum in vitro growth in previous whole cell phenotypic screenings. A total of 14,747
133
compounds were tested. The aim was to identify compounds that inhibit parasite growth through
134
the UPS, as the mechanisms of action of most compounds in this collection set remain unknown.
135
Assay was performed in duplicate at a final assay concentration of 10 µM. Two controls per
136
plate were used: Control 1, samples in absence of compounds (basal levels of ubiquitylated
137
proteins in the cell) and Control 2, samples in presence of proteasome inhibitor MG132 at a
138
concentration that produces complete proteasome inhibition (19). The AlphaLISA signal obtained
139
for each compound was normalized as percent stimulation compared to Control 1, corresponding
140
to 100% stimulation.Control 2 was not used to normalize the percent inhibition of each compound
141
because the levels of ubiquitylated protein accumulation could vary depending on the target
142
affected within the UPS. MG132 increased ubiquitylated protein levels in the cells approximately
143
1.8 times as compared to Control 1 (Figure 1A) (180% stimulation) and was used to control the
144
assay performance for each plate, that was in the range of previously reported data (17).
145
Patterns in plate responses were corrected using an in-house developed algorithm (20). The
146
percentage of stimulation found for the compounds followed a normal distribution in both
147
replicates (Figure 1B). Most compounds and Control 1 samples showed a percentage of
148
stimulation centered around 100% (inactive compounds). The right tail in pink correspond to the
149
actives hits of the assay. These compounds have a percentage of stimulation above the robust
150
cut-off in at least one of the replicates. Robust cut-off was estimated through a robust algorithm
151
(21) that considers the mean value of Control 1 plus three times its standard deviation. The
152
resulting cut-offs for both replicates were very similar (132% and 133% for replicates 1 and 2
153
respectively). Figure 1C shows the correlation of the percentage stimulation between both
154
replicates. In addition, a Pareto ranking was calculated with the two responses, to estimate a
155
round cut-off for this bivariate distribution. Compounds labeled in yellow are the ones rescued in
156
this way, giving a total hit rate of 6.8% of all compounds tested.
7 158
159
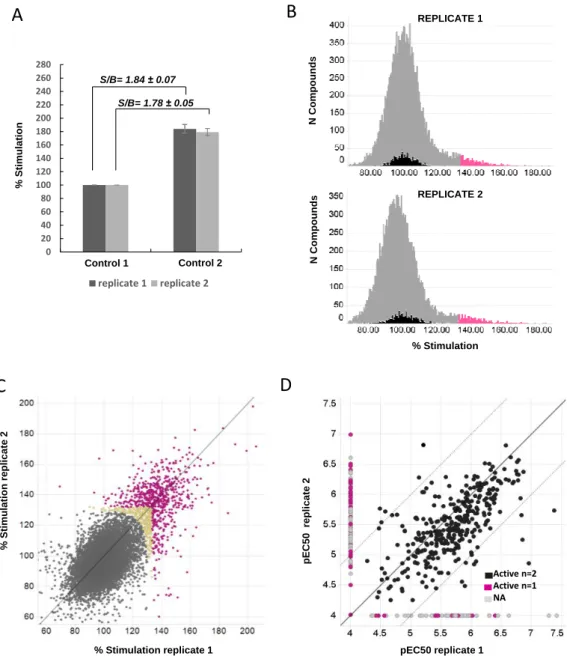
Figure 1. AlphaLISA screening campaign. Compounds were tested in the AlphaLISA assay
160
in duplicate at 10 µM. Two controls per plate were included and normalized as percent stimulation.
161
Control 1 corresponded to the signal obtained in absence of inhibition (basal levels of
162
ubiquitylated proteins corresponding to 100%), while Control 2 was the signal measured in wells
163
treated with the proteasome inhibitor MG132 (1.5 µM). A. Bars represent the average percent
164
stimulation for each control in the replicates. Average signal to background obtained per plate
165
(S/B=Average % stimulation control 2 wells / Average % stimulation control 1 wells) is given in
166
bold for each replicate. B. Number of wells for a given percent stimulation. All compounds tested
167
(14,747) plus control 1 wells are represented. Black color corresponds to control 1 wells, while
168
wells treated with compounds appear in grey. Compounds with percent stimulation above the
169
statistical cut-off for each replicate being considered active hits are depicted in pink. C. Correlation
170
of the percent stimulation obtained for each replicate. Inactive compounds are colored grey, and
171
active hits in at least one replicate are labeled in pink as in B. Yellow compounds were rescued
172
after calculating a Pareto round cut-off. The line indicates the perfect correlation (y=x). D. Active
173
hits were then assayed at dose response starting at 100 µM (1:3 dilutions) per duplicate. Graph
174
shows the correlation of the pEC50s obtained for each replicate. Compounds displaying a
175
maximum percent stimulation higher than 131% were considered active compounds. Actives in
176
two replicates (n=2) are represented in black, those active in one replicate and inactive in the
177
other one in pink (n=1), and actives in one replicate but whose curves could not be fitted
(non-178
adjusted NA) in the other replicate appear in grey. The black line is the perfect correlation (y=x),
179
while dotted lines represent ± 1 log difference of perfect correlation.
180 % Stimulation
B
N Com po un dsC
% Stimulation replicate 1 % Stim ul a tio n rep li c a te 2 0 20 40 60 80 100 120 140 160 180 200 220 240 260 280 replicate 1 replicate 2 Control 1 Control 2 S/B= 1.84 0.07 S/B= 1.78 0.05 % Stim ul a tio nA
N Com po un ds REPLICATE 2 REPLICATE 1D
pEC50 replicate 1 pEC5 0 re p li c a te 2 Active n=2 Active n=1 NA8 181
A total of 996 compounds were considered actives in at least one of the replicates. They
182
were progressed to dose response experiments to determine their potency. The quality of the
183
assay was assessed with different proteasome inhibitor being in the rage of previously reported
184
data (17) (Table 1). The minimum percentage of stimulation considered out of the noise of the
185
assay was 131%, because this corresponded to the statistical cut-off in both replicates.
186
Compounds displaying curves with a maximal asymptote above this percent stimulation in at least
187
one replicate were considered active compounds. Thus, 544 compounds met these criteria, giving
188
a confirmation rate of 54.6%.
189
Figure 1D depicts the correlation between pEC50s obtained per replicate. 438 compounds
190
were positive in both replicates, showing a pEC50 correlation within the range of pEC50replicateX -191
pEC50replicateZ<1, represented by grey dotted lines. The other 106 compounds were active in one 192
of the replicates, while in the other replicate they were inactive (pEC50<4, pink) or could not be
193
fitted with the analysis software due to variability (grey, non-adjusted, NA).
194 195
Hit confirmation with DELFIA assay
196 197
Hits from the AlphaLISA assay were further tested in the orthogonal DELFIA assay (17). This
198
heterogeneous assay was performed to confirm the effect of the hits on the UPS and to rule out
199
non-specific interference in the AlphaLISA assay as washes are performed between each
200
addition step.
201
Hits from the AlphaLISA assay (544 compounds) were tested at dose response per duplicate
202
(Figure 2). Assay behavior was similar to that of AlphaLISA in terms of signal to background and
203
cut-off. The results of the DELFIA assay showed a greater variability in replicates due to the
204
extensive washing steps but, at the same time, the stringent conditions allowed for robust
205
validation of the inhibitors found in the primary screening with the AlphaLISA assay.
206
Presence of the proteasome inhibitor MG132 led to increase ubiquitylated protein levels up
207
to 185%, (Figure 2A). Compounds with a maximum asymptote higher than 131% were active
208
(robust cut-off). Figure 2B shows the correlation of the pEC50s obtained between DELFIA
209
replicates. Only 106 hits were active in both replicates. Curves from many compounds could not
9
be fitted in one of the replicates due to assay variability or because they were close to the
211
response background (labeled as NA in Figure 2B).
212
213
Figure 2. Hit confirmation in DELFIA assay. Hits from the AlphaLISA campaign were tested
214
in the DELFIA assay in duplicate in dose response (first point 100 µM). Two controls were
215
included per plate and normalized as percent stimulation. Control 1 corresponds to the signal
216
obtained in the absence of inhibition (basal levels of ubiquitylated proteins corresponding to
217
100%), while Control 2 is the signal measured in wells treated with the proteasome inhibitor
218
MG132 (2 µM). A. Bars represent the average percent stimulation per replicate. Average of signal
219
to background obtained per plate (S/B=average % stimulation Control 2 wells/average %
220
stimulation Control 1 wells) is indicated in bold for each replicate. B. Correlation of the pEC50s
221
recorded for each replicate. Compounds displaying a maximum percent stimulation higher than
222
131% were actives. In black, actives in two replicates (n=2); in pink, actives in only one replicate
223
(n=1); and in grey, compounds active in one replicate but whose curves could not be fitted in the
224
other replicate (non-adjusted NA). C. Correlation of the average pEC50s recorded in the
225
AlphaLISA and DELFIA assays per compound. Compounds labeled in black were active in more
226
than three replicates (n=2 in AlphaLISA and/or DELFIA) and had a pEC50>4.5 in all replicates.
227
The black line indicates the perfect correlation (y=x), while dotted lines represent ± 1 log difference
228
of perfect correlation. D. Correlation of the average pEC50s recorded in the AlphaLISA and whole
229
cell assays per compound. Labels are the same than in C.
230
Figure 2
A
B
0 20 40 60 80 100 120 140 160 180 200 220 240 260 280 replicate 1 replicate 2 Control 1 Control 2 S/B= 1.92 0.26 S/B= 1.78 0.12C
Average pEC50 AlphaLISA
A v e ra g e p E C 5 0 D E L F IA pEC50 replicate 1 p E C 5 0 re p li c a te 2 DELFIA Active n=2 Active n=1 NA A v e ra g e p E C 5 0 A lp h a L IS A
Average pEC50 Whole cell - Active n≥3
Alphalisa/DELFIA - pEC50 >4.5
10 231
232
UPS activity assays Proteasome activity assays
Compound Structure Reported pEC50
whole cell 3D7A
pEC50 AlphaLISA
pEC50 DELFIA
pIC50 THP1 pIC50 P. falciparum
β5 β1 β2 β5 β1 β2
MG132
7.65 7.17 ± 0.04 7.41 ± 0.21 6.22 ± 0.01 5.25 ± 0.11 5.22 ± 0.11 6.86 ± 0.18 6.11 ± 0.02 6.72 ± 0.02
Bortezomib 7.05 7.95 ± 0.08 8.16 ± 0.05 7.29 ± 0.03 6.43 ± 0.20 5.56 ± 0.16 7.33 ± 0.26 <4* <4
* Some inhibition observed (~50% activity)
233
Table 1. Results for tool compound proteasome inhibitors in AMC assay for human THP1 and P. falciparum samples.
11 235
Figure 2C shows the correlation of the pEC50s found in the AlphaLISA and DELFIA assays.
236
311 compounds were confirmed in the DELFIA assay in one or both replicates, revealing a
237
confirmation rate of 57.1% with the AlphaLISA assay. Compounds active in more than two
238
replicates in total (more than two active replicates in either AlphaLISA or DELFIA), and with a
239
pEC50 higher than 4.5 (black) showed the best correlation, as they were the most reliable hits.
240
Comparison of UPS and whole cell assays (Figure 2D) indicate that compounds are less potent
241
in UPS assays, probably due to differences in the incubation times with the compounds, 1 hour
242
vs. 48 hours respectively.
243
The results of both assays were used to select compounds for further studies. Thus, the 311
244
compounds considered hits were tested in proteolytic activity assays of the proteasome which
245
clearly differentiated two groups: compounds whose target is the proteasome (26S) and
246
compounds that probably affect other UPS components upstream the proteasome (see graphical
247 abstract). 248 249 Proteasome inhibitors 250 251
Proteasome activity assays based on fluorescence readout were performed as described
252
(22). Compounds showing autofluorescence at 460 nm were also tested in the Proteasome-Glo
253
assay whose readout is luminescence. Proteasome-enriched fractions from P. falciparum extracts
254
were used as proteasome source as previously described (22). All compounds were tested at
255
single shot at 50 µM in the chymotrypsin-like, caspase-like, and trypsin-like proteasome activity
256
assays. Positive compounds were then subjected to dose response assays to assess their
257
potency, in duplicate. Sixteen compounds were active in at least one of the activities tested and
258
with an inhibition rate higher than 50%. Proteasome activity assays were also performed on
259
human proteasome-enriched fractions from THP1 cells to assess selectivity. Proteasome
260
inhibitors MG132 and bortezomib were included as controls in all experiments (Table 1). The
261
identification of proteasome inhibitors was expected and validated the screening rational.
262
Most of the proteasome inhibitors found were not selective for the P. falciparum proteasome,
263
which hampers further interest from a drug discovery point of view in malaria. However, results
12
showed that 6 compounds belonging to the same cluster with a cyanamide group were selective
265
for the P. falciparum proteasome. Three of them belong to the TCAM set: TCMDC-133787,
266
TCMDC-133806, and TCMDC-138496. All compounds inhibited the trypsin-like and caspase-like
267
proteasome activities in P. falciparum, but not the chymotrypsin-like activity, while they had no
268
effect on any human proteasome activities (Table 2). These compounds showed no cytotoxicity
269
in the HepG2 assay. The Property Forecast Index (PFI) was calculated as a predictor of
270
developability of compounds based on their physicochemical properties (23). Compounds with a
271
PFI<8 are considered that met the “drug-like” criteria. PFI of cyanamide cluster is less than 8
272
having a MW < 500, cLogP < 5, and a number of aromatic rings < 4.
273
A selection of analogs of these compounds were tested in the three proteasome activities of
274
the parasite to better understand their structure-activity relationship (SAR) (data not shown).
275
Compounds without the cyanamide group were inactive in the proteasome activity assays, which
276
strongly suggests that this group is an essential component of the pharmacophore. SAR results
277
also underlined the importance of other parts of the molecule, such as the sulfone group. The
278
least potent compounds in the proteasome, such as GSK´459, do not have this group (Table 2),
279
although in this case the decrease in potency is not reflected in whole cell activity. Activity
280
improved when the position of the heteroatoms or the chiral center were changed, as in compound
281
TCMDC-138496.
282
The subunit specificity of the proteasome inhibitors identified was assessed using the human
283
active-site probe Me4BodipyFL-Ahx3Leu3VS (Figure 3A). This probe covalently reacts with all
284
three β catalytic subunits in human proteasomes (24), but only with the trypsin-like (β2) and
285
chymotrypsin-like (β5) in P. falciparum (11). The β subunits not bound to the inhibitors are labeled
286
with the probe and then visualized by fluorescence. Treatment with our compounds caused the
287
disappearance of the band corresponding to trypsin-like activity in P. falciparum but not in human
288
fractions (Figure 3A). The human proteasome inhibitor bortezomib led to disappearance of all
289
bands in human fractions, but only of the chymotrypsin-like band in P. falciparum, in agreement
290
with the results reported in activity assays (Table 1). All bands in the human and parasite
291
proteasomes were lost after treatment with the non-specific inhibitor MG132 (Figure 3A and Table
292
1). These results confirmed the selectivity of our compounds against trypsin-like activity (β2) in P.
13
falciparum, previously shown in the proteasome activity assays. Caspase-like activity could not
294
be confirmed, as it is not labeled by the probe in the P. falciparum proteasome (11, 13).
295
296
Figure 3. Validation of proteasome inhibitors binding. A. Proteasome active-site probes.
297
The proteasome active-site probe Me4BodipyFL-Ahx3Leu3VS was used reacting with the
trypsin-298
like (β2) and chymotrypsin-like (β5) proteasome activities in P. falciparum and with the three β
299
catalytic subunits in THP1 in the absence of compounds. Proteasome-enriched fractions from P.
300
falciparum and THP1 cells were treated with compounds for 1 hour at 100 µM. The probe was
301
then added labelling the proteasome active sites not previously bound to the compounds.
302
B. Modelling of GSK’737 binding to P. falciparum and human proteasomes. Proposed
303
binding mode of compound GSK’737 to P. falciparum β2 unit (trypsin-like activity). The compound
304
is predicted to bind covalently to the catalytic threonine residue, and to establish hydrogen bonds
305
with the backbone of residues Thr-21 and Ala-49. C. Comparison of the binding modes in
306
human and P. falciparum P1 and P3 sub pockets are highlighted.
307 308
14
PhysChem properties Whole cell assays UPS activity assays Proteasome activity assays
Compound Structure cLogP MW Permea
bility PFI pEC50 3D7A pEC50 Cytotox HepG2 pEC50 AlphaLISA pEC50 DELFIA n
pIC50 THP1 pIC50 P. falciparum β5 β1 β2 β5 β1* β2 GSK´737 2.4 329.4 6.4 6 ± 0.2 4.2 ± 0.0 5.2 ± 0.2 5.2 ± 0.1 4 <4 <4 <4 <4 6.1 ± 0.2 6.3 ± 0.1 TCMDC-133787 2.1 334.2 349 5.1 6.3 ± 0.1 4.3 ± 0.0 5.7 ± 0.2 4.6 3 <4 <4 <4 <4 6 ± 0.1 6.2 ± 0.2 GSK´057 3.5 384.5 480 7.3 6.3 ± 0.1 4.4 ± 0.2 5.0 ± 0.3 4.8 ± 0.3 4 <4 <4 <4 <4 6.4 ± 0.2 6.3 ± 0.1 TCMDC-133806 1.2 329.2 370 4.9 5.8 ± 0.1 <4 5.2 ± 0.1 4.6 ± 0.1 4 <4 <4 <4 <4 6.9 ± 0.3 6.8 ± 0.2 GSK´459 1.3 275.3 4 6.1 ± 0.2 <4 4.9 4.9 ± 0.5 3 <4 <4 <4 <4 5.3 ± 0.0 5.3 ± 0.1 TCMDC-138496 3.2 279.4 5.3 6.2 ± 0.1 4.1 ± 0.2 4.7 ± 0.1 4.5 3 <4 <4 <4 <4 5.9 ± 0.2 6.4 ± 0.3 * No 100% inhibition (60%-80%) 309 Proteasome/Whole Cell Parasite Proteasome/Cytotoxicity
Human cLogP MW Permeability PFI
Green > 6 < 4 ≤ 3 ≤ 350 ≥ 100 ≤ 6
Yellow 5-6 4-5 3-5 350-450 10-100 6-9
Red < 4-5 > 5 ≥ 5 ≥ 450 ≤ 10 ≥ 9
Table 2. Summary of data for cyanamide proteasome inhibitors
15
To get some insight into the selectivity profile and mechanism of action of these compounds,
311
molecular modeling studies were performed exploiting the recently published structural
312
information about P. falciparum proteasome (12) and internal crystallographic complexes with
313
other cyanamides and different serine and cysteine proteases (25). According to this information,
314
these compounds could be acting as covalent ligands with the nitrile warhead. However, their
315
selectivity towards β1 and β2 activities appears to point to a specific recognition mechanism.
316
Based on this hypothesis, we modeled complexes of GSK’737 and TCMDC-133787 with the β1,
317
β2 and β5 units of the human and P. falciparum proteasomes using a covalent docking workflow
318
followed by manual refinement and energy minimization. In our proposed binding mode (Figure
319
3B), the compounds are attached to the catalytic threonine residue after a reaction with the cyano
320
group of the ligand, that is then interacting with the terminal amine group of the protein, similarly
321
to other available complexes for cysteine proteases (25), in which the nitrogen atom adopts a role
322
as a hydrogen bond acceptor. In our model, the P1 cavity would be partially occupied by the
323
pyrrolidine ring as a proline analogue. This might explain the negligible activity of these
324
compounds towards β5 for both species, due to a possible requirement for a small hydrophobic
325
residue (e.g. leucine) in that position for this catalytic unit (26). The different linkers (sulfonamide,
326
methyl sulfone or carbamate) would establish hydrogen bond interactions with the backbone
327
atoms of residues Ala-49 and Thr-21 (P. falciparum β2 unit numbering scheme) in a similar
328
manner to other known inhibitors such as WLW-vs derivatives (PDB ID 5FMG) (12) or bortezomib
329
(PDB ID 5LF3) (27). The geometry imposed by the threonine-warhead complex would explain the
330
different hydrogen bond patterns that the linkers could establish and, possibly, the potency drop
331
for GSK’459. Finally, all compounds have a bulky, hydrophobic group (i.e. naphthalene
332
derivatives, aryl halides, and 1,3 benzodioxol) that resembles, in different degrees, a tryptophan
333
residue and that would be located in the P3 sub pocket. Recently, it has been discovered that the
334
P3 sub pocket in P. falciparum β catalytic units, especially β2, is significantly larger than that in
335
their human homologues (Figure 3C), opening new opportunities to achieve selective inhibitors
336
by introducing bulky groups into that position (e.g. tryptophan in WLL-vs inhibitor (12, 28)).
337
According to our proposed binding mode, the presence of these groups in the reported
338
compounds could be an example of such strategy and one of the reasons for their selectivity
339
against the P. falciparum proteasome
16 341
342
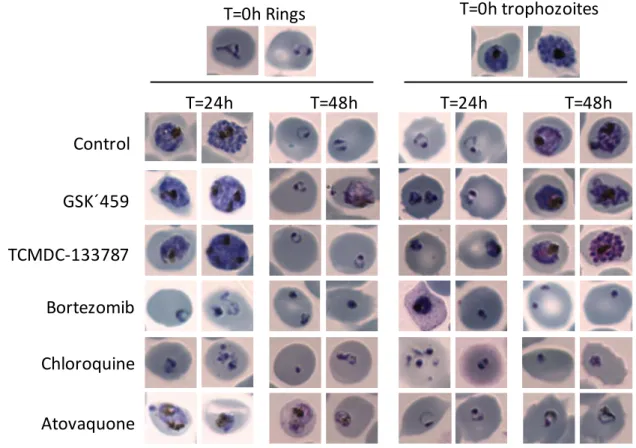
Figure 4. Effect of proteasome inhibitors identified on the intraerythrocytic parasite
343
stage. Synchronized iRBCs with rings or mature trophozoites/schizonts were treated for 24 and
344
48 hours with compounds. Photographs of Giemsa-stained thin blood smears were taken to
345
observe the phenotype and the effect on parasite in vitro growth. Chloroquine and atovaquone
346
were included as controls of fast- and slow-acting compounds respectively with modes of action
347
unrelated to UPS inhibition.
348 349
To determine the effect on parasite growth of this family of trypsin-like and caspase-like
350
proteasome inhibitors, iRBCs synchronized in rings or mature trophozoites/schizonts were treated
351
for 24 and 48 hours with the compounds TCMDC-133787 and GSK´459. Bortezomib, chloroquine
352
and atovaquone were used as controls (Figure 4). Bortezomib is a human proteasome inhibitor
353
that inhibits the chymotrypsin-like activity. Treatment of parasites with bortezomib resulted in
354
parasite growth arrest in a similar way to chloroquine either in rings or mature forms. However,
355
treatment with our trypsin-like and caspase-like proteasome inhibitors, TCMDC-133787 and
356
GSK´459 did not prevent progression to the next parasite stage (Figure 4). In humans, in
357
vitro and in vivo protein degradation is significantly reduced only when either the trypsin-like or
358
caspase-like sites are inhibited together with the chymotrypsin-like sites (29). The same may
359
occur in the parasite.It has been reported that the most significant parasite killing results from
co-360
inhibition of the chymotrypsin-like activity with the trypsin-like or caspase-like proteasome
361
T=0h Rings
T=24h
Control
T=48h
GSK´459
TCMDC-133787
Bortezomib
Chloroquine
Atovaquone
T=0h trophozoites
T=24h
T=48h
17
activities (12, 13). Co-inhibition allows for attenuating parasite growth at any point in the
362
intraerythrocytic cycle. Chymotrypsin-like activity is essential for fast inhibition of growth being
363
implicated in parasite schizogony, while inhibition of trypsin-like activity alone does not
364
significantly affect parasite growth as it has been confirmed with our cyanamides. Parasitemia
365
remained constant during the 48 hours tested, while in the control culture parasitemia increased
366
more than 6-fold. They seemed to have no effect on trophozoites or early schizonts, but prevented
367
increase in parasitemia, maybe because they affected merozoite egress, the invasion process,
368
or early ring stages. The fact that not all parasite stages are equally sensitive to inhibition of the
369
different proteolytic activities of the 20S core may suggest that each proteasome activity might be
370
regulating a specific pool of ubiquitylated proteins (29).
371
On the other hand, some proteasome inhibitors can also react with other serine or cysteine
372
proteases because the proteasome has a hydrolytic mechanism similar to those proteases (30).
373
In fact, although cyanamides were selective for P. falciparum proteasome, it has previously been
374
reported that they are inhibitors of different kinds of cathepsins, which are cysteine proteases. A
375
cyanamide-based inhibitor analogue to TCMDC-133787 was reported by our colleagues at GSK
376
as a novel human cathepsin C inhibitor for the treatment of neutrophil-dominated inflammatory
377
diseases such as chronic obstructive pulmonary disease and cystic fibrosis (25). Selectivity for
378
different cathepsins (cathepsins C, B, K, L, and S), all cysteine proteases, was achieved by
379
changing different parts of the molecules. In the case of cyanamides identified here, the selectivity
380
window in terms of cytotoxicity was higher than 100-fold in most cases. Further studies of the
381
action of these compounds on different human cathepsins should be done to assess a good
382
toxicological profile and to ensure the non-toxic effects in vivo.
383
As regards activity against other cysteine proteases of the parasite, it is known that P.
384
falciparum has different families of cysteine proteases such as falcipains, which have been
385
considered potential drug targets because they are involved in the hemoglobin degradation
386
process. Treatment of cultured P. falciparum parasites with broadly active cysteine protease
387
inhibitors such as leupeptin or E-64 causes the food vacuole to swell and fill with dark-staining
388
material (31)due to accumulation of large amounts of undegraded hemoglobin, with maximum
389
activity achieved in mature trophozoites and schizonts. Absence of a food vacuole defect in Figure
18
4 suggests that inhibition of cysteine proteases in this digestive organelle is not causing the
391
inhibition of parasite growth.
392
All these results suggest that compounds belonging to the cyanamide cluster are good
393
candidates to be administered in combination with other antimalarials such as artemisinin.
394
Selective inhibitors acting upon the parasite trypsin-like activity have previously been shown to
395
enhance killing by artemisinin of both sensitive and resistant parasites without host toxicity (12).
396
In contrast to previously reported selective proteasome inhibitors, cyanamides are small
397
molecules that are not peptide mimetics and have good PhysChem properties.
398 399
Non-proteasome inhibitors
400 401
In addition to proteasome inhibitors, our strategy has allowed the identification of compounds
402
that increased ubiquitylated protein levels through other mechanisms that could be directly
403
associated with parasite growth inhibition. This confirms published results showing that
404
accumulation of ubiquitylated proteins can lead to parasite death (32).
405
295 compounds were inactive in all proteasome activity assays, forming the group of
non-406
proteasome inhibitors (graphical abstract). Among them, 169 hits were active in the AlphaLISA
407
and DELFIA assays in at least three replicates and with a pEC50 higher than 4.5 (Figure 2C,
408
black dots). This restrictive selection criteria was applied to choose the best compounds of this
409
group. In a first stage, the structures were clustered using a complete linkage hierarchical
410
algorithm (21), which resulted in 64 chemical clusters, 36 of them singletons, with a wide variety
411
of chemotypes. Further inspection revealed that most of them, irrespective of the cluster,
412
contained a phenol group (such as phenol benzylamines), and/or were amino alcohols, including
413
quinine and amino-phenyl-ethanol derivatives. Six were the most populated (82 compounds in
414
total) clusters, with more than 3 members per cluster (Figure 5). The numbers of compounds
415
within each cluster ranged from 38 in cluster 1 as the most populated and 4 in cluster 6 as the
416
less populated. Clusters 1, 3 and 5 had with amino alcohols (pink dots). Most compounds in
417
cluster 1 had a hydroxy group in benzyl position. The substitution of the amine could be aliphatic
418
chains or aromatic rings.
19 420
Figure 5. Non-proteasome inhibitors. The six more populated clusters with their scaffolds
421
that share the compounds belonging to each cluster are presented. Graphs show the correlation
422
between the average pEC50 found in the UPS AlphaLISA assay and the pIC50 that inhibits
423
parasite in vitro growth (whole cell). The black line is the perfect correlation (y=x), the pink and
424
orange dotted lines represent the ±0.5 log and ±1 log difference of perfect correlation respectively.
425
Compounds in grey have a phenol group, those in pink an amino alcohol group, and those in
426
orange both kinds of groups in their structure. Dose response curves for one of the compounds
427
belonging to each cluster are shown as examples. Percent stimulations recorded in the AlphaLISA
428
(black) and DELFIA (pink) assays for a representative of the cluster are plotted versus compound
429
concentration.
430
pIC50 whole cell
p E C 5 0 A lp h a L IS A p E C 5 0 A lp h a L IS A
Cluster 1 Cluster 2 Cluster 3
Cluster 4 Cluster 5 Cluster 6
pIC50 whole cell
p E C 5 0 A lp h a L IS A p E C 5 0 A lp h a L IS A
Cluster 1 Cluster 2 Cluster 3
Cluster 4 Cluster 5 Cluster 6
Phenol Aminoalcohol Aminoalcohol + phenol
DELFIA AlphaLISA DR curves
20
Clusters 3 and 5 shared a quinine scaffold. Moreover, cluster 5 had a long chain and was
431
highly substituted in the right-hand side. The mechanism of action of quinine remains unclear, but
432
the drug has been attributed an inhibitory role of hemozoin biocrystallization like chloroquine.
433
However, some mutations have been found in the HECT E3 ligase PfUT (33) in quinine-resistant
434
parasites (34), connecting the resistance with the UPS. The lower correlation seen with the whole
435
cell assay here could point to an additional mechanism involving the UPS system of the parasite.
436
Clusters 2 and 4 contained compounds with the phenol group (Figure 5, grey dots). In
437
addition, cluster 2 included structures similar to described protease inhibitors with benzamides
438
substituted and an additional hydroxy group in para position, validating our approach. The
439
interplay of phenols with the UPS has previously been reported in human cells. Natural phenolic
440
compounds regulate the UPS during oxidative stress (35) and induce growth arrest or apoptosis
441
probably by regulating the UPS. For example, compounds such as methyl gallate, gallic acid, and
442
tannic acid increase ubiquitylated protein levels in treated human cells. They have an effect on
443
the E1 conjugating enzyme activity and the 26S proteasome through their OH group, and also
444
interact with other proteins such as protein S5a and DUBs USP47 and USP15 (36). The
445
correlation of the pIC50s obtained in the UPS and in the whole cell assays may suggest that
446
phenols present in the compounds could be affecting one or more components of the UPS.
447
Regarding the physicochemical profile, more than half the compounds showed a good PFI
448
index and had no historical annotations of liabilities found in GSK internal databases (redox,
449
promiscuity, reactivity, etc.), especially compounds belonging to clusters 1 (34/38), 3 (10/10), and
450
4 (7/9). All compounds had less than 4 aromatic rings and most of them had a MW < 500 and a
451
cLogP < 5. Regarding cytotoxicity, data in HepG2 showed that 77 of the 82 compounds were
non-452
cytotoxic.
453
Figure 5 shows the correlation between AlphaLISA and P. falciparum 3D7A whole-cell
454
assays pEC50s. The difference in pEC50 values was less than one for all of them, exhibiting
455
almost the same potency in both assays despite the fact that treatment with compounds lasted
456
only one hour. Phenols belonging to clusters 2 and 4 were near to perfect correlation, strongly
457
suggesting that parasite growth and UPS inhibitions are related. Amino alcohols present in
458
clusters 3 and 5 also showed a good correlation but, in all cases, compounds were more potent
459
in the whole cell assay, possibly indicating that there are other targets involved in their mode of
21
action or that more time is needed for compounds to exert their action. Some dose response
461
curves are presented in Figure 5 as an example of the results found for each cluster.
462
Little is known about components of the UPS in P. falciparum. Future identification of the
463
proteins targeted by these non-proteasome inhibitor compounds could reveal novel, validated,
464
tractable and selective targets which could be used in new drug discovery programs. Further
465
studies, like chemogenomic or proteomic methods (e.g. global shift thermal profiling) among
466
others, are required to identify which targets are being hit by the inhibitors found.
467 468
Conclusion
469 470
Results from the screening campaign shown here revealed compounds hitting different
471
targets within the UPS pathway. They represent excellent starting points for drug discovery
472
programs, particularly compounds belonging to the proteasome inhibitors, as the target they are
473
hitting has been identified. Moreover, non-proteasome inhibitors described could be used as tools
474
to identify new tractable antimalarial targets.
475 476
Materials and methods
477 478
P. falciparum cultures
479
P. falciparum 3D7A strain from the Malaria Research and Reference Reagent Resource
480
Center (MR4) was used to perform all assays reported. Parasites were grown in T150 flasks with
481
fresh red blood cells (RBCs) at hematocrit 1% (volume percentage of RBCs) as described in (31).
482 483
Preparation of assay plates
484
Compounds were dissolved in 100% DMSO. Final DMSO concentration in the assays was
485
1%. AlphaLISA assay plates (Greiner 1536-well white plates) were prepared with compounds by
486
adding 20 nL of each compound per well with an Echo dispenser, except for columns 11 and 12,
487
which were filled with 20 nL of DMSO, and columns 35 and 36, which were left empty. 200 nL of
488
each compound were added to 384-well flat bottom black plates for DELFIA assays, while 40 nL
489
were dispensed to 384-well low volume black plates for proteasome assays. Columns 6 and 18
22
were left empty. For single shot assays, final compound concentration in the assay was 10 µM in
491
AlphaLISA and 50 µM in the proteasome assays. For dose response determinations in any of the
492
assays described, the highest concentration was 100 μM, and 11 points diluted 1:3 in DMSO
493
were tested in all the assays performed by duplicate.
494 495
Purification of iRBCs with mature trophozoites/schizonts
496
Purified, highly synchronized P. falciparum-infected red blood cells (iRBCs) with mature forms
497
were required to perform the HTS campaign. The previously described protocol was used for this
498
purpose (37). As control of inhibition, part of the culture was treated with 1.5 µM of MG132
499
dissolved in DMSO. Culture was dispensed into AlphaLISA and DELFIA plates as described in
500
each section. All this experimental work was carried out under biosafety level 3 procedures.
501 502
TUBE-AlphaLISA and DELFIA assays
503
A Multidrop Combi liquid handler (Thermo Electron Corporation) was used for each reagent
504
addition to assay plates. The protocol was followed as described by Mata-Cantero et al (17).
505 506
Data analysis
507
Data were normalized to percentage of stimulation using the following equation:
508
% 𝑆𝑡𝑖𝑚𝑢𝑙𝑎𝑡𝑖𝑜𝑛(𝑥) = 𝑅𝑥
|𝑅𝐶𝑡𝑟𝑙1|∗ 100
509
Rx is the assay response measured for compound X, while RCtrl1 is calculated as the average 510
of control 1 (columns with 1% DMSO) in the same plate of compound X. Data and assay
511
performance statistics, such as signal to background ratio (S/B), robust standard deviation (SD),
512
and coefficient of variation (CV= (SD/average)*100) were calculated using ActivityBase XE
513
(IDBS) templates. Robust cut-offs at robust mean + 3*SD of Control 1 (estimated through a robust
514
algorithm) (38) were used to mark the hits. Before that, patterns present in the plates were
515
detected and removed using an in-house developed algorithm (20). pEC50 values
516
(pEC50 = -log10(EC50)) were obtained with ActivityBase XE non-linear regression bundle. Data 517
visualization and further analysis were performed using TIBCO Spotfire 3.2 software and
518
Microsoft Excel.
519 520
23
Selection criteria and data mining
521
For single shot experiments, hits had a response above the statistical cut-off (robust
522
mean + 3*SD response of Control 1) of each replicate.In AlphaLISA and DELFIA dose response
523
assays, compounds with a maximum asymptote higher than 131% were considered active
524
compounds (actives). This is based on the response and standard deviation obtained in the
525
experiments calculated as stated above. Compounds with pEC50 values lower than 4 (> 100 µM)
526
were considered inactive. GSK proprietary compound screening databases were queried for
527
historical data of the hits obtained. For proteasome activity assays described in a following
528
section, compounds showing a maximum percentage of inhibition higher than 50% in at least one
529
proteasome activity were considered actives.
530 531
Proteasome-enriched fractions
532
The protocol described by Kisselev et al (22) was adapted to obtain proteasome-enriched
533
fractions present in purified P. falciparum cells and THP1 crude extracts. Briefly, P. falciparum
534
cultures were synchronized with 5% sorbitol (w/v) and scaled up for five days. Culture was
535
harvested by centrifugation at 700 g for 5 minutes, and parasites were isolated by breaking RBCs
536
with 0.01% saponin (w/v) as previously described. At this point, parasite and THP1 cell were
537
equally processed. Cells were resuspended in sucrose buffer (50 mM Tris buffer pH 7.5, 5 mM
538
MgCl2, 1 mM EDTA, 50 mM NaCl, 250 mM sucrose, 2 mM ATP, 1 mM DTT) and lysed by nitrogen 539
cavitation for 15 minutes (110 bar of 1500 psi). Lysates were centrifuged at 20,000 g for
540
30 minutes at 4ºC, and supernatants containing soluble protein were subjected to an
541
ultracentrifugation step at 300,000 g for 2 hours at 4ºC. The resulting proteasome-containing
542
pellets were resuspended in sucrose buffer and left on ice for 30 minutes to complete
543
solubilization. Samples were centrifuged for 10 minutes at 20,000 g to remove insoluble material.
544
Proteins contained in supernatant, the proteasome-enriched fraction, were measured using the
545
Bradford method.
546 547
Proteasome activity assays
548
Proteasome activities were assayed with fluorogenic or luminescence peptide substrates
549
using previously described methods (22, 39) or the Proteasome-Glo assays (Promega)
24
respectively. In fluorescence assays, proteasome-enriched fractions from P. falciparum cells were
551
dissolved in sucrose buffer at 0.1 mg/mL to measure the three proteasome activities. THP1
552
proteasome-enriched fractions were adjusted to 0.1 mg/mL for the chymotrypsin-like activity and
553
to 0.2 mg/mL for the caspase-like and trypsin-like activities. 4 µL of proteasome-enriched fractions
554
at the required concentration were added to compounds and incubated for 1 hour (384-well, low
555
volume plates). Then, 4 µL of peptides 100 µM Suc-LLVY-AMC (Sigma), 200 µM
Z-Leu-Leu-Glu-556
AMC (Sigma) or 200 µM Ac-RLR-AMC (Boston) in assay buffer (50 mM Tris buffer pH 7.5, 5 mM
557
MgCl2, 1 mM EDTA, 50 mM NaCl, 1 mM DTT, 2 mM ATP, BSA 0.1 mg/ml) were added to the 558
plates to measure the chymotrypsin-like, caspase-like or trypsin-like proteasome activities
559
respectively. Proteasome inhibitors epoxomicin and MG132 at 10 µM were included as controls.
560
In the Proteasome-Glo assay, proteasome-enriched fractions were assayed in HEPES buffer
561
(10 mM HEPES, 1 mM DTT, 2 mM ATP, BSA 0.1 mg/ml) following manufacturer protocols.
562
Proteasome concentration for P. falciparum was kept at 0.1 mg/mL, while THP1 proteasome was
563
used at 0.05 mg/mL for chymotrypsin-like and trypsin-like activities, and at 0.1 mg/mL for
564
caspase-like activity. Volumes and order of addition were the same as in the fluorescence assay.
565
Fluorescence (λex/em = 380/460 nm) or luminescence were measured in the Envision plate reader 566
(Perkin Elmer). For dose response experiments, the first compound concentration tested was
567
100 µM diluting the compounds 1:3 in DSMO (final DMSO concentration, 1%).
568 569
Proteasome active-site probes
570
For all proteasome labeling experiments, the active-site probe Me4BodipyFL-Ahx3Leu3VS
571
(UbiQ) was used at a final concentration of 500 nM in sucrose buffer. THP1 (20 μg) or P.
572
falciparum (10 μg) proteasome-enriched fractions were incubated with compounds at 100 μM, or
573
DMSO as control, for 1 hour in sucrose buffer. The active-site probe was added to proteasome
574
enriched fractions previously treated with DMSO or compounds and incubated for 2 hours at RT.
575
Samples were then denatured by addition of Laemmli sample buffer, boiled for 10 minutes and
576
run on a 15% SDS-PAGE gel. Bands were visualized using the fluorescein channel in a Chemidoc
577
reader (Biorad) (λex/em = 480/530 nm). 578
579
Whole cell inhibition assay
25
The parasite growth inhibition assay was performed using the standard 3H-hypoxanthine 581
incorporation method. This assay relies on parasite incorporation of labeled hypoxanthine that is
582
proportional to P. falciparum growth (40).
583 584
Parasite inhibition phenotype
585
P. falciparum cultures were synchronized in schizonts by performing 70% Percoll gradient
586
centrifugation. Next day, culture in rings at 2% parasitemia and 2% hematocrit was treated with
587
compounds at 10 times their IC50s in the whole cell assay, 0.01 µM atovaquone, 0.25 µM
588
chloroquine, 1 µM bortezomib (Selleckchem), 5 µM TCMDC-133787, and 15 µM GSK’459, at a
589
final DMSO concentration of 0.5%. After 24 hours, parasitemia was quantified and photographs
590
were taken of Giemsa-stained thin blood smears. The same experiment was carried out treating
591
the parasites in mature trophozoites/schizonts.
592 593
HepG2 cytotoxicity assay
594
The acute cytotoxic effect of compounds administered to growing human liver-derived
595
HepG2 cells (ATCC HB-8065) was determined using the luminescence assay previously
596 described (41). 597 598 Molecular modeling 599
The structure of the three catalytic β1, β2, and β5 subunits of the P. falciparum proteasome
600
were obtained from the cryo-EM derived structure (PDB ID 5FMG) (12, 28), while human subunits
601
were obtained from the apo X-ray crystal (4R3O) (42). The Schrodinger 2017-3 suite was used
602
to pre-process protein structure, model the missing side chains, and assign optimal protonation
603
states. 3D models for the compounds were generated with Ligprep, followed by a conformational
604
analysis to generate low-energy states for input in the docking protocol. The covalent docking
605
module in Maestro was used to generate and score different poses with a covalent bond between
606
the cyano group and the oxygen in the Thr-1 side chain (nucleophilic addition to a triple bond).
607
The resulting poses for the 6 systems (β1, β2, and β5 for human and P. falciparum) were manually
608
analyzed and corrected based on information from internal crystal complexes with other cysteine
26
proteases, and the final complexes were energy-minimized to a final RMSD from the original
610 structure of 0.3 Å. 611 612 613 Acknowledgements 614
Human RBCs were supplied by the Blood Transfusion Center of CAM (Madrid, Spain) and Banc
615
de Sang i Teixits (Barcelona, Spain). Human biological samples were sourced ethically, and their
616
research use complied with the terms of the informed consent under an IRB/EC approved
617
protocol. We also thank Jim Brown for critically review of the manuscript. GSK has funded this
618 work. 619 620 References 621 622
1. WHO. 2018. World Malaria Report 2018. 623
2. Gamo FJ. 2014. Antimalarial drug resistance: new treatments options for Plasmodium. 624
Drug Discov Today Technol 11:81-88. 625
3. Ng CL, Fidock DA, Bogyo M. 2017. Protein Degradation Systems as Antimalarial 626
Therapeutic Targets. Trends Parasitol 33:731-743. 627
4. Aminake MN, Arndt HD, Pradel G. 2012. The proteasome of malaria parasites: A multi-628
stage drug target for chemotherapeutic intervention? Int J Parasitol Drugs Drug Resist 629
2:1-10. 630
5. Komander D. 2009. The emerging complexity of protein ubiquitination. Biochem Soc 631
Trans 37:937-953. 632
6. Bedford L, Paine S, Sheppard PW, Mayer RJ, Roelofs J. 2010. Assembly, structure, and 633
function of the 26S proteasome. Trends Cell Biol 20:391-401. 634
7. Schmidt M, Finley D. 2014. Regulation of proteasome activity in health and disease. 635
Biochim Biophys Acta 1843:13-25. 636
27 8. Xolalpa W, Perez-Galan P, Rodriguez MS, Roue G. 2013. Targeting the ubiquitin 637
proteasome system: beyond proteasome inhibition. Curr Pharm Des 19:4053-4093. 638
9. Mata-Cantero L, Lobato-Gil S, Aillet F, Rodriguez MS. 2015. The ubiquitin proteasome 639
system (UPS) as a cancer drug target: emerging mechanisms and therapeutics, p 225– 640
264. In Wondrak SL (ed), The ubiquitin proteasome system (UPS) as a cancer drug target: 641
emerging mechanisms and therapeutics doi:10.1007/ 978-94-017-9421-3-11 Springer 642
Science + Business Media. 643
10. Tschan S, Brouwer AJ, Werkhoven PR, Jonker AM, Wagner L, Knittel S, Aminake MN, 644
Pradel G, Joanny F, Liskamp RM, Mordmuller B. 2013. Broad-spectrum antimalarial 645
activity of peptido sulfonyl fluorides, a new class of proteasome inhibitors. Antimicrob 646
Agents Chemother 57:3576-3584. 647
11. Li H, Ponder EL, Verdoes M, Asbjornsdottir KH, Deu E, Edgington LE, Lee JT, Kirk CJ, 648
Demo SD, Williamson KC, Bogyo M. 2012. Validation of the proteasome as a therapeutic 649
target in Plasmodium using an epoxyketone inhibitor with parasite-specific toxicity. 650
Chem Biol 19:1535-1545. 651
12. Li H, O'Donoghue AJ, van der Linden WA, Xie SC, Yoo E, Foe IT, Tilley L, Craik CS, da 652
Fonseca PC, Bogyo M. 2016. Structure- and function-based design of Plasmodium-653
selective proteasome inhibitors. Nature 530:233-236. 654
13. Li H, van der Linden WA, Verdoes M, Florea BI, McAllister FE, Govindaswamy K, Elias 655
JE, Bhanot P, Overkleeft HS, Bogyo M. 2014. Assessing subunit dependency of the 656
Plasmodium proteasome using small molecule inhibitors and active site probes. ACS 657
Chem Biol 9:1869-1876. 658
14. Xie SC, Gillett DL, Spillman NJ, Tsu C, Luth MR, Ottilie S, Duffy S, Gould AE, Hales P, 659
Seager BA, Charron CL, Bruzzese F, Yang X, Zhao X, Huang SC, Hutton CA, Burrows JN, 660
Winzeler EA, Avery VM, Dick LR, Tilley L. 2018. Target Validation and Identification of 661