An analysis of costs and margins in the value
chain of Fair Trade coffee - Is Fair Trade fair to
the consumer?
Bachelor Project submitted for the degree of
Bachelor of Science HES in International Business Management
by
Adrien NAEF
Bachelor Project Mentor:
Robert PILLER, Senior Lecturer
Geneva, 03.06.2020
Haute école de gestion de Genève (HEG-GE) International Business Management
Disclaimer
This report is submitted as part of the final examination requirements of the Haute école de gestion de Genève, for the Bachelor of Science HES-SO in International Business Management. The use of any conclusions or recommendations made in or based upon this report, with no prejudice to their value, engages the responsibility neither of the author, nor the author’s mentor, nor the jury members nor the HEG or any of its employees.
Acknowledgements
I would like to express my gratitude to the following three people, without whom this paper could not have been written.
➢ Mr. Robert PILLER, for making me discover and instilling in me a passion for commodity trading thanks to the commodity trading major, but also for his advice and guidance throughout the past few months that lead to this paper.
➢ Mr. Jonathan GARCIA, for taking the time of sharing with me in-depth and without withholding information his knowledge of coffee and its value chain. As you will notice reading this paper, his interview is an integral part of my research and I am very thankful for his time and availability.
➢ Mr. Sébastien REBER, for sharing with me some insights into the role of coffee roasters in the value chain of coffee.
Executive Summary
In this Bachelor Thesis, we research the role of the different actors of the value chain of coffee and their share of the value of the coffee that is finally sold to end-consumers. We then analyse and compare the various costs and margins incurred by Fair Trade and regular coffee.
The aim of this research is to better understand how value is allocated in the final retail price of coffee sold in Swiss supermarkets, find out how much coffee farmers were paid for the coffee contained in a particular pack of coffee and most importantly if we notice differences between the allocation of value in Fair Trade and regular coffee. Is the premium paid by consumers for Fair Trade coffee entirely going in the pockets of coffee producers or do some other actors of the value chain capture some of that premium? To achieve this goal, we created a model to compute the various costs and margins in the value chain of coffee. This model was built around the study of financial statements of the various actors involved, the academic literature published on the subject, the publications of large organisations related to coffee trading, and the interview of a junior coffee trader.
Our research found that in one case, the margins applied to Fair Trade coffee increased by 24.03% compared to a comparable regular coffee, while in a second case, the margins decreased by 10.38%. Our results also highlight some of the most well-known realities of the coffee value chain such as the amount of value that remains in coffee-producing countries versus the amount of value that is captured in consuming countries. Finally, our results show an increase in gross household income of 1.06 USD/lb. for Fair Trade coffee growers which equates to an increase in net profit in a range of 0.078 USD/lb. to 0.254 USD/lb.
Contents
An analysis of costs and margins in the value chain of Fair Trade coffee - Is Fair
Trade fair to the consumer? ... 1
Disclaimer ... i
Acknowledgements ... ii
Executive Summary ... iii
Contents... iv
List of Tables ... vi
List of Figures ... vi
List of Abbreviations ... vii
Disambiguation ... vii
1. Introduction ... 1
1.1 A brief introduction to Fair Trade ... 2
2. Literature review ... 3 3. Methodology ... 7 3.1 Data gathering ... 7 3.1.1 Coop ... 9 3.1.2 Migros ... 9 3.1.3 First observations ... 11 3.2 The model ... 12
3.2.1 Assumptions and limitations ... 13
3.2.2 Retail price ... 15 3.2.3 VAT... 15 3.2.4 Retailer’s margin ... 16 3.2.5 Retailer’s costs ... 17 3.2.6 Roaster’s margin ... 17 3.2.7 Roaster’s costs ... 17 3.2.8 Trader’s margin ... 18
3.2.9 Freight and insurance costs ... 18
3.2.10 Equilibrium price ... 19 4. Results ... 21 4.1 Retailer’s margin ... 21 4.2 Retailer’s costs ... 22 4.3 Roaster’s margin ... 23 4.4 Roaster’s costs ... 24 4.5 Trader’s margin ... 26
4.6 Freight and Insurance costs ... 27
4.7 The Model ... 29
5. Discussion ... 31
5.1 Analysis of the results - margins of the pairs ... 31
5.2 Migros vertical integration’s impact on the model ... 33
5.4 Comparison with the literature review ... 37
5.5 The validity of the model ... 39
5.6 Recommendations ... 40
6. Conclusion ... 41
Bibliography ... 42
List of Tables
Table 1 Coffees selected at Coop ... 9
Table 2 Coffees selected at Migros ... 11
Table 3 Migros & Coop Margins ... 21
Table 4 Coop’s revisited P&L ... 22
Table 5 Roaster’s margins ... 24
Table 6 Traders’ Margins ... 26
Table 7 The Model ... 30
Table 8 The Model revisited for Migros ... 33
List of Figures
Figure 1 Discounters’ boom at the expense of large distributors ... 8Figure 2 Migros Bio Max Havelaar packaging ... 10
Figure 3 La Semeuse Mocca Surfin origins ... 14
Figure 4 Migros Income and Profit 2015-2019 ... 16
Figure 5 Coop Net sales and Operating result 2015-2019 ... 17
Figure 6 - 2019 Coffee C Futures closing price from contract closest to expiry ... 20
Figure 7 Economics of the Coffee Supply Chain 2019 ... 25
Figure 8 Direct Coffee, what the farmer gets ... 26
Figure 9 FBX Index 2019 ... 27
Figure 10 FBX24 Index June-December 2019 ... 28
Figure 11 World Container Index December 2017 to December 2019 ... 28
Figure 12 Allocation of the retail value of coffee in the value chain (Aggregate) ... 35
Figure 13 Allocation of the retail value of coffee in the value chain (FT/Regular) .. 36
List of Abbreviations
CHF Swiss Francs
EBIT Earnings before Interests and Taxes
EBITDA Earnings before Interests, Taxes Depreciation, and Amortization FBX Freightos Baltic Index
FEU Forty-foot Equivalent Unit
FLO Fairtrade Labelling Organizations International ICE Intercontinental Exchange
ITC International Trade Centre
lb. Pound
P&L Profit and loss statement SCA Specialty Coffee Association
UNCTAD United Nations Conference on Trade and Development
VAT Value Added Tax
Disambiguation
In the following paper, the terms “Fair Trade” and “Fairtrade” are used interchangeably a large number of times. Unless specified otherwise, both refer to products labelled by The Fairtrade Labelling Organizations International (FLO), better known in Switzerland by the name of Max Havelaar.
1. Introduction
In the past decade, more and more people have become aware of the impact of their consumption habits and are trying to become more socially responsible. To respond to this trend and those concerns, companies of all industries have started taking actions and changing their ways of operating to become more socially responsible themselves. One of these actions is fair trade. While not a new concept, it is a complex one, and production and sales of fair trade coffee have been steadily growing for the past decade (Naegele 2019; Raynolds 2009). However, despite the emerging trends, increased interest of the general public, and increased scrutiny, the value chain of coffees remains opaque. Figures are hard to come by and transparency has not yet reached a point at which consumers can easily access information such as the price paid to the producer of the coffee they are buying, let alone who planted, grew, and harvested the green coffee beans.
A simple reflection that can come out this new trend is what advantages would retailers and roasters have, to go through the more costly and more complicated process of buying and selling Fair Trade Coffee over regular coffee. Is the unique benefit of complying with corporate social responsibility enough to warrant those additional efforts and expenses or do they have an ulterior motive. How can we explain that companies such as Starbuck or Nestlé, two of the world’s largest coffee roasters, that produce rather simple products compared to companies such as Samsung or Apple, apply similar operating margins? Indeed, Nestlé’s and Starbucks’ operating margin in the last five years averaged between 20% and 22%, while Samsung’s operating margin in 2018 was around 24% (Starbucks Corporation 2019; Nestlé 2020; Samsung Electronics Co. 2019)?
A fair assumption of consumer’s intent when purchasing Fair Trade coffee is that the premium they pay actually goes to farmers, who need this additional premium to make a profit cultivating coffee and not produce at a loss, to live decently and continue to produce coffee and not to further enrich large multinationals.
However, a cynical approach to this issue would lead to believing that some actors of the coffee value chain are making an extra profit selling Fair Trade coffee while at the same time banking on the trend of more responsible purchases.
This paper aims at studying this observation and to build a model of cost allocation of the final retail price of coffee to find out how much of the price paid by consumers goes
to each actor of the value chain. Then by comparing the results obtained from this model from comparable Fair Trade and non-Fair Trade coffee, to answer the following research question: do coffee traders, roasters, or retailers make an extra relative profit selling Fair Trade coffee?
1.1 A brief introduction to Fair Trade
This paper’s main theme is Fair Trade coffee; therefore, it makes sense to briefly introduce the topic of Fair Trade to better understand what comes next. The Fairtrade Labelling Organizations International is a non-profit association composed of national member organizations founded in 1997 and headquartered in Bonn Germany. The Swiss national antenna of the association is the Max Havelaar Foundation (Fairtrade International 2020).
Amongst its activities, FLO certifies various goods with their label to guarantee that they were produced in accordance with the organization’s standards. There is a set of base standards applicable to all certifiable goods and then particular standards for each good. The main four standards are the social development, economic development, and environmental development of producers as well as the prohibition of forced labour and child labour. The economic development revolves around the payment of a minimum price to the producer, this price is either the market price or the Fairtrade minimum price set by FLO. On top of this price guarantee, comes a Fairtrade premium which is paid to the farmer’s cooperative and that must finance projects benefiting the community. Additional premiums can apply such as an organic premium and those are added to the total purchase price. FLO updates regularly those prices and premiums to keep up with the evolution of the market (Fairtrade International 2020; 2020).
To obtain the right to apply the FLO label to a specific good, producers, traders, and companies must be certified by FLOCERT, the certification body of the FLO. For producers, this certification is obtained after an initial on-site audit and a confirmation audit. The certification is valid for three years after which a renewal audit is conducted. Other than those three audits, FLOCERT also regularly conducts unannounced audits. Traders are also audited by FLOCERT, who checks regularly that all Fairtrade transactions were concluded according to FLO’s regulation (Fairtrade International 2020).
Therefore, when consumers purchase a product sporting FLO’s label, they have the guarantee that the goods they are purchasing were produced with the economic, social, and environmental development of producers in mind.
2. Literature review
In order to get a better understanding of the current literature available on the subject of Fair Trade coffee, the value chain of coffee, and how profit is split along this value chain. As well as in order to set the foundations to write this paper, around 20 publications of both academics as well as non-governmental organisations were reviewed and a selection of 10 publications will be reviewed hereafter. This selection was made based on the relevance of the publications to the present paper as well as to avoid repetition as many publications refer to one another.
When it comes to the value chain of coffee, there are slight variations on how the various reviewed publications describe every process taking place from the planting to the final sale, who are all the actors composing this value chain and what part of the value chain occurs in the producing country or consuming country. Indeed, Slob, Murphy et al. and the International Trade Centre base their respective analysis on a simplified value chain. Namely, a producer whose role is to plant, cultivate and harvest the coffee beans but also to either put it through dry or wet processing, a trader, whose role is to match the supply of producing countries with the demand of consuming countries and insuring the transportation of the coffee from producer to the roaster, a roaster whose role is to roast the green coffee beans and to package the roasted coffee and retailers who then sell the roasted coffee to the end-consumer (Slob 2006; Murphy, Dowding 2017; International Trade Centre 2011).
On the other hand, UNCTAD and Byrnes et al. provide a more detailed and complete value chain in their respective publications. Indeed, in addition to the different actors previously mentioned, UNCTAD adds local traders, dry milling facilities, and domestic roasting/manufacturing facilities on the producing country’s side of the value chain and adds importers, brokers, and warehousemen to the consuming country’s side of the value chain. Byrnes et al. also add domestic traders, exporters, and cooperative/farmer groups to the producing country’s side and brokers to the consuming country’s side (UNCTAD 2019; Byrnes, Khodakarami, Perez 2016).
However, despite those slight changes, a consensus is emerging from these publications, namely that the four actors of the simplified value chain are the largest and most important and, in some cases, play the role of some of the smaller actors described by UNCTAD or Byrnes et al.
When it comes to the allocation of the value of retail coffee between the various actors of the value chain, three publications were selected. Those three publications provide
very different results. In the most recent one, Naegele conducted a statistical analysis of Fair Trade coffee sold in US supermarkets to analyse how much of the price of Fair Trade coffee sold in supermarkets is attributable to Fair Trade and how this premium is then shared along the chain. In her study, she finds that around a 1 USD/lb. premium is paid by the consumer of Fair Trade coffee. She finds that about 20% of the premium is passed on to the producer/farmer and that roasters take the lion’s share of profit while retailers seem to make a smaller profit on Fair Trade coffee than they do on regular coffee (Naegele 2019).
In their special issue on coffee, UNCTAD created a model of the value distribution of Ethiopian specialty coffee based on figures of the European Coffee Federation. Their model shows that around 5% of the retail value of coffee is retained in the producing country, while retailers take away around half of the value. What is surprising in this study however is how the different actors selected for the value allocation vary from the ones identified in the value chain portion of the same publication. For instance, no trader is mentioned in the model. Based on this model, UNCTAD raises the issue of the poor value allocation of the final retail price in the producing country and how this reality already has and will continue to have an impact on the sustainability of coffee production (UNCTAD 2019).
In their publication, Byrnes at al. mention another study led in 1997 by Talbot on the subject of the income allocation in the coffee value chain. Talbot’s study is based on coffee sold in the US in the period 1971-1995. While more than 20 years old, this study remains interesting and yields results not so disparate with Naegele’s and UNCTAD’s studies. According to Talbot’s results, 20% of the income generated by the sale of coffee as a finished product goes to the producer, 30% to the roasters, 15% to the retailers, and the rest is split between smaller actors, costs, and taxes (Talbot 1997; Byrnes, Khodakarami, Perez 2016).
While there does not seem to be a consensus on the exact allocation of the value between the different actors, there seems to be a consensus on who shares most of the value, namely roasters and retailers, and how little of the value actually goes to the producing country.
When it comes to the impact and benefits of Fair Trade in coffee, three studies were selected to be reviewed in this paper. The first one, commissioned by Fairtrade International and published by the University of Greenwich, assessed the impact of the FLO certification of coffee farmers and farmers organisations in Peru, Mexico, Tanzania, and Indonesia. The study is based on both qualitative and quantitative survey filled by
Fair Trade farmers in the selected countries. Based on the answers to this survey, they rated various key performance indicators of Fair Trade separated into four categories. First, indicators related to the direct intervention of FLO, second, indicators linked to the implementation of Fair Trade, third, indicators linked to producer organisations (i.e. cooperatives), finally, the direct impact of Fair Trade on farmers. Amongst other findings, the authors concluded that Fair Trade has a positive impact on the household income of farmers in the order of 16% to 107% depending on the country. There was however an exception with Indonesia were non-Fair Trade farmers had a better household income due to higher productivity linked with using chemicals. They also found that despite having a higher income, Fair Trade farmers were more likely to feel worse off due to the feeling of having become dependent on coffee farming. The study also showed that Fair Trade provided farmers with increased exposure and reputation and therefore better access to various markets and alternative sources of funding. Overall, the results of the study were positive, but a few areas remained to be improved notably indicators linked to producer organisations (Nelson, Haggar, Martin, Donovan, Borasino, Hasyim, Mhando, Senga, Guadarrama, Kendar, Valdez, Morales 2016).
Those results are to be somewhat mitigated by Weber’s findings in his study. In his study, based on a sample of southern Mexico coffee growers, Weber concluded that although there was indeed a positive increase in the household gross income of Fair Trade coffee growers compared to non-Fair Trade coffee growers, this increase was only in the order of 5% corresponding to the average 0.128 USD/lb. premium the farmers received. The study did not take into account the costs associated with becoming FLO certified which would reduce that income increase further. The author concludes that indeed Fair Trade increases the household income of the grower but, that alone, this increase is not enough to transform their condition (Weber 2011).
The final study reviewed explored the direct and indirect benefits of Fair Trade and free-market channels on the income of producers in the Oromia region of Ethiopia and the Kilimanjaro region of Tanzania. The study is based on interviews and discussions with various stakeholders in those regions. Much like Weber, Coles found in his study that while producers were benefitting from a higher gross margin this would not necessarily translate to higher profits due to increased costs, lower yields, and other issues incurred by the producers at the time of the survey. When it came to the investment of the premium by the cooperatives, the study shows that of the various cooperatives surveyed, only a few were able to earn that premium in the past few years as they didn’t reach the minimum volume required to be eligible to receive the premium. This was caused amongst other things by the high indebtedness level of those cooperatives that were
therefore not able to purchase enough coffee to then resell it and earn the premium (Coles 2011).
To summarize the current state of the literature, while there might be some slight variations, notably in the importance given to certain actors of the coffee value chain, there is a general consensus on how the simplified value chain should be depicted. The value chain starts with a producer, who then sells to an international trader, which in turn resell and ship the green coffee to a roaster. The roaster then roasts the green coffee beans, packages them, and sell them to retailers, which themselves realise the final sale to the end-consumer.
There is no consensus when it comes to how much of the retail value of coffee is attributable to each actor of the value chain. However, certain common trends are emerging, such as the low percentage going to the producers, and the large importance of the roasters in the final value. Where it mostly differs is the exact value for each actor and particularly for the retailers and producers.
Finally, there is a general consensus that Fair Trade coffee is beneficial to coffee growers, notably in terms of increased household income but not only. Findings show that Fair Trade producers also seem to benefit from better exposure and access to the market than their non-Fair Trade counterparts. There seems to be a consensus when it comes to the important role that farmer cooperatives play in the production of coffee, and the large potential of improvement in that area. Where the various studies seem to differ is to the actual net financial benefits of Fair Trade for coffee growers. Some studies tend to show that while there is indeed a benefit, it might not be as high as expected and high enough to drastically improve farmer's economic situation.
3. Methodology
To answer our research question, a model of costs and margins allocation was designed. This model allows, by plugging the retail price of a pack of roasted coffee beans, to break down the various costs supported by the different actors of the value chain of coffee, as well as their margins. This, in turn, allows to find out the price that was paid to the coffee producer. Based on those prices paid to the producer, it can then be analysed whether the margins of retailers, roasters, and traders are the same for comparable products, labelled Fair Trade or not. The various parameters of the model were established as detailed below thanks to a combination of research of financial reports, the interview of Jonathan Garcia, a Junior Coffee Trader and middle officer at Cargill and Touton, the comparison with existing models mentioned in the literature review and some assumptions detailed hereafter.
3.1 Data gathering
The first step of building the model was to gather a sample of coffees sold in Switzerland, more precisely in Geneva, that would be plugged into the model. Based on the coffee value chain, the first step was to choose whether coffee sold for in-home consumption or out-of-home consumption would be used. The former is the coffee sold by retailers such as supermarkets or specialty shops, while the latter is the coffee sold by restaurants, bars, and coffee shops.
First, supermarkets’ sales of coffee represent between 70% and 80% of the market, while the remainder is shared between the other players (UNCTAD 2019). Second,
out-of-home consumption coffee sold in restaurants, bars, and coffee shops is not merely coffee
anymore, but a transformed product. The coffee is served with sugar and cream. It can be served in a single-use cup with napkins and stirrers. All those additional costs must be removed from the equation and that would prove to be hard to do. Furthermore, the price of a cup of coffee in a restaurant, bar, or coffee shop depends on a lot of factors other than the price of coffee as raw material, such as the location of the establishment or its standing. Moreover, out-of-home coffee is a very fragmented market as most players are individual establishments and not franchises or chains. In 2015 in the canton of Geneva alone, there were more than 2000 food service establishments (Office Cantonal de la Statistique 2017), which renders the task of finding comparable products extremely hard. Finally, as each of those establishments has very different pricing strategies and sell different brands of coffee, again, to find comparable products is
tenuous. For those reasons, the model is based on coffee sold at retailers for in-home consumption.
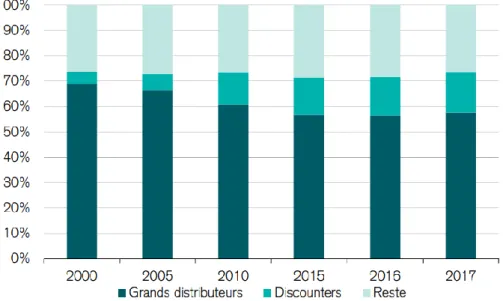
When it comes to the retailers, to have a basis comparable for coffee sold in Switzerland, nation-wide retailers were chosen. In 2017, Coop and Migros shared slightly less than 60% of the food retail market in Switzerland, while discounters such as Denner, Aldi or Lidl shared less than 20% and the rest is divided between smaller retailers (Crédit Suisse AG, Fuhrer & Hotz 2019).
Figure 1 - Discounters’ boom at the expense of large distributors
Source: (Crédit Suisse AG, Fuhrer & Hotz 2019)
Because Migros and Coop share such a significant portion of the food retail market, data was gathered from those two retailers.
The data was gathered on five occasions1 (the first collection for Coop and Migros was 5 days apart, but the following 3 were made the same day for both retailers) at the same two Migros and Coop retailers2.
The following information was recorded:
• Name of the product
• Brand
1 January 7th 2020, January 13th 2020, February 10th 2020, March 10th & April 2nd 2020
• Roaster
• Type of bean (Arabica, Robusta, or blend)
• FLO Label (yes or no)
• Bio Label (yes or no)
• Type of coffee (beans, instant or capsules)
• Volume in gram
• Price in CHF3
3.1.1 Coop
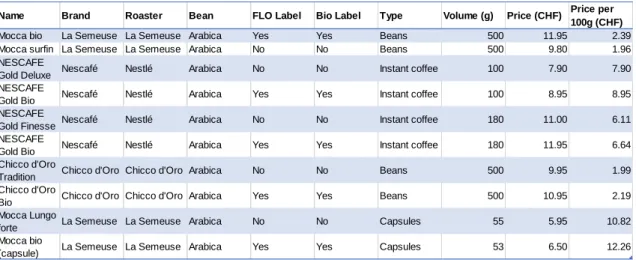
On the first collection, amongst the various coffees on offer at Coop, five pairs of comparable products were selected, one with an FLO label and one without it. Those pairs are products of the same brand, same type of bean, same type of coffee, and the same volume. The selection in pairs was made in order to have the fairest comparison possible between Fair Trade and non-Fair Trade coffee.
The pairs are the following:
Table 1 - Coffees selected at Coop
Source: Author’s data collection
3.1.2 Migros
Migros’ business model is such that the Migros group is divided into 5 business units. Two of which are Cooperative Retailing and Industry & Wholesaling. The Cooperative
Retailing unit operates the supermarkets and the specialist markets (i.e. SportXX,
Melectronics, etc.). The Industry & Wholesaling unit is composed of many companies that manufacture own-brand goods that are then sold by the Cooperative Retailing unit
3 Special discounts and offers were disregarded
Name Brand Roaster Bean FLO Label Bio Label Type Volume (g) Price (CHF) Price per 100g (CHF)
Mocca bio La Semeuse La Semeuse Arabica Yes Yes Beans 500 11.95 2.39 Mocca surfin La Semeuse La Semeuse Arabica No No Beans 500 9.80 1.96 NESCAFE
Gold Deluxe Nescafé Nestlé Arabica No No Instant coffee 100 7.90 7.90 NESCAFE
Gold Bio Nescafé Nestlé Arabica Yes Yes Instant coffee 100 8.95 8.95 NESCAFE
Gold Finesse Nescafé Nestlé Arabica No No Instant coffee 180 11.00 6.11 NESCAFE
Gold Bio Nescafé Nestlé Arabica Yes Yes Instant coffee 180 11.95 6.64 Chicco d'Oro
Tradition Chicco d'Oro Chicco d'Oro Arabica No No Beans 500 9.95 1.99 Chicco d'Oro
Bio Chicco d'Oro Chicco d'Oro Arabica Yes Yes Beans 500 10.95 2.19 Mocca Lungo
forte La Semeuse La Semeuse Arabica No No Capsules 55 5.95 10.82 Mocca bio
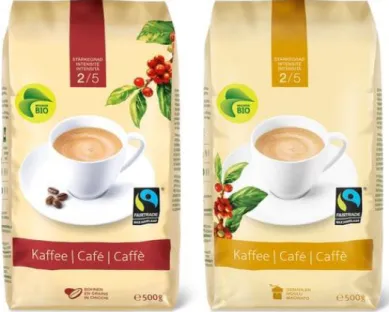
(Migros Group 2019). This means that goods sold at Migros, exception made for very rare products, are manufactured by companies owned by Migros. Coffee is no exception and most if not all coffees sold at Migros are produced by Delica AG, a 100% Migros owned company (Migros Group 2019). Delica AG is responsible for the procurement, the roasting, and the processing of coffee (Delica 2020). It is one of the largest swiss roasters, processing 16’500 metric tons of green coffee per year (Delica 2020), roughly a quarter of the 65’500 metric tons of coffee processed in Switzerland (Procafé 2020). Delica delivers its coffee to Migros under different brands (for instance Delizio and Café Royal), each targeting a different consumer base. None of those brands offer an FLO labelled alternative. Instead, the FLO labelled coffee available at Migros, although being produced by Delica, is sold in non-branded packaging such as presented in Figure 2.
Figure 2 - Migros Bio Max Havelaar packaging
Source: www.produit.migros.ch
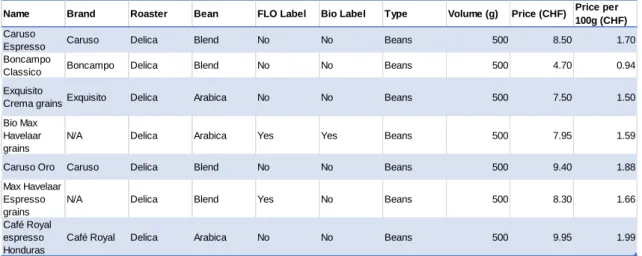
For these reasons, it was not possible to create pairs of FLO labelled and non-labelled coffee, as it was done at Coop. Furthermore, as the first collection at Migros was made a few days later than at Coop, the third observation described below had already been made. Therefore, only coffees in beans were selected at Migros. Moreover, as it was not possible to create pairs, the data collected at Migros will not be used in the comparison between FLO labelled and regular coffee but used as a control for the model.
Finally, as the selection of coffees in grain at the selected Migros physical store was thin, the selection was completed with coffees found on their online platform4. The prices
online are the same prices as in the shops and none of the products listed online are exclusive to the online platform.
The selected coffees are the following:
Table 2 - Coffees selected at Migros
Source: Author’s data collection
3.1.3 First observations
From this raw data, four important observations can be made. First, there is a strong correlation between the FLO label and the Bio label. Indeed, at Coop, every FLO labelled product is also labelled Bio, while none of the regular coffees sport a Bio label. At Migros, one of the two FLO labelled coffee also sports a Bio label. However, this correlation is to be mitigated by the report of Jonathan Garcia that about only one third to half of the FLO labelled coffee he would trade was also Bio. Nonetheless, this is an interesting demonstration of the trend described in the introduction.
Second, in the three months between the first and final collection, not a single variation in the price of the selected products was observed. It is interesting to see that despite the extremely high volatility of the coffee market price, these variations at the beginning of the value chain do not seem to affect the final retail price. A further observation is that the final collection was done during the confinement period ordered by the Swiss Federal Council to slow down the propagation of COVID-19 and the turmoil created in the markets by those measures and the general situation caused by the pandemic, both in Switzerland and in the rest of the world, didn’t affect the retail prices at this point in time. For those reasons, the prices are only mentioned once in Table 1 and Table 2 although they were collected on four different occasions.
Name Brand Roaster Bean FLO Label Bio Label Type Volume (g) Price (CHF) Price per 100g (CHF)
Caruso
Espresso Caruso Delica Blend No No Beans 500 8.50 1.70 Boncampo
Classico Boncampo Delica Blend No No Beans 500 4.70 0.94 Exquisito
Crema grainsExquisito Delica Arabica No No Beans 500 7.50 1.50 Bio Max
Havelaar grains
N/A Delica Arabica Yes Yes Beans 500 7.95 1.59
Caruso Oro Caruso Delica Blend No No Beans 500 9.40 1.88 Max Havelaar
Espresso grains
N/A Delica Blend Yes No Beans 500 8.30 1.66
Café Royal espresso Honduras
Third, there is a tremendous difference in price per 100g between the different types of coffee. Indeed, beans are in a 0.94 CHF/100g to 2.39 CHF/100g range, instant coffees are in a 6.11 CHF/100g to 8.95 CHF/100g range and capsules in a 10.82 CHF/100g to 12.26 CHF/g. While not surprising, this observation is to take into account for the model. Indeed, instant coffees and capsules, as they are both grounded and the latter is put into capsules, incur a few more costs to the roaster.
Because of these additional costs and the difficulty to come to a precise estimate of them, the model was built only around the products sold in beans.
Finally, the prices at Migros for coffee in beans is on average lower than at Coop, especially for FLO labelled coffee. The business model of Migros detailed above is certainly the cause of this difference in price and will be discussed further in the Discussion chapter of this paper.
3.2 The model
Based on the coffee value chain described in the introduction, the model was created including all of the costs and margins applicable along the value chain of coffee starting from the retail price and ending with the price paid to the producer. This model does not only show the various costs and margins but also shows the price paid by each actor of the value chain to the previous one (for instance the price paid by the retailer to the roaster). As the volume and currency standardly used in the trade of Arabica coffee are pounds and US Dollar, when necessary the prices have been converted in USD/lb. from their original currency and/or unit of volume. This was done in order to ease the comparison of the figures.
The elements of the model are the following: 1. Retail price
2. VAT
3. Retail price duty-free 4. Retailer’s margin 5. Retailer’s costs 6. Roaster’s price 7. Roaster’s margin 8. Roaster’s costs 9. Trader’s price 10. Trader’s margin
11. Freight and insurance costs 12. Producer’s price
13. Equilibrium price
The price (in bold) of a particular actor in the chain is the price at which they sold the goods to the next actor in the chain and are equal to the addition of the actor’s costs and margin to the price paid to the previous actor in the chain, for instance: Roaster price = Trader price + Retailers costs + Retailers margin. Thus, those elements of the model will not be detailed hereunder.
3.2.1 Assumptions and limitations
Like any model, this model is based on and limited by the following assumptions. 1. Other than the price paid to the producer, all other costs remain the same for all
the actors of the value chain when comparing regular and FLO labelled coffee. 2. The differentials applied to the price paid to producers by traders were not
considered.
3. It is assumed that the model applies to any coffee sold in Switzerland, regardless of quality and origin.
4. Broker’s fees were not taken into account.
5. It is assumed that the margins and costs of the retailers are the same for the sale of coffee as it is for any other product of their assortment.
6. It is assumed that basic microeconomics principles apply, namely that coffee is bought or sold at market price or FLO minimum price plus premium(s). In other words, coffee is bought at the equilibrium
7. The difference between the model’s price paid to the producers and the market price or the FLO minimum price plus premium(s) is explained by assumptions 2, 3, and 4.
The first assumption relies on the fact that once FLOCERT has certified an actor of the value chain, the transportation and insurance costs, the trading costs, the costs of roasting and packaging as well as the retailing costs are the same for regular and certified coffee, as the raw material (green coffee beans) is the same. The green beans were grown and harvested according to specific standards, but it does not make them any different in terms of biology (i.e. size, weight, composition). Therefore, a 60kg bag of Fair Trade certified coffee contains the same amount of beans as a non-Fair Trade 60kg bag, and thus, costs the same to ship. A green bean is roasted in the same machine, at the same temperature, and for the same time regardless of whether it is Fair
Trade certified or not. This assumption was confirmed by Jonathan Garcia during his interview.
The second assumption, results from Jonathan Garcia’s interview, as he explains, the mechanism of differentials, whether they are a premium or a discount, applied to the price of coffee relies on various factors that are not accessible. Therefore, they were disregarded.
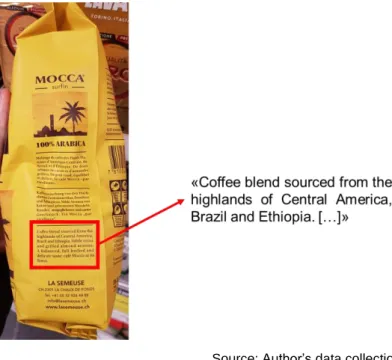
The third assumption is linked to the second. Indeed, as the precise origin of the beans and their quality is not known, every one of the coffees that were collected have to be considered as of the same quality and origin. To illustrate the incomplete information regarding the origin, see figure 3. As shown in figure 3, most of the coffee that was selected comes with little information regarding the precise origin of the beans. Moreover, many if not all of them are a blend of various beans from various origins.
Figure 3 - La Semeuse Mocca Surfin origins
Source: Author’s data collection
The fourth assumption stems from a discussion with Jonathan Garcia, following his interview. When presented with the model and asked about what cost could be missing, he mentioned the broker’s fee. Indeed, as he explained in some very rare cases, traders pay a broker’s fee to be able to trade with the producer. Namely, this is a 7 to 10 USD cents per pound of coffee that is paid to a broker, which sometimes happens to be a family member of the producer. As he explains, such fees would intervene in a maximum of 20% of his trades and can be considered as more of a hustle, inherent to dealing in
poor countries, than a fixed cost. Therefore, due to the rarity of the occurrence and its sometimes unofficial aspect, this cost was disregarded.
The fifth assumption derives from the source of the data collected. For the margins and costs of a retailer, the model is based on the analysis of the financial reports of both Coop and Migros. As both reports do not provide a detailed statement for particular products or even product ranges, it is assumed that their overall costs and margins apply similarly to any goods sold in their shops.
The sixth assumption is that as any free market, coffee trading is ruled by supply and demand, microeconomics concept. Therefore, it is assumed that the actors of the value chain respect those concepts and that at every link of the chain, the equilibrium or market price was enforced. In the case of Fair Trade coffee, the equilibrium equates to the FLO minimum price plus the applicable premiums.
The seventh assumption derives from the sixth one. Because it is assumed that the equilibrium is respected, any difference between the equilibrium and the model’s price paid to the producer is explained by either one or a combination of the second, third and fourth assumption.
3.2.2 Retail price
The retail price is the price of the various products gathered and shown in Table 1 and Table 2. As Jonathan Garcia explained, the benchmark for the Arabica coffee market and therefore the market price of Arabica coffee is the ICE Coffee C Futures. As the Coffee C Futures prices are expressed in USD cents per pound (Intercontinental Exchange 2020), we converted the prices and volume of the data from CHF to USD and from grams to pounds to ease the calculations and the reading of the data. For the currency conversion, the 2019 average published by the Swiss National Bank of 1 USD = 0.9937 CHF or 1 CHF = 1.0063 USD was used (Banque Nationale Suisse 2020). For the volumes, 1 kg = 2.2046 lb.
3.2.3 VAT
In Switzerland, the VAT is ruled by the Federal Act on Value Added Tax. There are three different rates described in article 25 of the Act, the normal rate of 7.7%, the reduced rate of 2.5%, and the special rate of 3.7%. The reduced rate is applied, amongst other goods and services, to foodstuff other than alcoholic beverages (Federal Assembly of Switzerland 2019). Therefore, the reduced rate of 2.5% is applicable.
3.2.4
Retailer’s margin
For the retailer’s margin, the calculations are based on the financial reports from both Migros and Coop. Both companies have the legal statute of cooperative, which is ruled by the Swiss Code of Obligations, according to article 856 of the Code of Obligations, they are obliged to have their annual report and financial statements at disposal of any of their members (Federal Assembly of Switzerland 2020). To become a member of either Coop or Migros, one has to sign up free of charge (Migros Group 2020). Effectively, anyone 18 or older can, therefore, become a member. Thus, Coop and Migros publish their annual report online, to ease the access to this document for their members. The first issue when it comes to dealing with financial statements is to choose which ratio to apply, namely which margin. With the numbers provided in both Migros and Coop reports, their EBITDA margin, their EBIT margin, and their profit margin can be computed (if not already provided). However, focusing on a single year would not necessarily be a fair representation of the long term financial reality of both companies. Indeed, as shown in Figure 4 and Figure 5, while net sales increased steadily for both companies over the past five years, their profit has just as steadily decreased5. When it comes to choosing which ratio to use, the EBITDA margin was chosen. Indeed, the model is built around the operational aspect of the value chain, therefore, interests, taxes, depreciation, and amortisations are not of interest.
Figure 4 - Migros Income and Profit 2015-2019
Source: (Migros Group 2020)
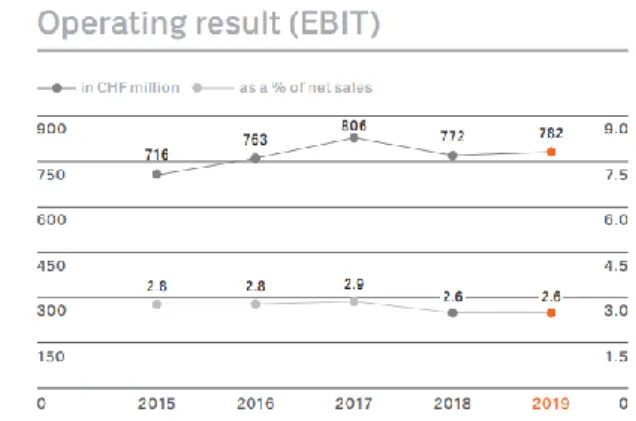
Figure 5 - Coop Net sales and Operating result 2015-2019
Source: (Coop Group 2020)
3.2.5 Retailer’s costs
The retailer’s costs are the hardest data to come by. Indeed, as supermarkets sell a wide variety of goods, it is close to impossible to pin a specific figure to a range of products, let alone a specific product. However, previously published models will be used to define the costs of retail for the present model. Of the various models discussed in the literature review, the model created by UNCTAD with data from the European Coffee Federation is the most relevant. Compared to John Talbot Model, it is more recent and based on aggregated data from figures of EU countries as well as Switzerland rather than on US figures. Therefore, the figures from this model will be considered and slightly modified, so that they represent Switzerland’s reality.
3.2.6
Roaster’s margin
The roaster’s margin used in the model is based on the publicly available financial statements of the largest coffee roasters, identified by UNCTAD (UNCTAD 2019). Of the seven largest roasters, five publish their reports publicly, namely Nestlé, Starbucks, Lavazza, Elite-Strauss, and J. M. Smucker. Furthermore, the margin computed from the SCA Economics of the coffee supply chain were also considered.
3.2.7
Roaster’s costs
The roaster’s costs of this model are based on two different sources. First, figures published by the Specialty Coffee Association in Economics of the Coffee Supply Chain
- An Illustrative Outlook. This publication is a model of the various costs associated with
the roasting and retail of coffee. This model is built on figures from another of the association’s publications and is based on figures provided by their members. Those figures were then aggregated to create a reference for each cost (Specialty Coffee
Association 2019). The second source is the figures published by Direct Coffee, a Swiss fair trade coffee roaster and retailer based in Basel. Direct Coffee disclosed the costs rundown of their operation for the 2015 harvest. As both sources are based on data from small to medium size roasters, and the data coffee selected for this paper is roasted by larger companies, the figures were then adapted to better fit this reality.
3.2.8
Trader’s margin
Similarly, to the retailer’s and roaster’s margin, the figure used in the model are based on the financial statements of the world’s largest coffee traders. According to the International Trade Centre’s estimates, the five largest trading companies, in terms of volume, share 45% of the world’s total volume. Those companies are Neumann, Ecom, Olam, Volcafe, and Louis Dreyfuss (International Trade Centre 2011). Of those five companies, three publish financial reports, Neumann and Ecom do not. As for the previous margins, the model is based on the five year average of the EBITDA margin. If applicable, the figures for the coffee segment were used, otherwise, the figures for the overall business were used.
3.2.9 Freight and insurance costs
As Jonathan Garcia pointed out during his interview, the most commonly used terms for sales contracts were “C” or “D” terms. Therefore, the costs of shipping and insurance are supported by the seller (i.e. the trader). Those costs are evidently passed down the value chain, but they will be considered as trader’s costs. Jonathan Garcia also confirmed that coffee is shipped in a forty-foot equivalent unit (FEU), in other words, forty-foot containers. Several indexes provide figures for the price of shipping goods in FEU (Marine Traffic Blog 2020).
Amongst those indexes, is the Shanghai Containerised Freight Index (SCFI), this index is a weighted average of the cost of shipping through various routes. However, as only 27.5% of the weight of the index is representative of FEU6 (Shanghai Shipping Exchange 2020), the model will not be based on this index.
A second index is the Freightos Baltic Index (FBX). This index is based on a combination of twelve routes and tens of thousands of daily data points from global logistics providers and expressed in USD/FEU (Freightos Baltic Index 2020). Amongst the twelve routes, only one is a route usually used in the trade of coffee, namely the Europe - South America
East Coast route (FBX24). The historical data for the FBX24 is not available to the public
past a certain time. Therefore, the 2019 half-year data (June-December) was considered.
A third index is the World Container Index published by Drewry, a shipping consulting firm. The index is published weekly and is a composite of 8 major routes (Drewry 2020). The year to date average of the latest report for 2019, published on December 21st, 2019 was considered.
A final index is the Xeneta Shipping Index (XSI). This index is based on long term contracts and is a weighted average of various US, European, and Far Eastern routes (Xeneta AS 2020a). However, the publicly available index is expressed in relative terms and not in USD/FEU. Furthermore, Xeneta’s disclaimer regarding its public report is the following: “The monthly XSI® Public Indices report is meant to give an indication of the
global market movements for the long-term contract market in the container shipping industry focusing on the biggest regions in the world. Xeneta does not recommend price setting on this market report as it is based on an aggregation of trade-weighted uncorrelated corridors.” (Xeneta AS 2020b). Therefore, this index will not be considered
for the model.
3.2.10 Equilibrium price
The equilibrium price of the model acts as a control of the producer price. The equilibrium price is the price that should have theoretically been paid to the coffee producer. It is either the market price for the non-FLO labelled coffees and the Fair Trade minimum price plus applicable premiums for the FLO labelled coffees.
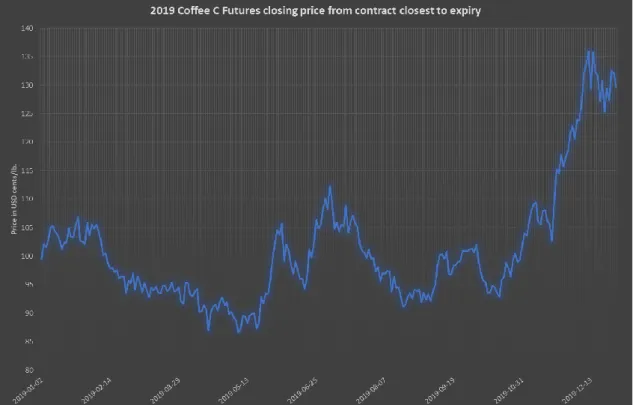
As the coffees retained for the model are all of the Arabica variety, the equilibrium price was defined as the 2019 average closing price for the Coffee C Futures contract closer to expiry7. The data for the contracts was extracted from the following contracts: March 19, May 19, July 19, October 19, December 19, and March 20. The computed average is 1.0114 USD/lb. Those closing prices are displayed in Figure 6 below.
Figure 6 - 2019 Coffee C Futures closing price from contract closest to expiry
Source: Author’s computations of data retrieved from www.barchart.com
For the FLO labelled coffees, FLO publishes a table with the applicable minimum prices and premiums and updates this table regularly. The past 3 versions8 of this table (i.e. published during the time of writing this paper) did not make any change to the minimum price of coffee or to any of the premiums. For coffee, two elements are taken into account to compute the minimum price. Those are the variety of bean (Arabica or Robusta) and whether the coffee is washed or natural. The FLO labelled coffees that were selected are all Arabicas. As for the state of the coffee (i.e. washed or natural), Jonathan Garcia reported in his interview that natural coffee is traded in larger volume than washed coffee by a wide margin. Therefore, the Arabica washed minimum price of 1.40 USD/lb. will be used as the equilibrium. To this minimum price, the Fairtrade premium of 0.20 USD/lb. was added and if the coffee was sporting a Bio Label, the organic premium of 0.30 USD/lb was also added. Thus, the FLO equilibrium price is either 1.60 USD/lb. or 1.90 USD/lb. depending on whether the selected coffee is labelled Bio or not.
4. Results
4.1
Retailer’s margin
First, the five year average of Coop’s and Migros’ various margin was computed to get a gross view of the figure. The computations are found hereunder in Table 3.
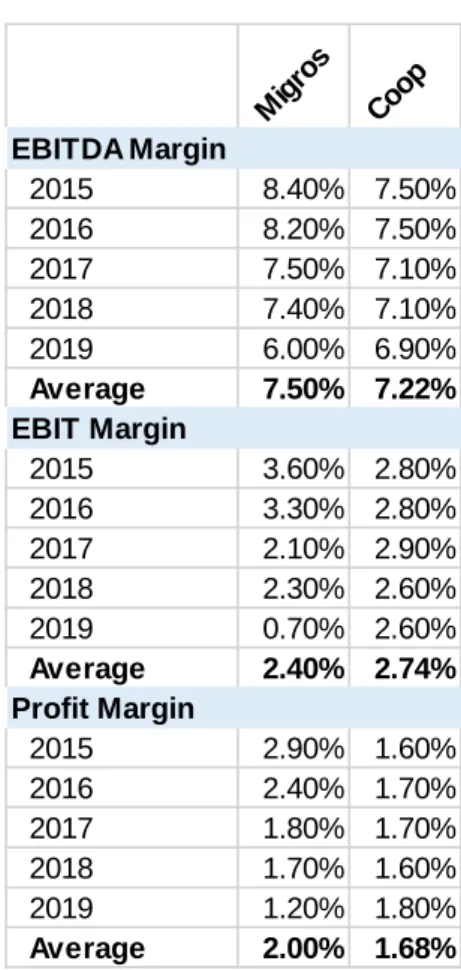
Table 3 - Migros & Coop Margins
Source: Author’s computation based on figures retrieved from (Migros Group 2020) & (Coop Group 2020)
As shown in Table 3, both companies work with very similar margins. However, those margins are not satisfactory yet. Indeed, those ratios are based on both Migros’ and Coop’s Group financials. This includes its electronics shops, restaurants, etc. As all of those businesses apply different margins, further research was conducted.
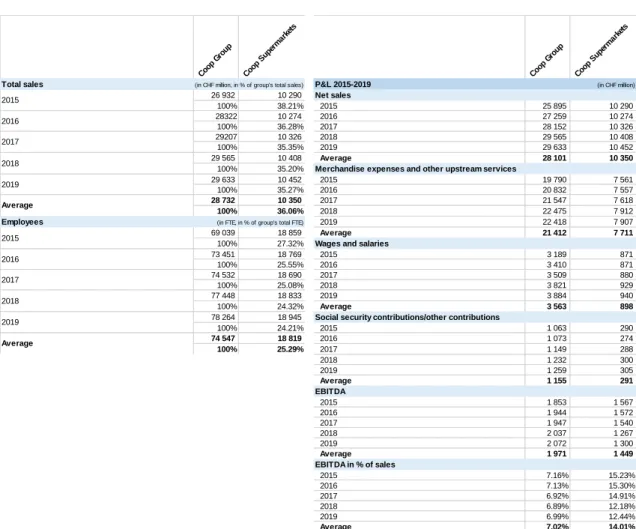
In Coop’s report, the group’s net sales are broken down into the net sales of all of their outlets/markets. The group’s total workforce is also broken down into the workforce of all of their outlets/markets. Therefore, assuming that the ratio of expenses from a particular outlet over the group’s total expenses is equal to its ratio of sales over the group’s total sales, and assuming that the ratio of a particular outlet’s workforce over the group’s total
Mig ros Coo p EBITDA Margin 2015 8.40% 7.50% 2016 8.20% 7.50% 2017 7.50% 7.10% 2018 7.40% 7.10% 2019 6.00% 6.90% Average 7.50% 7.22% EBIT Margin 2015 3.60% 2.80% 2016 3.30% 2.80% 2017 2.10% 2.90% 2018 2.30% 2.60% 2019 0.70% 2.60% Average 2.40% 2.74% Profit Margin 2015 2.90% 1.60% 2016 2.40% 1.70% 2017 1.80% 1.70% 2018 1.70% 1.60% 2019 1.20% 1.80% Average 2.00% 1.68%
workforce is equal to its ratio of wages and social security over the group’s total wages and social security, a particular outlet’s EBITDA can be computed by reconstructing a P&L applying those ratios. Those computations led to the results shown in Table 4.
Table 4 - Coop’s revisited P&L9
Source: Author’s computation based on figures retrieved from (Coop Group 2020; 2018; 2017)
Thanks to those computations, an EBITDA margin of 14.01% for the supermarket unit of the Coop Group was computed and this is the figure that is used in the model. Therefore, the retailer’s margin equals 14.01% of the Retail price duty-free.
4.2
Retailer’s costs
The model published by UNCTAD in its Special Issue on Coffee in East Africa defines the costs carried by the retailers as 12% of the retail price. However, this figure stems from an aggregate of figures from European countries and is therefore not necessarily
9 A slight difference can be noticed between the computation from Table 4 and
the figures from Table 3. This difference comes from the rounding of numbers.
Coo p G roup Coo p S uper mar kets Coo p G roup Coo p S uper mar kets
Total sales P&L 2015-2019 (in CHF million)
26 932 10 290 Net sales 100% 38.21% 2015 25 895 10 290 28322 10 274 2016 27 259 10 274 100% 36.28% 2017 28 152 10 326 29207 10 326 2018 29 565 10 408 100% 35.35% 2019 29 633 10 452 29 565 10 408 Average 28 101 10 350 100% 35.20% Merchandise expenses and other upstream services
29 633 10 452 2015 19 790 7 561 100% 35.27% 2016 20 832 7 557 28 732 10 350 2017 21 547 7 618 100% 36.06% 2018 22 475 7 912 Employees 2019 22 418 7 907 69 039 18 859 Average 21 412 7 711 100% 27.32% Wages and salaries
73 451 18 769 2015 3 189 871 100% 25.55% 2016 3 410 871 74 532 18 690 2017 3 509 880 100% 25.08% 2018 3 821 929 77 448 18 833 2019 3 884 940 100% 24.32% Average 3 563 898 78 264
18 945 Social security contributions/other contributions
100% 24.21% 2015 1 063 290 74 547 18 819 2016 1 073 274 100% 25.29% 2017 1 149 288 2018 1 232 300 2019 1 259 305 Average 1 155 291 2015 1 853 1 567 2016 1 944 1 572 2017 1 947 1 540 2018 2 037 1 267 2019 2 072 1 300 Average 1 971 1 449 2015 7.16% 15.23% 2016 7.13% 15.30% 2017 6.92% 14.91% 2018 6.89% 12.18% 2019 6.99% 12.44% Average 7.02% 14.01% Average EBITDA EBITDA in % of sales 2017
(in CHF million, in % of group's total sales)
(in FTE, in % of group's total FTE)
2015 2016 2017 Average 2018 2019 2018 2019 2015 2016
representative of each country whose figures have been aggregated. Indeed, Switzerland has amongst the highest wages and rent in the world, let alone in Europe, and those two costs represent a large portion of a retailer’s costs. Wages and social security represented for Coop and Migros 21.46% and 22.46% of their respective operating expenses. According to data published by the statistical office of the European Union (Eurostat 2020), the swiss median gross hourly earnings in 2014, was 124% higher than the European Union average, comparable only to countries such as Denmark or Ireland. Therefore, this large difference must be considered in the model.
For the cost of rent, the reality is more complex. Indeed, both Coop’s and Migros’ retail locations are either rented or own. A research of the land registry shows that retail locations are sometimes owned by the retailer or sometimes by a third party. For instance, Coop Florissant supermarket in Geneva, where the data for this paper was collected is owned by the Coop Group, while the Coop Augustin supermarket located less than two kilometres away is owned by Zurich Insurance10. For Migros, the situation is a little bit different as the various Migros Geneva locations that were researched on the land registry were all owned by third parties11. However, Migros also owned and rent
property in some of its malls in Vaud (Migros Group 2020). Due to the complexity of the issue, the higher cost of land in Switzerland compared to EU countries was disregarded. Therefore, it is assumed that 21.96% (average of Coop’s and Migros’ weight of personnel cost in their total operating expense) of the retailers' costs in Switzerland is 124% higher than the European aggregated figure published by UNCTAD. Therefore, the figure that will be used is 15.27%12 of the duty-free retail price correspond to the retailer’s costs.
Furthermore, as mentioned in the assumptions of the model, the costs must remain the same regardless of quality or certification of coffee. Thus, the relative 15.27% had to be converted into a single figure. To do so, this figure was applied to the duty-free retail price of the selected coffees and then averaged to the figure of 1.22 USD/lb.
4.3
Roaster’s margin
Unfortunately, the precision of the five financial statements that were analysed varies tremendously. Indeed, some companies report their figures by segment, some overall,
10 Data retrieved from the Geneva land registry available at
https://ge.ch/terextraitfoncier/adresse.aspx 11 Idem
some only report their operating results while some other more detailed financial statements. The margins closest to the EBITDA margin were computed for each of the selected companies and are the following: operating profit margin of the Liquid and
powdered beverages for Nestlé; global operating profit margin for Starbucks; EBITDA
margin for Lavazza; EBITDA Margin of the Total coffee segment for Strauss; coffee gross profit margin for J.M. Smucker. The computations are the following:
Table 5 - Roaster’s margins
Source: Author’s computations based on data retrieved from (Nestlé 2018; 2019; 2020; Specialty Coffee Association 2014; 2019; Starbucks Corporation 2018; 2019; 2020; Lavazza 2017; 2018; 2019; Strauss Group 2016; 2017; 2018; J.M. Smucker 2018; 2019; 2020)
As shown in Table 5, the computations vary widely. However, Lavazza’s and Strauss’ EBITDA margins are the most interesting for the present analysis. Indeed, as mentioned in the Methodology, the model aims to capture the operational added value of each actor of the value chain. Therefore, the EBITDA margin is the closest margin available. Furthermore, Strauss’s margin is based solely on the costs and revenues of their coffee operations. Therefore, the model is based on the average of the two margins, namely 9.57%. Therefore, the retailer’s margin in the model is equal to 9.57% of the roaster’s price.
4.4
Roaster’s costs
For the roaster’s costs, data was extracted from the Economics of the Coffee Supply
and averaged. Of the costs contained in this outlook, the costs starting with Warehouse
and Logistics to Certification Costs were considered. This amounts to a total of 3.72
USD/lb. for 2014 and 5.31 USD/lb. for 2019. As the study whose data were used to create this tool was based on costs reported mostly by the North American members of the association (Specialty Coffee Association 2019), it should be compared with the costs of a Swiss roaster. Therefore, the data published by Direct Coffee (see Figure 8) was used as a basis of comparison. The costs of Roasting, Packaging, and Marketing were considered and amount to 4.91 CHF/350g. Converted in USD/lb., the figure of 3.81 USD/lb. is obtained. As the numbers of Direct Coffee are from 2015, they were compared with the figures from SCA of 2014. This represents a difference of 0.09 USD/lb. with the figures of the SCA or about 2.36% which is satisfactory. Therefore, the average of the 2014 and 2019 SCA figures was considered, 4.52 USD/lb (Specialty Coffee Association 2014; 2019).
However, the data from this study comes mostly from small to medium-sized roasters and the coffees selected for the model are produced by larger roasters. Thus, those would benefit from the economy of scale and the figure for a larger roaster is likely inferior to 4.52 USD/lb. For the model, it is assumed that a larger roaster would benefit from a 10% decrease in costs thanks to the larger volume of its operation. Therefore, the figure retained for the model is 4.07 USD/lb.
Figure 7 - Economics of the Coffee Supply Chain 2019
Figure 8 - Direct Coffee, what the farmer gets
Source: (Tuil 2016)
4.5
Trader’s margin
Based on their respective financial statements, the five years EBITDA margin average of Volcafe Olam, (ED&F Man), and Louis Dreyfuss were computed. For Louis Dreyfuss and Volcafe, the figures are the EBITDA of their business as a whole. Indeed, they do not publish detailed financials for each source of revenue. Olam, on the other hand, publishes its revenue and EBITDA detailed by the source of revenue. Therefore, the figures for Olam are from the Confectionery and Beverage Ingredients segment. Those figures are slightly below the EBITDA of all the segments.
Table 6 - Traders’ Margins
Source: Author’s computations based on data retrieved from (Olam Group 2019; ED&F Man 2017; 2018; 2019; Louis Dreyfus Company 2018; 2019; 2020)
As shown in Table 6, the margins of traders are tremendously more volatile and unstable than the previous actors of the value chain. Margins can change drastically from one
Average EBITDA in % of sales EBITDA in % of sales EBITDA in % of sales EBITDA in % of sales EBITDA in % of sales EBITDA in % of sales EBITDA in % of sales Olam 4.82% 4.14% 5.28% 4.03% 6.23% 4.90%
Volcafe (ED&F Man) 0.79% 1.39% 2.20% -0.28% 0.50% 0.92%
Louis Dreyfuss 1.07% 0.98% 1.86% 2.87% 2.49% 1.85%
Average 2.80% 2.20% 2.82% 1.87% 3.20% 2.49% 2.56%
2019
year to the next and from one trader to the other. The average of five years of the three companies, once put together, comes up to 2.56%. When asked about the figures of Louis Dreyfuss, Jonathan Garcia said: “I’d say 3% or more or less 3% for coffee is really
good” (Appendix 1, p. 50). Therefore, the figure of 2.56% of the trader’s price as the
trader’s margin can be confidently used in the model
4.6 Freight and Insurance costs
For the Freightos Baltic Index, the FBX24, as shown in Figure 9 and Figure 10, has constantly been below the global index. FBX24 2019 half-year average computation is 959.97 USD/FEU with a volatility of 4.83%13, slightly below the 1373.18 USD/FEU with
a 1.85% volatility14 of the global index. As the data for FBX24 is too scarce and concerns
only a single route, the global FBX index will be used.
Figure 9 - FBX Index 2019
Source: (Freightos Baltic Index 2020a)
13 Author’s computation based on figures retrieved from FBX
Figure 10 - FBX24 Index June-December 2019
Source: (Freightos Baltic Index 2020b)
When it comes to the WCI, the final weekly report of the index, published on December 21st, 2019, was considered. This one reported a year to date average of 1420 USD/FEU. Therefore, we will use this figure.
Figure 11 - World Container Index December 2017 to December 2019
Source: (Hellenic Shipping news 2019)
Thus, to compute the freight costs in the model, the mean of the 2019 FBX and 2019 WCI will be used, namely 1396.59 USD/FEU. This number is in line with Jonathan Garcia’s assessment of 1400 USD/FEU.
For the volume of coffee contained in a 40-foot container, the International Trade Centre’s Coffee Exporter’s Guide gives an estimate of the maximum net payload of an FEU15. This estimate is between 26.4 and 27.5 Metric Tons of coffee (International Trade
Centre 2011). Converted in pounds, between 58’202 and 59’525 pounds. The price of 1396.59 USD/FEU was then applied to find between 0.23 USD/lb. and 0.25 USD/lb. so an average of 0.24 USD/lb.
For the insurance costs, the figure of 1.5 USD cents/lb. provided by Jonathan Garcia was used. Therefore, the model uses the figure of 0.26 USD/lb. for freight and insurance costs.
4.7 The Model
Once all those figures were added together, the model was completed, and the data collected could be plugged into it. The results are shown in Table 7 hereafter and will be discussed in the next chapter.
So u rc e: Au th o r’s c om pu ta tio ns T ab le 7 T he M od el
5. Discussion
5.1 Analysis of the results - margins of the pairs
Before going into the details of each cost, it is interesting to take a first look at the difference between the equilibrium price of Fair Trade coffee and regular coffee. Indeed, assuming, that costs remain the same along the value chain, once the producer has been paid, the difference between the two equilibrium prices of comparable products and the final retail prices of those two products should be the same or very close (accounting for the margins which are in relative term and not fixed like the costs).
As defined previously, the equilibrium price of Fair Trade coffee is 1.90 USD/lb. for Bio Arabica and 1.60 USD/lb. for non-Bio Arabica, and the average price of coffee computed for 2019 was 1.01 USD/lb. Therefore, the difference in the retail price (duty-free) should be about 0.89 USD/lb. for Bio Arabica and 0.59 USD/lb. for non-Bio Arabica. Looking at the model’s output, the pairs of coffee selected at Coop, present a difference of 1.90 USD/lb. for the La Semeuse pair and a difference of 0.89 USD/lb. for the Chicco d’Oro pair.
At first glance, Chicco d’Oro seems to respect this claim, while the difference for the
Chicco d’Oro pair is more than double the 0.89 USD/lb. However, before jumping too
fast to conclusions, those figures are based on benchmarks. And as mentioned previously, a variety of premiums and discounts are applied to those benchmarks to define the real price paid to the producer. Therefore, those figures might not apply to the coffees selected for this study. To have a fairer assessment of the situation, the outputs of the model should be used and would provide a better analysis.
Based on the model’s assumptions, the pairs of the coffees selected at Coop should be of the same quality and origins and should have therefore been traded at an identical differential over the Coffee C Futures Benchmark. Thus, the difference between the Equilibrium price and Producer price of the model should be the same for a pair.
Looking at the difference between Producer Price and Equilibrium for La Semeuse pair, the Fair Trade coffee has a difference of +0.86 USD/lb., while the regular coffee has a difference of +0.30 USD/lb. For the Chicco d’Oro pair, there is a +0.18 USD/lb. difference for the Fair Trade coffee and a +0.40 USD/lb. difference for the regular coffee. Therefore, there is an unexplained +0.56 USD/lb and -0.22 USD/lb. difference. Based on the model’s assumption, this difference must be explained by margins varying between the sale of Fair Trade and non-Fair Trade coffee. Indeed, as costs remain the same and