Supporting Information
Rapid and sensitive quantification of cellular associated multi-walled carbon nanotubes
Lukas Steinmetz, Joel Bourquin, Hana Barosova, Laetitia Haeni, Jessica Caldwell, Ana Milosevic, Christoph Geers, Mathias Bonmarin, Patricia Taladriz-Blanco, Barbara Rothen-Rutishauser, Alke Petri-Fink
Figure S1. UV-Vis absorbance spectra of 14 & 42 nm AuNPs and Mitsui-7 & Nanocyl MWCNTs in
complete cell culture media. Spectra were recorded over 24 h in one-hour steps. Extended signs of aggregation were only observed for 14 nm AuNPs in cM199. The reduction of absorbance over time for Mitsui-7 MWCNTs can be related to their sedimentation in the cuvette, which is caused by their relatively large size.
Electronic Supplementary Material (ESI) for Nanoscale.
This journal is © The Royal Society of Chemistry 2020
Figure S2. UV-Vis absorbance spectra of 14 nm (A) & 42 nm (B) AuNPs @ PVP. Dispersed and
aggregated NPs are compared. Aggregation of NPs was achieved by the addition of 0.1 M HCl.
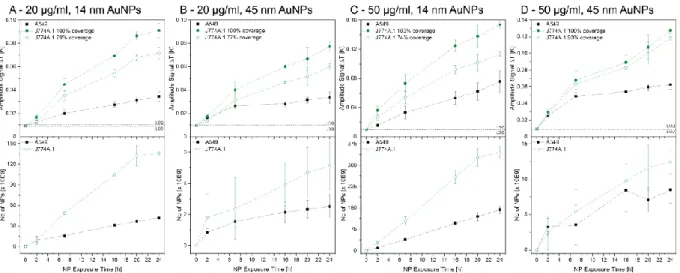
Figure S3. LIT AuNP-cell association trends (top row) and ICP-OES analysis (bottom row) for J774A.1
cells (macrophages). Due to their non-confluent growth pattern macrophages can not be directly compared to the investigated epithelial and mesothelial cells. Therefore, the cell coverage was determined (79 %, 77 %, 74 % and 93 %, for A-D) and normalized to a theoretical 100 % coverage.
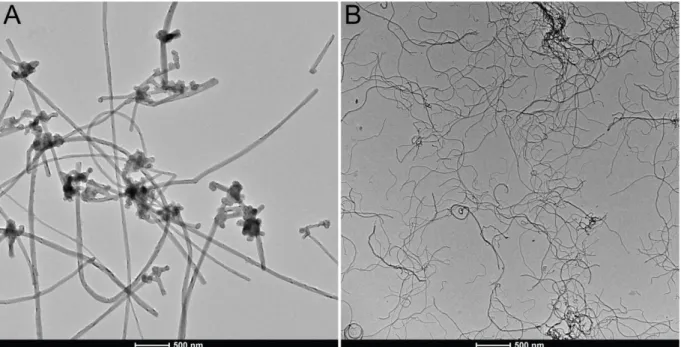
Figure S4. TEM micrographs of Mitsui-7 (A) & Nanocyl (B) MWCNTs in water, highlighting the difference
in dimensions and stiffness.
Figure S5. LIT MWCNT-association trends for J774A.1 cells (macrophages) at an exposure
concentration of 10 μg/ml. Cell coverage was determined (70 % A & 74 % B) and normalized to a theoretical 100 % coverage.
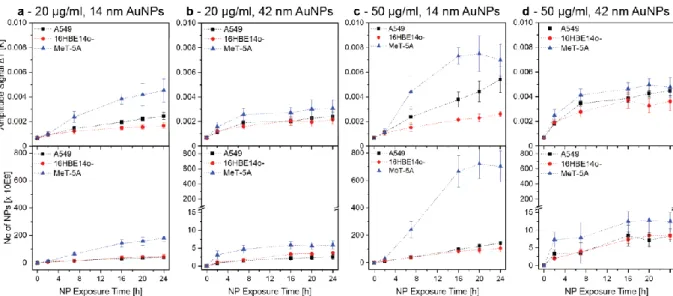
Figure S6. Re-printed Figure 3 with identical y-axes. AuNP-cell association trends over 24 h, obtained
by LIT (top row, 525 nm excitation wavelength) and ICP-OES (bottom row). The association trends of A549, 16HBE14o-, and MeT-5A cells exposed to 20 and 50 μg/mL of 14 nm (A, C) and 42 nm AuNPs (B, D) were investigated. Hence, it was possible to determine that, independent of the NP size and concentration, the AuNP association is higher for MeT-5A. The plateau reached under some conditions indicated a NP-cell association saturation.
Figure S7. Re-printed Figure 4 with identical y-axes. Comparison of LIT measurements for
cell-associated AuNPs at an excitation wavelength of 525 nm (closed symbols) and 730 nm (open symbols). The generation of heat at an excitation wavelength of 730 nm is a clear indication for NP aggregation. However, association trends for 20 μg/mL (black symbols) and 50 μg/mL (red symbols) evolve in an almost identical manner over time. Therefore, either all AuNPs aggregate due to the association or single NPs and aggregates associate to a similar extent.
14 nm AuNPs 42 nm AuNPs
[nm] cRPMI cMEM cM199 cRPMI cMEM cM199
t0 44 ± 23 36 ± 19 59 ± 15 132 ± 8 108 ± 15 118 ± 48
t1h 59 ± 10 40 ± 5 98 ± 22 117 ± 7 108 ± 15 116 ± 13
t5h 73 ± 3 36 ± 10 135 ± 13 111 ± 11 127 ± 20 124 ± 66
t24h 70 ± 4 43 ± 1 144 ± 4 108 ± 6 119 ± 20 121 ± 1