Publisher’s version / Version de l'éditeur:
Vous avez des questions? Nous pouvons vous aider. Pour communiquer directement avec un auteur, consultez la première page de la revue dans laquelle son article a été publié afin de trouver ses coordonnées. Si vous n’arrivez pas à les repérer, communiquez avec nous à [email protected].
Questions? Contact the NRC Publications Archive team at
[email protected]. If you wish to email the authors directly, please see the first page of the publication for their contact information.
https://publications-cnrc.canada.ca/fra/droits
L’accès à ce site Web et l’utilisation de son contenu sont assujettis aux conditions présentées dans le site LISEZ CES CONDITIONS ATTENTIVEMENT AVANT D’UTILISER CE SITE WEB.
Canadian Building Digest, 1976-02
READ THESE TERMS AND CONDITIONS CAREFULLY BEFORE USING THIS WEBSITE. https://nrc-publications.canada.ca/eng/copyright
NRC Publications Archive Record / Notice des Archives des publications du CNRC :
https://nrc-publications.canada.ca/eng/view/object/?id=8ecc4b1f-12aa-4f47-8056-976c2bb494aa
https://publications-cnrc.canada.ca/fra/voir/objet/?id=8ecc4b1f-12aa-4f47-8056-976c2bb494aa
NRC Publications Archive
Archives des publications du CNRC
For the publisher’s version, please access the DOI link below./ Pour consulter la version de l’éditeur, utilisez le lien DOI ci-dessous.
https://doi.org/10.4224/40000438
Access and use of this website and the material on it are subject to the Terms and Conditions set forth at
Ground-level winds around tall buildings
Canadian Building Digest
Division of Building Research, National Research Council Canada
CBD 174
Ground-level Winds Around Tall
Buildings
Originally published February 1976. W.R. Schriever
Please note
This publication is a part of a discontinued series and is archived here as an historical reference. Readers should consult design and regulatory experts for guidance on the applicability of the information to current construction practice.
Because of the frictional drag of the earth's surface, wind speeds at ground level are much lower than those in the unobstructed flow several hundred feet higher (gradient wind). In general, the rougher or more built up the area, the lower the speed near the ground. There is, however, an exception to the rule. Tall, slab-like buildings tend to deflect wind down into previously sheltered areas. The resulting increased wind speeds near the ground are annoying and at times dangerous to pedestrians. This problem is becoming more widespread with the increasing number of tall buildings. Indeed cities with many tall buildings have become known as "windy cities."
It is the purpose of this Digest to review the effect of wind on people and discuss wind speed changes induced by buildings. Mechanical effects that make it difficult to walk and thermal effects that make a place chillier than it would otherwise be, will be considered.
Mechanical Effects
The Beaufort Scale of Wind Speeds, prepared in 1806 for use at sea and later extended to use on land by stating the effects of wind on people, trees, etc., serves as a convenient starting point (Table 1). Speeds shown are averages only and may be exceeded by gusts. As winds are usually very gusty between buildings, some of the effects will occur at Beaufort numbers lower than those stated.
The descriptions used in Table 1 come from different sources,1,2including the British Building
Research Station where staff members have been subjected to steady winds in a wind tunnel. Difficulties with gusty winds similar to those experienced by pedestrians near the base of tall buildings have been studied in Australia.3It was found that with winds gusting to 20 m/sec (45
mph) people had difficulty with balance, particularly if a gust came from the side. For example, if the wind speed rose from 12 to 23 m/sec (27 to 52 mph) in 2 to 3 sec, some people were forced to their hands and knees.
Table I. Beaufort Scale And Wind Effects On Land
Number Speed mph
1 1-3 No noticeable wind. Smoke rises nearly vertically. 2 4-7 Wind felt on face, leaves rustle.
3 8-12 Hair is disturbed, clothing flaps.
4 13-18 Dust and loose paper raised, hair disarranged. 5 19-24 Force of wind felt on body. Limit of agreeable wind on land. 6 25-31 Some inconvenience in walking.
7 32-38 Difficulty when walking against wind. 8 39-46 Difficulty with balance in walking. 9 47-54 Danger in being blown over.
10 55-63 Trees uprooted, considerable structural damage.
High wind speeds that may be only annoying for the young and fit can be very dangerous for the elderly or infirm, particularly if streets and sidewalks are slippery. In Great Britain during 1972 two elderly people actually died of head injuries suffered in separate accidents in which they were blown over at the corners of tall buildings. As wind speeds tend to be increased by tall buildings, some limitation to that increase should be sought.
Thermal Effects
The thermal (or chilling) effect of wind is also important, but it is more difficult to assess, because of the interaction of air temperature, sunshine, clothing and activity (heat production), quite apart from the fact that people in different climates apparently have different
temperature tolerances.
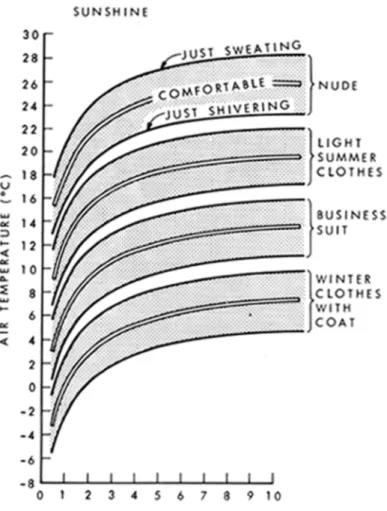
Basically the question of comfort is one of heat loss from the human body. using the limits of "onset of sweating" and "onset of shivering" Humphreys4has calculated the conditions that
produce thermal comfort. To give an example, a particular metabolic rate (strolling) and solar gain (sunshine) were chosen. Figure 1 shows the strong influence of wind speed on comfort conditions, particularly at lower speeds.
Figure 1. Comfort conditions for strolling in full sun, as a function of air temperature, wind speed, and clothing. (Crown copyright. Reproduced by permission of the Director, Building Research Establishment, U.K.)
Shelter Around Buildings The effect of buildings on wind speeds at pedestrian level can be expressed by the ratio:
R =wind speed at pedestrian level, with buildings wind speed at the same level, no buildings
In suburban areas where there are only low buildings pedestrian areas generally experience wind speeds with ratios, R, in the range 0.5 to 0.7.1When wind encounters a single tall
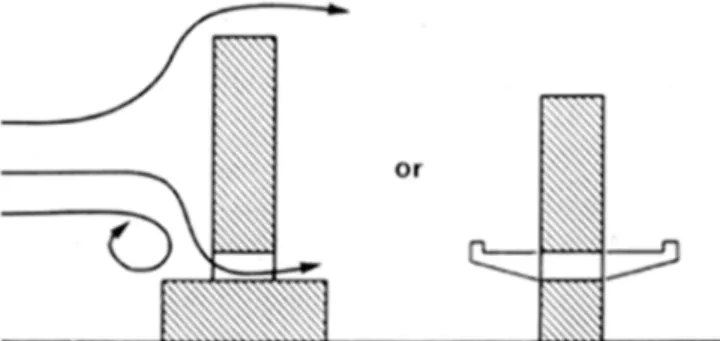
slab-like building a different flow pattern emerges (Figure 2). The wind divides at about three quarters of the building height (stagnation region). Above this, the air flows up the face of the building and over the roof; below, it flows down to form a vortex in front of the building before rushing round the windward corners. This results in increased wind speeds in regions A and B, where R maybe as high as 1.5 and 2.0, respectively.
Figure 2. Flow patterns around tall, slab-like building. Note areas of increased wind speeds at pedestrian level. (Crown copyright. Reproduced by permission of the Director, Building Research Establishment, U.K.)
Wind speeds around a particular building are dependent on various factors, but in part on the height and width of building.5The values quoted are for a slab-type structure four or more
times the height of those surrounding it. When height is less than twice that of surrounding buildings, R does not generally exceed 1.0.1The distance downwind over which increased wind
speeds will be experienced depends on the configuration of the neighbouring buildings, but it can be expected to be roughly equal to the height of the tall one.
As the higher wind speeds are produced mainly by downward deflection of the flow, solutions to the problem generally attempt to prevent this flow from reaching the ground. For example, if a tall building is placed on a large podium, the affected areas can be confined to the roof of the podium (Figure 3).
Figure 3. Use of a podium or canopy to remove areas of increased wind speeds from street level. (Crown copyright. Reproduced by permission of the Director, Building Research Establishment, U.K.)
Wind Frequency
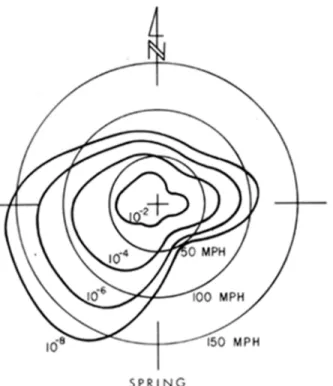
An important question is how frequently certain wind speeds induced by a proposed new building should be allowed to occur in areas where wind speed is affected by a new building. Wind conditions must necessarily be described in statistical terms. Figure 4 is a statistical representation of mean wind speed at gradient level for Toronto for the spring, the windiest part of the year. The contours indicate the relative fraction of time during which wind speeds exceed certain values. The frequency with which winds occur at gradient level is often
unavailable, but corresponding plots can be derived from wind speeds and directions measured at a height of 30 ft (10 m) at weather stations of the Atmospheric Environment Service.
Figure 4. Example of seasonal probability distribution of mean hourly gradient wind speeds, Toronto. (Courtesy, A.G. Davenport.)
The estimation of air flow at street level is difficult because of the interaction of groups of buildings and can usually be achieved only by studying in a wind tunnel an accurate scale model of the building in question as well as its surroundings. For such studies it is essential to use a type of wind tunnel that is capable of simulating the important properties of the real wind, i.e., the variations of wind speed with height and its turbulence or gustiness, for example those at the University of Western Ontario and NRC's National Aeronautical Establishment. By rotating the model and its surroundings on a turntable it is possible to measure street-level wind speeds for different wind directions.
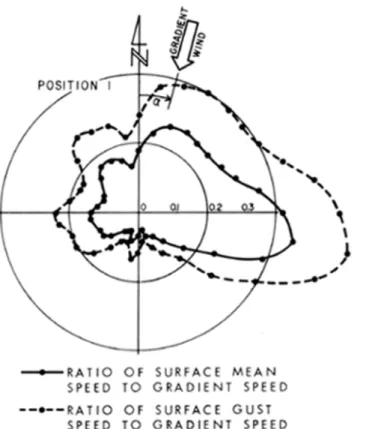
The results can be summarized for each measuring position in the form illustrated by Figure 5, which shows the ratio of the wind speed measured at street level to that at the reference gradient level above the city, and indicates that surface winds are highly dependent on wind direction.
Figure 5. Example of variations of surface mean and gust speeds for winds from different directions. (Courtesy, A.G. Davenport.)
Guidelines
The degree of comfort considered desirable varies with activity, i.e., walking, strolling, or sitting. Although temperature is a prime factor, windiness of a particular location is also important and is more subject to modification - good or bad - by the design and grouping of buildings.
Using statistical procedures, information of the type shown in Figure 4 and Figure 5 can be combined for estimating the relative frequency with which winds of certain strength will occur and for comparing the results with suggested criteria of acceptable frequencies of wind speeds for different activities (Table 2). These limits6have been slightly modified by the author and
should be considered only as a guideline to be used with discretion, based on local conditions. A more detailed treatment of this subject has recently been published by the British Building Research Establishment.7
Table II. Possible Limits For Windiness of Pedestrian Areas Units: Beaufort Numbers
Conditions will be
Activity applicable pleasant unpleasant annoying dangerousAreas if wind speed exceeds
Walking
fast Sidewalks 4 5 6-7 8
Walking Entrance areas 3 4 5 8
sitting -short exposure shopping malls Sitting -long exposure Outdoor restaurants, bandshells 1-2 2-3 3-4 8
not more frequently than
- once/week once/month once/year
Although it is impractical to eliminate all occurrences of unacceptable wind conditions, such occurrences should be sufficiently infrequent as to permit the desired function of the pedestrian areas.
References
1. British Building Research Station, Wind Environment Around Tall Buildings. Digest 141, May 1972.
2. Penwarden, A. D., Acceptable Wind Speeds in Towns. Building Science, Vol. 8, 1973, p. 259-267. 3. Melbourne, W. H. and P. N. Joubert, Problems of Wind Flow at the Base of Tall Buildings. Paper I,
II, Proceedings, Third International Conference on Wind Effects on Buildings and Structures, Tokyo, 1971.
4. Humphreys, M. A., A simple theoretical derivation of thermal comfort conditions. J. Instn. Heat, Vent. Engrs, 38, 95 (1970).
5. Wise, A. F. E., Wind Effects Due to Groups of Buildings. BRS Current Paper CP 23/70, July 1970. 6. Davenport, A. G., Private Communication.
7. Penwarden, A. D. and A. F. E. Wise, Wind Environment Around Buildings. Department of the Environment, U.K., Building Research Establishment, 1975.