HAL Id: hal-02046494
https://hal.archives-ouvertes.fr/hal-02046494
Submitted on 22 Feb 2019
HAL is a multi-disciplinary open access
archive for the deposit and dissemination of
sci-entific research documents, whether they are
pub-lished or not. The documents may come from
teaching and research institutions in France or
abroad, or from public or private research centers.
L’archive ouverte pluridisciplinaire HAL, est
destinée au dépôt et à la diffusion de documents
scientifiques de niveau recherche, publiés ou non,
émanant des établissements d’enseignement et de
recherche français ou étrangers, des laboratoires
publics ou privés.
Coupled study of the film and spray on a basic annular
prefilming airblast atomizer
Valentin Gosselin, Bernard Ferret, Rudy Bazile
To cite this version:
Valentin Gosselin, Bernard Ferret, Rudy Bazile. Coupled study of the film and spray on a basic
annular prefilming airblast atomizer. 28th European Conference on Liquid Atomization and Spray
Systems (ILASS 2017), Sep 2017, Valence, Spain. �10.4995/ILASS2017.2017.4626�. �hal-02046494�
OATAO is an open access repository that collects the work of Toulouse
researchers and makes it freely available over the web where possible
Any correspondence concerning this service should be sent
to the repository administrator:
tech-oatao@listes-diff.inp-toulouse.fr
This is an author’s version published in:
http://oatao.univ-toulouse.fr/22924
To cite this version:
Gosselin, Valentin and Ferret, Bernard and Bazile, Rudy
Coupled study of the film and spray on a basic annular
prefilming airblast atomizer. (2017) In: 28th European
Conference on Liquid Atomization and Spray Systems (ILASS
2017), 6 September 2017 - 8 September 2017 (Valencia,
Spain)
Official URL:
http://dx.doi.org/10.4995/ILASS2017.2017.4626
ILASS–Europe 2017, 28th Conference on Liquid Atomization and Spray Systems, 6-8 September 2017, Valencia, Spain http://dx.doi.org/10.4995/ILASS2017.2017.****
This work is licensed under a Creative Commons 4.0 International License(CC BY-NC-ND 4.0). EDITORIAL UNIVERSITAT POLITÈCNICA DE VALÈNCIA
Coupled study of the film and spray on a basic annular prefilming
airblast atomizer
V. Gosselin*
1, B. Ferret
1, R. Bazile
11
Instiute de mécanique des fluides de Toulouse, France
*Corresponding author: valentingregoire.gosselin@imft.fr
Abstract
One way to increase efficiency and reduce pollution in transport and energetic domain is designing fuel injectors with better atomization. In this work, experiments were performed on a prefilming airblast atomizer often used in gas turbine engines. For this purpose, a new injector was designed to visualize the prefilming zone and the primary atomization together. The flow configuration corresponds to an annular liquid film sheared by inner high velocity airflows. High speed Shadowgraphy was used to observe film and spray, liquid film frequency, wave velocity and wave deformation, primary breakup regime. Finally, a link between liquid film and the primary atomization are shown first qualitatively and after quantitatively.
Keywords
Atomization, liquid film, annular geometry, airblast, prefilming Introduction
One way to increase efficiency and reduce pollution in transport and energetic domains is designing fuel injectors with better atomization properties [1]. Prefilming airblast atomizers often used in gas turbine engines, offer advantages in terms of atomization quality over a wide range of fuel flow rates. Nevertheless, spray formation mechanisms due to the disintegration of a liquid film are still not completely known.
This type of injector is often studied in a planar geometry [1] [2] [3] because this is the simplest way to analyze the mechanisms of film dynamics and atomization experimentally. At the same time, studies on industrial configurations [4] have shown that the internal geometry of the injector influences strongly the process of atomization. To make experimental observations in the annular geometry is an enormous challenge. For that reason researchers often study liquid film [5] and the spray [6][7] separately. In this context, we propose an experimental study on the liquid film and the spray for a basic annular prefilming airblast.
The paper starts by presenting the experimental set-up designed at IMFT (Institut de Mécanique des Fluides de Toulouse). The destabilization and the atomization of the liquid film have been studied with high speed shadowgraphy method. Then the liquid film is characterized with its different regimes, frequencies of waves, wave velocities and wave deformations. Furthermore observations are made on the regimes of sprays, the possible dependence between the liquid regime and breakup modes. And to finish the preservation between conditions of film near the injector exit and the initial conditions about the primary atomization.
Experimental setup and metrology
The set up designed at IMFT is shown in figure 1. The geometry of the atomizer is cylindrical (D=34.5mm). The velocity of the air flow generated by a blower can reach 50 m.s-1 ± 0.5 m.s-1 (ReD = 100.000). The liquid (water)
passes inside a thin annular duct (= 500µm ± 20µm) located close to the wall of the cylinder (figure 1.b). A coordinate measure machine was used to verify tolerance on the thickness of the liquid duct. The velocity of the liquid is in the range [1.2 - 2.2 m.s-1] (± 0.03 m.s-1) corresponding to low Reynold numbers [600 < Re < 1120].
The length of the prefilming zone is 48mm and the atomizer is equipped with optical access (a glass cylinder) that allows the visualization of the liquid film (figure 1.b). To reduce turbulence 2 honeycombs are put before and after the convergent. After the honeycombs, a long tube (d=30 mm, L=90cm) is used to establish the air flow profile. The important parameters are resumed in table 1.
In order to characterize the mean air flow, a Pitot probe has been used to measure velocity profiles in four sections (figure 1.a): at a distance of 10cm before the injector (S1), at the injector inlet (S2) , at the beginning of the prefilming zone (S3) and at the end (S4). Whatever the section, the velocity profile is quite similar (figure 2). This result confirms that the tube is long enough for establishing the air flow. Hot wire measures (d=5µm) have been performed in section S4 (dots in figure 2) to obtain the mean turbulence ratio (6%). LDV measures are planned to complete information about turbulence. Their measures have been made without the liquid flow. The destabilization and the atomization of the liquid film have been studied with a high-speed camera (10 kHz) Phantom V20 (1280x800pixels). A continuous LED panel (2000mA, 10 x 10 cm) put in the background of the camera axis has been used for the backlight.
ILASS – Europe 2017, 6-8 Sep. 2017, Valencia, Spain
For the study two fields of view have been used. The first one, (field 1, red rectangle in figure 1.b) allows to observe the film destabilization). The size of field1 is LX=35.5mm (27.8µm/pixel) and LY=20.7mm (25.9µm/pixel). It
is located on the cylinder axis 8mm after the liquid injection.
The second field of view (Field 2, blue rectangle in figure1.b) is used for the simultaneous visualization of the end of the liquid film and the beginning of the atomization area. The size of Field2 is the same as Field1 but it can be noted that the spatial resolution will change slightly at the end of the film (the deformation induced by the glass tube disappears).
Figure 1. a) Experimental setup .b) Schema of the injector. Air velocity measurements are performed in four sections (S1, S2,
S3, S4), the red x is the origin (x=0, y=0).
Table 1 Main injector’s characteristics.
Dimension nomination Tube diameter 34.5mm D Liquid film thickness 500µm
Prefilming length 48mm Lp
Injector exit thickness The splitter separating the two phases
5.2mm 150µm
LA
Ls
Figure 2. Normalized mean velocity profiles without liquid flow. in sections S1,S2, S3,.S4 (figure 1.a)
Liquid film characteristics
The analysis of the film deformation was performed in the first field of view (Field1). Its purpose is to study the temporal and spatial evolution of the film structure along the prefilming zone (8mm after the liquid injection up to the end of the glass cylinder). More precisely the high velocity difference between the interface of the liquid film
x y
ILASS – Europe 2017, 6-8 Sep. 2017, Valencia, Spain
This work is licensed under a Creative Commons 4.0 International License(CC BY-NC-ND 4.0). EDITORIAL UNIVERSITAT POLITÈCNICA DE VALÈNCIA
and the main air flow generates surface waves that propagate and evolve (with time and space) along the cylinder.
The high-speed images allow the detection of the deformation of the liquid film interface. The more these deformations are important, the more the light of the LED panel will be deviated and the transmission will be attenuated. In the case of an important interface deformation (big surface waves) the transmission of the backlight vanishes and black zones appear in the images.
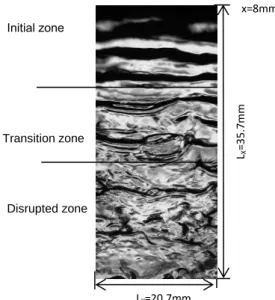
Figure 3 shows an instantaneous image of the liquid film obtained by shadowgraphy (Re=600, UG =40m.s-1). It
can be noted that no film dry-out was occurring during the experiments (i.e. in the range of Re and ReD
mentioned in experimental setup section). Three regimes of wave structure can be observed. The first one called "initial”, close to the liquid injection, reveals wide and quasi-periodic 2D waves. In this regime, the waves have little deformation. The third regime called “disrupted” near the injector exit, develops without specific spatial frequency and waves are 3D. The “transition zone” is observed when 2D waves become unstable and produce 3D waves with smaller scales (figure 3).
Figure 3 Instantaneous images of the liquid film (Field1) for Re=600 and UG=40m.s -1
(ReD=87,000)
To obtain the wave frequencies and wave velocities along the prefilming zone, the image processing is the same. A window centered on the axis of the cylinder is selected (-2mm<y< 2mm; 8mm<x< 43.7mm). The pixel values are averaged over the y-axis to obtain an axial mean profile of gray levels, P(x), on the total length of the Field1. 10,000 successive images (1 s) have been used to make sure that the statistics are converged. For x<20 mm, a quasi-periodic zone can be identified on P(x) (figure4).
Figure 4 Axial evolution of the gray level in the prefilming zone for UG=43m.s-1, Re=600. The red line delimits the quasi-periodic zone (x < 20mm).
The first post processing of the profiles, based on spectra analysis, was developed to study the wave frequencies. At a given location x, fast Fourier transforms are applied to the temporal evolution of P(x) (10000 values) and gives the power spectral density (PSD) (256 frequency values with step of 20 Hz). For UG=43m.s-1 and Re=600,
figure 5 shows the evolution of the power spectra for three axial locations (x = 10.7, 23.5, 35.7mm).
x=8mm Initial zone Transition zone Disrupted zone LY=20.7mm LX =35.7 m m
ILASS – Europe 2017, 6-8 Sep. 2017, Valencia, Spain
Figure 5 Power Spectra Density for UG=43 m.s -1
and Re=600 for 3 axial locations x= 10.7, 23.5, 35.7mm.
In the “initial zone” (x=10.7 mm) a well-pronounced peak appears around Fmax =600Hz and characterizes the
quasi-periodic structure detected on the images (see figure 4). Downstream (x=23.5mm, x=35.7mm) the initial structure of the liquid film is progressively lost and no significant peak can be detected. One may suppose that the initial waves correspond to the waves of maximum growth rate appearing due to Kelvin–Helmholtz instability on film surface. In the configuration studied by Alekseenko et al [5], a second peak has been observed in the power spectra, due to the presence of “disturbance waves” (not observed in the present study) Fmax increases quasi
linearly with UG (table 2). This result is in satisfactory agreement with the study of Alekseenko et al [5] carried out
with a lower liquid Reynold number (Re=400). Therefore the values of Fmax cannot be compared directly but the
comparison between both studies shows clearly the increase in Fmax with Reand ReD as Alekseenko et al [5]
observed. At this stage of the study, it is difficult to present the results in terms of Strouhal number (1).
Fmax L/UG (1)
Indeed, the choice of a length scale, L, is not obvious and different points of view can be found in the literature. Nevertheless, the results summarized in table 2 can be written in the form: St~14L, where L does not seem to depend on the air velocity UG, but depends probably of numerous parameters (liquid velocity [5], liquid properties
and injector geometry [8]).
Table 2 Maximal frequencies in the initial zone for different air velocities. Comparison with the results of Alekseenko et al [5]
Air velocity (m.s-1) Fmax (Re=600)(Hz) Fmax in Alekseenko et al [5]
(Re=400)(Hz) 48 675 550 43 625 460 40 550 410 33 507 320 27 390 270
The second post processing of the profiles, based on correlation analysis, was developed to calculate the liquid wave’s velocity. The axial profile P(x) was divided in several intervals of 5mm. For each interval, 1D correlations were calculated between time t and time t+t (t =0.2ms) to obtain the mean wave’s velocity Uwave(x) (figure 6).
Small deformations of the liquid film interface for the case UG=33m.s-1, limit the domain of measure to
x=18mm-43mm.
Figure 6 Axial evolution of wave velocity in the prefilming zone
for different air velocities, Re=600.
Figure 7 axial evolution of the correlation coefficient (Corr) in
ILASS – Europe 2017, 6-8 Sep. 2017, Valencia, Spain
This work is licensed under a Creative Commons 4.0 International License(CC BY-NC-ND 4.0). EDITORIAL UNIVERSITAT POLITÈCNICA DE VALÈNCIA
The mean initial liquid velocity of the liquid film (Re=600) is 1.2 m.s-1. The velocity profile of the liquid film is
strongly affected by the air velocity and after the 12 mm liquid injection the waves' velocity can reaches 1.9 m.s-1 for the highest air velocity. Moreover and whatever the air velocity, the waves' velocity increases with the axial distance. Indeed the main air flow accelerates the liquid film continuously from the liquid inlet up to the injector exit. Along the perpendicular direction to the glass tube, the local velocity of the liquid is probably affected by the air flow and the mean height of the liquid film could decrease with the axial distance, (liquid mass flow rate remaining constant).
Lastly, to quantify the progressive disintegration of the waves, a specific image processing based on spatial correlations was developed. From a first image (time t), a small window called W1(x,t) (X = 1mm; Y = 20.7mm)
was extracted at a given axial location x. On the next image (time t+t; t=1.5ms) a new window called W2(x+Xcorr, t+t ) was extracted at location x+Xcorr, Xcorr being given by (2) :
Xcorr = Uwave(x)*t. (2)
For every pair of images, the maximum value of the spatial correlation between W1(x,t) and W2(x+Xcorr, t+t ) is
calculated. 1000 pairs of images are used to obtain the mean correlation coefficient Corr(x). Because of weak luminosity near the liquid inlet Corr(x) is only calculated between 11mm and 40mm.
Figure 7 shows the axial evolution of the correlation coefficient. The results must be interpreted in connection with the three different regimes of the liquid film presented in figure 3. For low air velocity (33m.s-1), stable waves are detected in the initial zone and the value of Corr(x) is high (0.77) and almost constant up to x=22mm. An increase in the air velocity leads to a decrease in the spatial correlation coefficient, insofar as waves deform more quickly. When the air velocity increases from 40 m.s-1 to 48 m.s-1, the initial 2D periodic waves disappear more quickly. For UG = 33m.s-1, the “transition zone” begins around x=20 mm and the coefficient Corr(x) decreases
progressively from 0.8 to 0.45. A moderate increase in the air velocity (40 m.s-1), leads to a significant decrease of Corr(x). Indeed, the “transition zone” is located closer to the injection of the liquid film. Moreover Corr(x) drops sharply and takes the previous value (0.45) for x= 27 mm. Compared to the case UG= 33 m.s-1 Corr(x) reaches
this value later (x=43 mm). This result shows that a small increase in air velocity strongly modifies the structure of the liquid film. The “transition zone” and the “disrupted zone” become shorter and are moved upstream.
For the highest velocity (48 m.s-1), the curve's evolution is a slightly different. Corr(x) reaches a lower value (0.32
for x=32mm) but the value of the coefficient goes back to 0.4 near the injector exit. According to the work of Alekseenko et al [5] this could be due to the formation of “disturbance waves”. Additional measures will be necessary to confirm this hypothesis.
Atomization of the liquid film
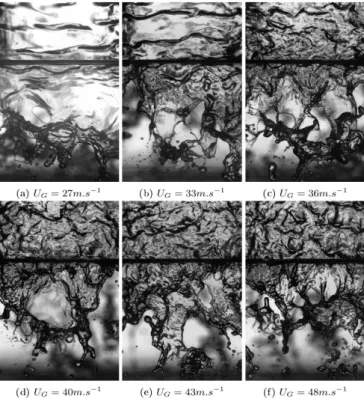
Figure 8 shows instantaneous images (Field2) for several air velocities (UG=27 m.s-1, 33 m.s-1, 36 m.s-1, 40 m.s-1,
43 m.s-1, 48 m.s-1), corresponding to Re
D in the [60,000 - 100,000]) and for the same liquid velocity (UL=1.2 m.s-1,
Re=600).
ILASS – Europe 2017, 6-8 Sep. 2017, Valencia, Spain
The dark zones visible in the background are due to the atomization of the liquid sheet on the other side of the injector. Specific post-treatments will be developed to remove these gray levels. But at this moment, only a qualitative analysis can be made on the primary atomization.
Numerous studies concerning the primary atomization of a liquid sheet without prefilming zone can be found in the literature ([1], [9], [10]) and with prefilming zone ([11], [2]). The experimental results concerning prefilming injectors are limited and the cylindrical configuration has been little studied.
Different breakup regimes can be observed. In the case of a planar liquid sheet, the first observations of the primary atomization regime and its physical analysis can be found in Stapper et al [12] and Park et al [13]. When air velocity is low (27-33 m.s-1), cellular breakup is detected with membranes and spanwise ligaments.For higher air velocities (from UG= 36 m.s-1 to 47 m.s-1), stretched ligament breakup is observed with bag-like
structure (figure 9) and longitudinal ligaments. In the configuration of the present study, the viscous effects are weak (Ohnesorge number is in the order of 0.005). On the other hand, in the investigated range of air velocity, the Weber number (3) based on the initial thickness of the liquid film is between 5 and 18.
We = G..UG-UL)2/ (3)
Therefore, the process of secondary breakup is expected to appear after the destabilization of the liquid sheet.
Both regimes can be found in the study of Fernandez et al [14], in the case of a planar liquid sheet. Research is in progress to detect the edge of the liquid sheet and study the decrease of the break up length during air velocity increase. To study the transition between both regimes, Fernandez et al [14] and before them Lorenzo et al [15] have introduced the MFR parameter (for Momentum Flux Ratio) (4), to compare the momentum flux ratio between the gas and the liquid.
MFR = (G.UG²)/(L.UL²) (4)
The regime transition is observed for MFR ~ 1; it’s rather close to the value obtained by Fernandez et al [14] (MFR~0.5). The difference could result from the air flow which shears only a side of the liquid film, contrary to the study of Fernandez and al.
As the film and the spray are observed together, it is possible to make the link between the structure of the liquid film and the regimes of atomization.
When the liquid film is in "initial regime", primary atomization is dominated by the cellular breakup mode. If the end of the film is in the “disrupted regime”, the predefined atomisation regime is in the mode “stretched ligament breakup”.
Figure 9 Zoom of a bag break structure.
But as the atomization regime depends on the air velocity, it is difficult to know if the liquid film regime changes the primary break up mode.
To make the link between the liquid film and the primary atomization, we compared the structure of the liquid film to the injector exit with the initial structure of the liquid sheet.
For this, the correlation coefficient (Corr) defined previously can be used with some modifications. Now three windows called W1, W2, W3 (1mm x 20.8mm) are needed (figure 10a): W1 and W2 are located in the prefilming
zone at x1= 43.9mm and at x2=46.6mm respectively. W3 is located after the injector exit (x3=49.3mm) at the
beginning of the liquid sheet. The distance between each window is the same (2.7mm).
Figures 10.b and 10.c show zooms (1mm x 5mm) of the same wave in each three windows. An image processing was made on W1 and W2 to correct the effects of curvature due to the glass cylinder.
From the three windows, two correlation coefficients can now be calculated: Corr1-2 and Corr2-3 corresponding to
the maximum value of the spatial correlations between the pairs [W1, W2] and [W2,W3] respectively (10000
images are used).
Figure 11, shows the evolution of both correlation coefficients (Corr1-2 and Corr2-3) for different air velocities.
Corr1-2 provides the level of spatial correlation for a displacement of the liquid film of 1.7mm and can be used as a
“reference” inside the liquid film. Corr2-3 characterizes the loss due to the rough change in the conditions of the
liquid flow at the injector exit.
Corr1-2 decreases for the air velocity range [27 m.s-1– 33 m.s-1] and becomes stable around 0.4 for higher air
ILASS – Europe 2017, 6-8 Sep. 2017, Valencia, Spain
This work is licensed under a Creative Commons 4.0 International License(CC BY-NC-ND 4.0). EDITORIAL UNIVERSITAT POLITÈCNICA DE VALÈNCIA
figure 7 (x=40.7mm). The coefficient Corr1-2 and Corr2-3 follows the same trend, but the values of Corr2-3 are 20%
lower. A first analysis of the instantaneous images (figure 10) indicates that the structure of the film near the injector exit remains still present beyond this zone (i.e. in the first millimeters of the liquid sheet).
a) Schema (this model is not to size) b) UG= 27m.s -1 c) UG=48m.s -1 1) 1) 2) 2) 3) 3)
Figure 10 a) Schema of each window’s position. Zoom of a wave for an air velocity of 27 m.s-1
(b) and 48 m.s-1 (c). Each pitures are separated by 2.7mm. Pictures 1,2 are inside the prefilming zone and 3 are outside (Window size: 1mm x 5 mm)
Nevertheless it is normal that Corr2-3 is smaller because the liquid flow is not forced anymore to adhere to the wall
of the tube. 3D displacements can occur in the liquid sheet.
Figure 11 Evolution of the correlation coefficient (Corr1_2, Corr2_3) in function of air velocity, black line with triangle is for the correlation inside the prefilmer, and the red line is between the prefilmer and the liquid sheet.
Another possible explanation is given by Koch et al [16]: a liquid accumulation at the end of the glass tube could modify the structure of the film before the liquid sheet. In spite of this effect, liquid waves are preserved after the injector exit (figure 10) and will play a role in the primary atomisation process.
Conclusion
Experiments were performed on a prefilming airblast atomizer designed at IMFT to visualize the liquid film and the primary atomization together using high-speed imaging.
Concerning the liquid film different regimes of wave structure can be observed. The first one called "initial”, close to the liquid injection, reveals wide and quasi-periodic 2D waves. The second regime called “disrupted” near the injector exit, develops without specific spatial frequency and waves are in 3D shape.
An image processing, based on spectra analysis, was developed to study both the frequencies and the velocity of the waves. In the “initial zone” a well-pronounced peak appears around Fmax =600Hz and Fmax increases quasi
linearly with UG
Whatever the air velocity, the wave velocity increases with the axial distance as the main air flow accelerates the liquid film continuously from the liquid inlet up to the injector exit.
To quantify the progressive disintegration of the waves, a specific image processing based on spatial correlations (coefficient Corr) was developed. For low air velocity, stable waves are detected in the initial zone and the value of Corr(x) is high. A small increase in air velocity strongly modifies the structure of the liquid film and the coefficient Corr(x) drops sharply. The “initial zone” becomes shorter and the “transition zone” and the “disrupted zone” are moved upstream.
Concerning the spray different breakup regimes have been observed: cellular breakup with membranes and spanwise ligaments (low air velocity) and stretched ligament breakup with bag-like structure and longitudinal ligaments (high air velocity).
To make the link between the liquid film and the primary atomization, the analysis based on the coefficient of correlation (Corr) was extended to the zone of primary breakup.
ILASS – Europe 2017, 6-8 Sep. 2017, Valencia, Spain
The results clearly show that the structure of the liquid film at the outlet of the injector remains still very present in the primary atomization zone in terms of local and instant thickness of the liquid sheet.
The work will be continued by improved post-treatment to reduce the atomization in the background to obtain quantitative atomization characteristics.
Acknowledgements
Authors want to acknowledge the federation FERMAT (Fluides, Energie, Réacteurs, Matériaux et Transferts), for the optical diagnostic material.
Nomenclature x axial direction y transvers direction D injector’s diameter [m]
height of liquid film [m] UL liquid velocity [m.s-1]
UG gas velocity [m.s-1]
surface tension [N.m-1]
viscosity [Pa.s]
Uwave wave velocity [m.s-1]
Re liquid Reynold number
ReD air Reynold number
Fmax frequency maximal [s-1]
t time step[s]
Xcorr spatial step[m]
Corr correlation coefficient MFR Momentum flux ratio We Weber number Oh Orhnesorge number References
[1] Lefebvre A. H., 1989, "Atomization and Sprays."
[2] Déjean, B., Berthoumieu, P., Gajan, P., 2016, International Journal of Multiphase Flow, 79, pp. 214-224. [3] Warncke, K., Gepperth, S., Sauer, B., Sadiki, A., Janicka, J., Kock, R., Bauer, H.-J., 2017, International Journal of Multiphase Flow, DOI: 10.1016/j.ijmultiphaseflow.2016.12.010.
[4] Gepperth, S., Bärow, E., Koch, R., Bauer, H.-J. Bauer Sep 2014, 26th Annual Conference on Liquid Atomization
and Spray Systems.
[5] Alekseenko, S. V., Cherdanstev A. V., Cherdantsev, M. V., Isaenkov, S. V., Markovich, D. M., 2015, International Journal of Multiphase Flow , 77, pp.65-75.
[6] Han, Y.M., Seol, W. S., Lee, D. S., Yagokin, V. I., Jeung I.S., 2001, Journal of Engineering for Gas Turbines and Power, 123(1), pp. 33-40.
[7] Matas, J., Hong, M., Cartellier, A., 2014, Physics of Fluids, 26(4), 042108.
[8] Agbaglah, G., Chiodi, R., Desjardins, O., 2017, Journal of Fluid Mechancis, 812, pp1024-1038. [9] Carvalho,I., Heitoyr, L.V., Santos, 2002, International Journal of Multiphase Flow,28 (5), pp773-789. [10] Dumouchel, C., 2008, Experiments in fluids, 45 (3), pp 371-422.
[11] Gepperth, S., Müller, A., Koch, R., Bauer, H.-J. Bauer Sep 2012, 12th Triennial Conference on Liquid Atomization and Spray Systems.
[12] Stapper, B., Sowa, W. Samuelsen, G.S., 1992, Journal of Engineering for Gas Turbines and Power, 114(1), pp39-45.
[13] Park, J., Huh, K., Li, X., Renksizbulut, M. 2004, Physics of Fluids, 16(3), pp625-632.
[14] Fernandez, V.,G., Berthoumie, P., Lavergne, G., 2009, Comptes Rendus Mecanique, 337(6-7),pp 481-491. [15] Lozano, A., Barreras, F. 2001, Experiments in Fluids, 31(4), pp367-376.
[16] Koch, R., Braum, S., Wieth, L., Chaussonnet, G., Dauch, T., Bauer, H.,J., 2016, International Symposium on Transport Phenomena and Dynamics of Rotating Machinery.

![Table 2 Maximal frequencies in the initial zone for different air velocities. Comparison with the results of Alekseenko et al [5]](https://thumb-eu.123doks.com/thumbv2/123doknet/14284253.491951/6.892.130.759.654.789/maximal-frequencies-initial-different-velocities-comparison-results-alekseenko.webp)