Publisher’s version / Version de l'éditeur:
Vous avez des questions? Nous pouvons vous aider. Pour communiquer directement avec un auteur, consultez la première page de la revue dans laquelle son article a été publié afin de trouver ses coordonnées. Si vous n’arrivez pas à les repérer, communiquez avec nous à PublicationsArchive-ArchivesPublications@nrc-cnrc.gc.ca.
Questions? Contact the NRC Publications Archive team at
PublicationsArchive-ArchivesPublications@nrc-cnrc.gc.ca. If you wish to email the authors directly, please see the first page of the publication for their contact information.
https://publications-cnrc.canada.ca/fra/droits
L’accès à ce site Web et l’utilisation de son contenu sont assujettis aux conditions présentées dans le site LISEZ CES CONDITIONS ATTENTIVEMENT AVANT D’UTILISER CE SITE WEB.
Paper (National Research Council of Canada. Institute for Research in
Construction); no. IRC-P-1364, 1986
READ THESE TERMS AND CONDITIONS CAREFULLY BEFORE USING THIS WEBSITE. https://nrc-publications.canada.ca/eng/copyright
NRC Publications Archive Record / Notice des Archives des publications du CNRC : https://nrc-publications.canada.ca/eng/view/object/?id=39564c32-218c-417b-aebf-99ace568e60e https://publications-cnrc.canada.ca/fra/voir/objet/?id=39564c32-218c-417b-aebf-99ace568e60e
NRC Publications Archive
Archives des publications du CNRC
This publication could be one of several versions: author’s original, accepted manuscript or the publisher’s version. / La version de cette publication peut être l’une des suivantes : la version prépublication de l’auteur, la version acceptée du manuscrit ou la version de l’éditeur.
For the publisher’s version, please access the DOI link below./ Pour consulter la version de l’éditeur, utilisez le lien DOI ci-dessous.
https://doi.org/10.4224/40001817
Access and use of this website and the material on it are subject to the Terms and Conditions set forth at
Field measurements of soil thermal conductivity
Ser
TH1
National Research
Conseil national
N21d
I
$
Council Canada
de recherches Canada
no,
1364
c. 2
Institute for
lnstitut de
BIJlG
Research in
recherche en
-- - -
Construction
construction
Field Measurements of Soil Thermal
Conductivity
by L.E. Goodrich
Reprinted from
Canadian Geotechnical Journal
Vol. 23, No. 1, 1986
p.
51
-
59
(IRC Paper No. 1364)
Price $2.00
NRCC 25848
NRC
-
C I mBtffi.
RES.
Field measurements of soil thermal conductivity
L. E. GOODRICHDivision of Building Research, National Research Council of Canada, Ottawa, Ont., Canada KIA OR6
~eceived February 18, 1985 Accepted October 2, 1985
Data representing the seasonal variation of thermal conductivity of the ground at depths within the seasonally active freezinglthawing zone are presented for a number of different soil conditions at four sites across Canada. An inexpensive probe ..-apparatus suitable for routine field measurements is described.
In all the cases examined, significant seasonal variations were confined to the first few decimetres. In addition to distinct seasonal differences associated with phase change, quite large changes occurred during the period when the soil was thawed in
-- those cases where seasonal drying was possible. Below the seasonally active zone, thawed soil conductivities did not differ greatly among the three nonperrnafrost sites in spite of soil composition ranging from marine clay to sandy silt. The data suggest that, even within a given soil layer, quite significant differences in thermal conductivity may be encountered in engineering structures such as embankments, presumably because of differences in drainage conditions.
Key words: thermal conductivity, field measurements, phase relationships, drying, permafrost, clay, silt, peat.
On presente des donnCes sur la variation saisonnikre de la conductivie thermique du sol au niveau de la couche active gelldkgel pour diverses conditions du sol a quatre endroits differents au Canada. On dCcrit Cgalement un appareil de mesure de con-
I ductivit6 des sols qui, tout en Ctant peu coateux, convient bien aux mesures sur le terrain.
Dans tous les cas CtudiCs, les variations saisonnikres furent importantes seulement dans les premiers dkcimetres de sol. En plus
1
des differences saisonnikres marquCes associCes au changement de phase, on a constate d'importantes variations durant la p6riode au cours de laquelle le sol Btait dCgelt dans les cas oh les conditions permettaient un asdchement saisonnier. Mais, en profondeur, les valeurs Btaient assez semblables i trois des sites, malgrk des diffkrences de composition allant de l'argile marine aux limon sableux. Les donnees suggkrent que, memea
I'intkrieur d'une couche de sol donnBe, des differences marquees de conductivitk thermique peuvent etre observkes dans des ouvrages comme des remblais, vraisemblablementa
cause de diffkrences dans les conditions de drainage.Mots clks: conductivitC thermique, mesures en nature, relations entre les phases, stchage, pergClisol, argile, limon, tourbe.
1
Can. Geotech. I. 23, 51-59 (1986) IntroductionThe thermal regime of the ground around engineering struc- tures o r beneath natural surfaces is affected to an important degree by the thermal properties of the soil. For engineering design calculations, heat capacity and Iatent heat can usually be estimated with adequate precision from a knowIedg of soil densities and moisture content. These same parameters (along with soil classification information) are generally used to estimate thermal conductivities for both thawed and (fully) frozen soil from approximate empirical formulae such as those
1
of Kersten (1949) or, more recently, those of Johansen (1975).'
For a given soil layer it is usual to assume that moisture and density are uniform. In addition, in most engineering problems , it is supposed that moisture content does not change with time, and frequently that the phase composition of the soil water, and hence the thermal conductivity, does not depend on tempera-'
ture, for temperatures below freezing. The question "To what extent does such simplification represent the true behaviour in the field?'needs to be asked. Measurements of thermal con- ductivity provide some insight into the matter since conductivity is dependent on all the above factors.
With the advent of modem electronic equipment it is possible to significantly reduce the labour required to make a single soil conductivity determination using the transient probe rnethcd; thus it is now practical to envisage in situ monitoring involving
, several hundred determinations. This study describes the results of several years of field measurements made in and around
I
shallow embankments in permafrost and in seasonal frost conditions.
Theory
The theory of the transient thermal conductivity probe is so well known that only the essential results will be mentioned
here. The reader may consult Wechsler (1966) for a more complete exposition and survey of the original literature. More recent works contain complete discussions relating to thermal properties of soil as well as extensive references (Johansen
1975; Farouki 1981).
For an infinitely long line heat source of strength Q l l (powerllength) embedded in an initially isothermal infinite homogeneous medium, after sufficient time the temperature T becomes approximately proportional to the logarithm of time: [I] T = - in t
+
constant4.irl.k
where t is the time and k is the thermal conductivity of the medium.
For real cylindrical thermal conductivity probes, factors such
as
the nonnegligible heat capacity of the probe, its finite length, and the existence of a contact resistance between the probesurface and the test medium all modify the thermal response,
Nevertheless, for an appropriately designed device within a limited intermediate time span, the form of [I] remains valid and the conductivity can be determined as if the probe were an ideal line heat source; only the slope of the curve of temperature versus logarithm of time is used in the calculation.
More serious deviations from ideal behaviour occur when the apparent thermal properties of the medium are not constant during the measurement period or are not homogeneous over the
appropriate spatial scale. This is the case in, for example, fine- grained soils at temperatures only slightly below the onset of freezing where thermal conductivity depends strongly on phase composition of the soil water and hence on temperature. Also, in unsaturated conditions in soils of intermediate to coarse grain size, moisture migration can occur owing to the imposed
52 CAN.
I
I
. 6 - C O N D U C T O R S H I E L D E D 4 - B I R E C I R C U i T " L E A D C A B L E W I T H N O FOR THERMI 5 T O R B E L O W G R O U N D S P L I C E S F E N W A L G A 4 2 J l GEOTECH . , VOL. 23, 1986 I 1 S A T U R A T E D 1 O T T A W A S A N D e--1FDA C L A Y ,, DRY O T T A W A S A N D//,
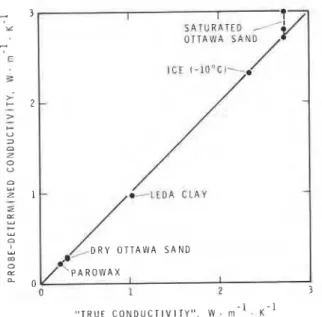
' P A R O W A X I " T R U E C FIG. 2. Comparison of determinations. 1 2 O N D U C T I V I T Y ~ , W . m - ' probe determinations . K - 1 withv
lt-I
3 rnmFIG. 1. Thermal conductivity probe construction.
temperature gradient. In gravels, convection may perturb the measurements, and for all soils, a nonconstant contact resis- tance will lead to difficulties. In the field, problems may arise if ambient temperature gradients are excessive or, more impor- tantly, if ambient temperature levels change significantly during the measurement period. Fortunately, in such cases violations of ideal behaviour manifest themselves as deviations from linearity in the temperature response and such data can easily be detected and eliminated.
Apparatus
With the exception of one site (Inuvik) the probes used in this study consisted of a stainless steel tube 118 in. (-3 mm) in diameter by 20 in. (-50cm) long containing a bifilar wound constantan heater coil. A glass bead thermistor, mounted inside the cylindrical heater coil at mid-length, was used as temperature sensor. An acrylic plastic casting resin was used both as a
potting compound to fill the probe barrel and to form a head enclosing soldered connections to the lead wires. Construction details are indicated in Fig. 1. The probes used at the Inuvik site were of the type described in Slusarchuk and Foulger (1973). Thermistors were chosen as temperature sensors because their sensitivity is greatly superior to that of thermocouples. Using 5f digit multimeters (readily available even in portable field instruments), temperature changes of a few millikelvin are easily detectable. This makes it possible to operate the probes using very low power levels, thus reducing troublesome gradients near the probe and diminishing the deleterious effects of moisture transport. In addition, it then becomes possible to make conductivity determinations at negative temperatures much nearer the freezing point.
To verify the accuracy of the probe, comparisons were made between guarded hot plate measurements, measurements made using a commercially available needle probe, and literature values for several materials spanning the range of usual soil
FIG. 3. Portable field probe electronics: HP41CV pocket calculator, HP3468A digital voltmeter, HP82162A printer, HP82161A cassette recorder. Power Sonic PS6200 rechargeable battery pack, heater switch box, and probes made by NRCC.
thermal conductivities. The guarded hot plate measurements were performed at the National Research Council Canada (NRCC) using equipment and procedures conforming to ASTM standard C177-76 and are expected to be correct within a few percentage points. The needle probe is an 8.5 in. (2 1 cm) long by 0.020 in. (0.5 mm) diameter probe available from Custom Scientific Co. The results (Fig. 2) indicate that, in contrast to the probe of Slusarchuk and Foulger (1973). the present probe does not require systematic correction to yield accurate values of conductivity. New probes are nevertheless routinely tested to
p a r d against errors in manufacture. Both paraffin wax and
desired water frozen uniaxially to minimize entrapped air have proven convenient as standard test media.
During the course of the field measurements, a number of different configurations of electronic readout equipment was used. The most current apparatus is made up from portable, battery-operated, "offthe shelf' components including a digital multimeter, a printer capable of simple graphics, and a hand- held programmable calculator with integral digital clock. A
V . " -
J A N F E B M A R A P R M A Y J U N E J U L Y A U G S E P T O C T N O V D E C
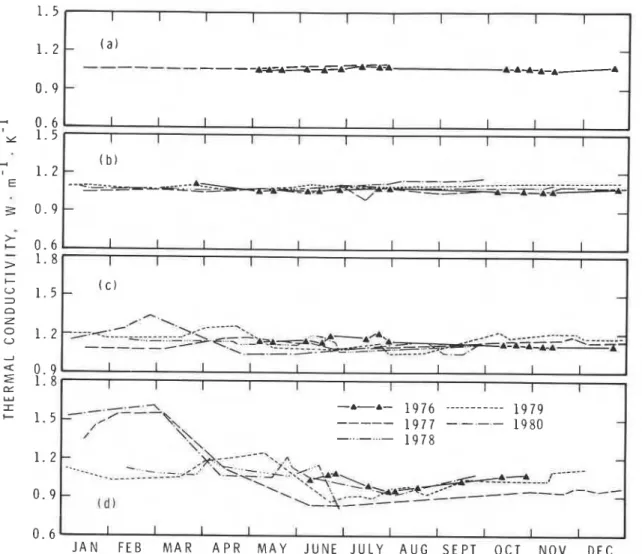
FIG. 4. Seasonal variation of thermal conductivity-Ottawa, natural terrain: (a) 130 cmclay; ( b ) 100 cmclay; ( c ) 40 cmclay; (d) 10 cm organic layer.
voltage source with switch-selectable output levels operating from sealed lead-acid batteries is used to power the probe heater. This equipment configuration was chosen in preference to a dedicated-microprocessor-based apparatus for reasons of economy, flexibility in application of the same equipment to other field measurements, and ready availability of service. Figure 3 shows the apparatus, mounted in metal carrying cases, and includes manufacturer's part numbers.
The programme written for the hand-held calculator includes subroutines to perform the following operations:
(a) timing (a logarithmic time base is used), voltmeter con- figuration, selection of constants associated with a given probe, , and other bookkeeping operations and preliminary computa-
tions;
(b) data logging and resistance-temperature conversion (converted values are printed and stored in memory registers for subsequent analysis);
(c) "line printer" type plot of temperatures vs. reading number (proportional to logarithm of time). This is useful in selecting the most linear portion of the data;
(d) linear regression including regression statistics to calculate the slope of the curve of temperature vs. logarithm of time with options to deletelrestore data points and to perform regression on any segment of the data;
(e) computation of conductivity value.
The calculator has sufficient memory to allow 8 sets of probe
constants to be included in the programme and up to 50 sets of data points to be stored in memory registers without recourse to peripheral storage. As the calculator possesses a nonvolatile memory, the programme need never be reloaded and can remain available for immediate use at all times.
This equipment is straightforward to use and, after installation of the probe itself, approximately 15-20 min is required for each conductivity determination, including analysis. Some subjective judgement may be required to discriminate good from bad data in marginal cases but, generally, a good linear response is obtained and the data can be analyzed directly with confidence.
In this study, probes were emplaced wherever possible in predrilled holes in the walls of trenches dug after construction. In the gravelly materials it was necessary to bury the probes in small pits with the material replaced and compacted by hand. In some cases the probe barrel was coated with a layer of bentonite to reduce contact resistance. It was also found necessary to suppress ambient temperature changes during and some time prior to the measurement period for probes placed at shallow depths. Thermal gradients, which could, in principle, also perturb measurements, were reduced as well.
Although in a few cases it was possible to measure dry density and moisture content of the soils at the time the probes were emplaced, this data is of limited value and has not been presented, since no subsequent measurements were made to
CAN. GEOTECH. J. VOL. 23, 1986
0 . 3
J A N F E B M A R A P R M A Y J U N E J U L Y A U G S E P T O C T N O V D E C
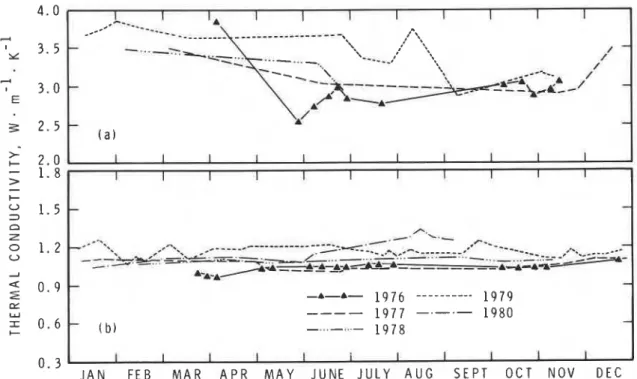
FIG. 5. Seasonal variation of thermal conductivity-Ottawa, test road: (a) 18 cm gravel; ( b ) 125 cm clay.
indicate the seasonal variations of moisture content. In the future, moisture content will be measured simultaneously with thermal conductivity using a combined probe based on the time-domain reflectometry technique.
Results
Figure 4 shows measurements taken over a 5 year period at a natural terrain site on the NRCC grounds at Ottawa. The site is an open grass-covered field comprising a thin top soil zone underlain by Leda clay to a depth of 20 m or more. As expected, the greatest variation in thermal conductivity occurs closest to the surface. The data at 130cm (Fig. 4a)' showed almost no variation throughout the (brief) period the probe was in service. The reproducibility of consecutive measurements is of the order of 2-3%, well below the 5-10% estimated overall accuracy of the method.
At the 100 cm level (Fig. 4b), consecutive values again differ only slightly, but there is a barely discernable seasonal maximum in autumn with a minimum in late winter super- imposed on a trend to slight long-term increase during the measurement period.
At the 40cm level (Fig. 4c) somewhat greater variations occurred, and the data suggest that changes of up to about 10-15% occurred on occasion over periods of a few weeks to several months. The greatest variation is seen in the values for the top soil (Fig. 46). Thawed soil conductivity ranges from a minimum 0.8 W .m-
'
. K -'
in midsummer to a maximum 1.2 W-
m-'
K-'
during the spring. This behaviour is consistent with expected seasonal changes in moisture content. The largest values occurred during two of the winter periods. However, during the 1979 winter, conductivity did not show the expected maximum even though the soil was frozen. An examination of the associated soil temperature records rules out the possibility 'Depths given on this and subsequent figures indicate depth of probe emplacement.that this was due to temperature dependence; nearly identical ambient temperatures were measured during 1979 and 1977. The top soil may have been considerably drier than usual during the autumn of 1978. Unfortunately, no reliable data were obtained during this period because of instrumentation problems.
Seasonal conductivity changes presumably can be related to changes in total water content (summer) or unfrozen water content (winter). Although soil moisture measurements were not included in this study, the annual range expected is from 10 to 60% (per unit weight) near the surface, diminishing to a nearly constant value of 40% at 1 m depth, based on measure- ments made by Crawford (1961) over a number of years at a nearby site.
Figure 5 shows data measured within and beneath a nearby test road. The road consisted of a 3 in. (-7.5 cm) asphalt pavement, 7 in. (-18 cm) gravel layer, 2 in. (-5 cm) poly- styrene insulation, and a thin sand bedding layer placed directly on undisturbed Leda clay. The surface of this test road was constructed nearly flush with the surrounding original ground and no ditches were present. The probes used have frequently been found to perform poorly in gravel. Often a clearly defined linear response is not obtained and conductivity values cannot be calculated unambiguously. In addition, precautions must be taken to reduce ambient temperature changes for probes at shallow depths. Well over half the data were rejected in constructing the curve for gravel in Fig. 5a. The remaining data suggest that relatively large short-term and year-to-year varia- tions occur during the summer, whereas autumn and winter values tend to be similar in all years.
Measurements made at 125 cm depth (Fig. 5b) in the under- lying clay give a mean value for all years of 1.1 W em-
'
.
K-'.
Essentially the same value was found for all three levels in the clay at the natural terrain site (Fig. 4). The long-term variation, however, is substantially greater at the road site than for a similar depth at the natural terrain site. A plausible explanation
2 . 1 1. 8 2 . 4 2 . 1 1 . 8 1 . 5 J A N FEB M A R A P R M A Y J U N E J U L Y A U G S E P T O C T N O V I I I I I CENTER L I N E
-
---
S H O U L D E R -...- I N S U L A T E D ( F R O Z E N ) -- - - -
-- - - -
-.
I N S U L A T E D ( T H A W E D )-
-.- .- U N I N S U L A T E D ( F R O Z E N )--*-
U N I N S U L A T E D ( T H A W E D )-
--/----
--
-
-/-
1 I I I I 1 I I I I I 1 I I I I I I I 1 ( b )-
/ /'-
__---
-
b
4
'
-
r I I I I I I I I I I I1
- _
( C ) I-
-
-
7
,
'
I
?
-
I 1 I 1 I I I I I I I 1 I I I I I I I 1 ( d )-
r.,
i
i"..\...
:-
-.&:-
y..i
{
-
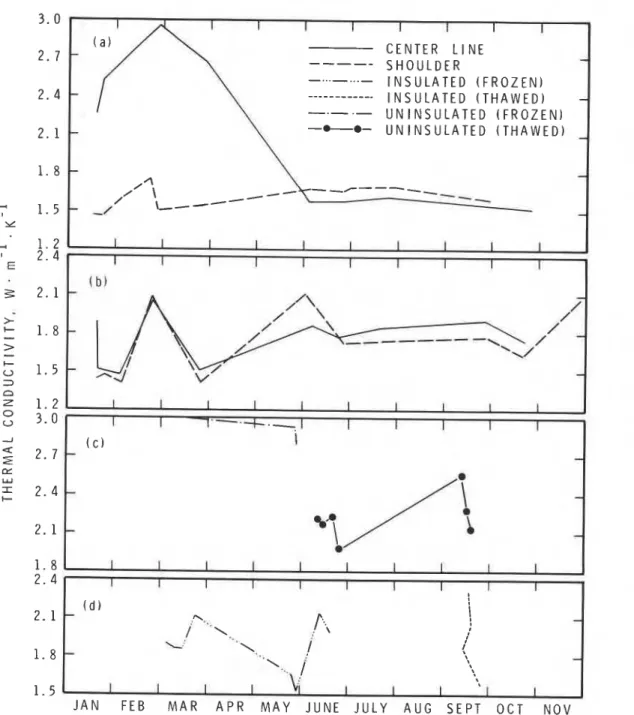
I I I I I I I I IFIG. 6. Seasonal variation of thermal conductivity-road embankment, N.W.T.: (a) 60 cm sand, Ft. Wrigley; (b) 104 cm sand, Ft. Wrigley; ( c ) Inuvik, uninsulated; (d) Inuvik, insulated.
may lie in the different drainage conditions at the two sites: the natural terrain site was located in a lower, wetter area, whereas somewhat better drainage was possible beneath the roadway.
Figures 6a and 66 present data from a shallow road embankment composed of granular materials, with grain size ranging from sand to cobbles. The embankment is on the Mackenzie Highway near Ft. Wrigley, N.W.T., and is under- lain by warm permafrost. Although it was only possible to visit the site and carry out measurements about four times a year, the conductivity values were generalEy consistent from one season to the next. The curves in Figs. 6a and 6 b are a composite of
data for all years. While the shallow centre line data show a distinct seasonal trend, with frozen soil values nearly twice the thawed soil values, at the same level beneath the road shoulder there is relatively little difference between winter and summer
values, although winter values are generally lower than summer ones. This behaviour is consistent with the moisture distribution that might be expected in an embankment composed of permeable material. The magnitude of the difference between centre line and shoulder conductivity values is, however, much greater than what is generally assumed, for example when thermal properties are estimated for design calculations.
Results from two test sections on a second shallow embank- ment, also on the Mackenzie Highway, are shown in Figs. 6c
and 6d. The sites, located at Inuvik, N. W .T., are underlain by cold permafrost. One of the test sections was insulated and comprised 18 in. (-45 cm) of gravel, 34 in. (-9 cm) of poly- styrene insulation, and 12 in. (-30 cm) of gravel placed directly on the natural terrain (silty clay beneath a thin organic surface). The uninsulated section consisted of 3 ft (-90cm) of gravel
56 CAN. GEOTECH. J. VOL. 23. 1986
0 . 6
J A N F E B M A R A P R M A Y J U N E J U L Y A U G S E P T O C T N O V D E C
FIG. 7. Seasonal variation of thermal conductivity -gravel pad, Thompson, Man.: (a) 20 cm gravel; (b) 75 cm gravel
placed directly on the original ground surface. The gravel was of poor quality, contaminated with sand and silt, as is frequently the case in this area. While data from both sites show consider- able scatter, especially in the early autumn values, the principal trend is clear. The uninsulated site exhibits distinct summer and winter values, while beneath the insulation there is no such trend. In addition, with one or two exceptions, insulated section values are lower than uninsulated section values throughout the year. This behaviour is consistent with a moisture content beneath the insulation significantly lower than that in the uninsulated embankment.
Data from a large, very shallow (-30-60 cm thick) gravel pad located on degrading permafrost at Thompson, Manitoba, are shown in Fig. 7. This pad is only slightly elevated above the original ground surface and so would be expected to remain wet for a considerably greater part of the thaw season, compared with the Mackenzie Highway embankment sites. Nevertheless, in contrast to the relatively constant summer values seen in the shallow data from Ft. Wrigley (Fig. 6a), at the Thompson site the 20cm level data exhibit a marked decreasing trend from about 2W.m-'.K-' in spring to near 1.3 W . ~ - ' . K - ' ~n ' the autumn. The winter behaviour at the 20cm level is just the opposite, with values increasing from mid-winter to spring. Contrary to expectations, values for frozen gravel are, for the most part, smaller than for thawed gravel. Very similar data were also obtained at an adjacent site covered with an asphalt pavement (data not shown). In contrast to the shallow depth, at the 75 cm depth, where moisture content is presumed to be relatively invariant, the conductivity shows a distinct bivalued seasonal variation, with the winter value about 50% greater than the summer value.
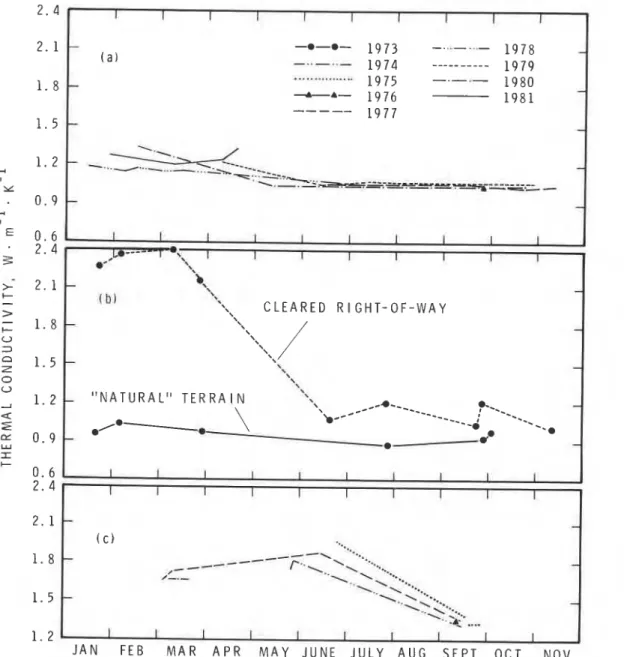
Several probes were also installed at various depths up to about 1.5 m in the natural subgrade at Thompson, Ft. Wrigley,
and Inuvik. Soils were classified as clay at Thompson, silty clay at Inuvik, and sandy silt at Ft. Wrigley. Figure 8 shows subgrade data from one of six probes at Thompson, two of four at WrigIey, and one of two at Inuvik. At Thompson the conductivity values exhibited little systematic variation during the thaw season. The data, although sparse, suggest a similar pattern for Ft. Wrigley. At Inuvik thawed soil data were limited to measurements made during the same month (September); the values are nearly identical (1.35 W.m-' .K-I), suggesting that here, too, there may be tittle tirnewise variation in thawed soil conductivity. Four out of six probes at Thompson yielded thawed soil conductivities in the range 0.95-1.15 Wdm-
'
.K-',
a range very similar to that found in the Leda clay at Ottawa. Two other probes installed in nominally similar material, but at a site that showed greater evidence of melting, exhibited similar seasonal behaviour, but the thawed soil values were in the range 1.2-1.35 W .m-'.K-'. The natural terrain site at Wrigley yielded values of 0.9- 1.0 W.m-'.K-'.
On the cleared right-of- way, values were only slightly higher, in the range 1.05-1.2 W am-.K-' .
Thus, although there were some differences ingrain size and mineral composition, actual field values of
thawed soil conductivity all lie in the range of 0.9-1.35 W.rn-'.K-' and no marked trends associated specifically with grain size are evident; they are presumably masked by com- pensating differences in moisture content.
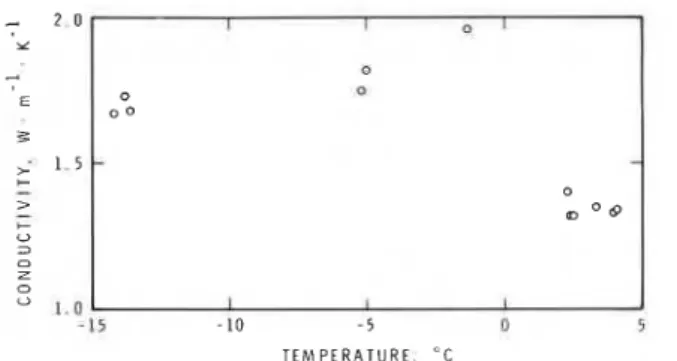
At the Thompson sites the apparent frozen soil conductivity values showed a very much greater variability than the thawed soil values. A trend to higher frozen soil values in spring is seen in Fig. 8 for both the Thompson and Inuvik sites. Figure 9 shows
a marked variation of apparent measured conductivity with (negative) temperature ar the Thompson site. It is not wholly certain that this apparent temperature dependence represents the
GOODRICH 2 . 4 1 . 2 J A N F E B M A R A P R M A Y J U N E J U L Y A U G S E P T O C T N O V I I I I I 1 I I I I -. -@- 1 9 7 3 .*- 1 9 7 8
-
( a ) -..-..- 1 9 7 4 --- 1 9 7 9. .
, , ,... .
.... . .. 1975-
1 9 8 0-
--.--A- 1 9 7 6 1 9 8 1---
1 9 7 1-
\--.
I
--
..- . + . . .-
---,-
---;.a-., - - - * - \. c---
I . - * + E - w Y - - ~ ~ - ~ . = _-
-
I I I I I 1 I I I I----
m*'L'
-'\
1 I I I I I I b,,-
( b ) '*'.,
C L E A R E D R I G H T - O F - W A Y'.
-
',
-
\', " N A T U R A L " T E R R A l N 1' \ /4----
\
'b/*------
---
----i ?--..- *--.@I@---*
-'a-
-*.
-
I 1 I I I I I I I I I I I I I I I I I I-
( c ) ---+\ *...h 1, .-.,*-
,-
---
I-.- /-'.+..
,
-% ..*,*. " -. . , ' , *. *%.,-
..-+
>...-
-
...-$*.** 1 I I I I I I 1 I I IFIG. 8. Seasonal variation of thermal conductivity at subgrade level: ( a ) 112 cm clay, Thompson; ( b ) 50 cm organic sandy silts, Ft. Wrigley
1
(cumulative readings); ( c ) 135 cm silty clay, Inuvik.range, frozen soil conductivity is generally found to increase
1 with decreasing temperature.
Figure 10 presents data measured in organic soils at Thompson and at Ft. Wrigley. Values were found to repeat with reasonable
: consistency from one yearto the next. The curves for moss (Fig*
1Oa) were obtained using probes buried at mid-depth in the thin surface layer of sphagnum moss. Both sites were within wooded
'
areas. While summer values at Thompson are -50% greater
than corresponding values from Ft. Wrigley, winter values are
more than twice as Beat. This would suggest higher moisture
levels at the Thompson site, a conjecture which is further sup-
ported by comparing the summer values for the underlying
thawed peat (Figs. 1Ob and 10c). Once again, the Thompson values are generally higher.
The
frozen sail values, on the other hand, are only about two-thirds as great at Thompson. There is a definite trend for the conductivity at Thompson to decrease in autumn and early winter, prior to freezing; the decrease fromAugust until December was by a factor of two. This tendency was also found in data from a second probe in peat at Thompson (not shown). A possible explanation is desiccation of the soil at probe level during freezing of the material above. Figure 10c
also shows data for a peat layer beneath the embankment at the Wrigley site compared with the data from a nearby natural site. The effect of compression by the embankment is to approxi- mately double the frozen soil value and triple the thawed soil value.
Figure 10d shows data for organic clay (muck) at one of two sites at Thompson. No significant variation was observed during the summer and both sites yielded the same conductivity (within measurement errors). Winter values at both sites were also relatively constant, although one site yielded a slightly higher value (1.6W.m-'.K-l instead of 1.5 W . ~ - ' . K - ' ) . Year-to- year variability was also slight. This near constancy of the summer and winter values stands in contrast to the behaviour of
CAN. GEOTECH. I. VOL. 23, 1986
the other organic materials and is presumably related to more constant and repeatable moisture contents occurring as a result of the clay fraction.
4
ConclusionThis study provides an assessment of the seasonal variability of the thermal conductivity of soils in common field situations.
D In natural terrain, seasonal and long-term variations in conduc-
O 1.0
!
tivity in thawed soil were not more than a few percent for depths-1s -10 - 5 u 'I below about 0.5 m. Within a few decimetres of the surface,
T E M P E R A T U R E , "C however, conductivity changes could be up to 30% during the FIG. 9. Temperature dependence of frozen soil thermal conduct- summer if the soil dries out (Ottawa data) or negligible if there is ivity, Thompson site. little drying (Thompson and Wrigley organic cover). At deeper
1 . 2 I I I I I I I I I 1 I ( a ) 1 9 7 8 - 8 2 0 . 9 -0-0- T H O M P S O N
-
\o-o -&-A- W R I G L E Y 0 . 6 a%o-~-O-
0 . 3 0'
0 . 9-
7
4 I ( b ) 1 9 7 9 - 8 2 ILL 0 . 6-
0 \ 0 A o - 0 ~ 0 - 0 ~ 6 0 0 O-o0 ' E 0 . 3 0z
0 I I I I I I 1 I I I I 1 . 5-
C O M P R E S S E D B E N E A T H c ( c ) 1 9 7 9 - 8 1 E M B A N K M E h T U 0 . 9-
-
n Z 0 U 0 . 6-
-I a 0 . 3-
r x WE
1. 8O
I I I I I I I 1 I I I I I 0 1 . 5-
-O-~-O-OO-~-O--
1 ' 2-
( d l 1 9 7 6 - 8 1-
0 . 9-
-
5 . 6-
-00- O - ~ - ~ - O ~ - ~-
. ~ ~ ~ 0 . 3 I I I I I I I I I I J A N F E B M A R A P R M A Y J U N E J U L Y A U G S E P T O C T N O V D E CFIG. 10. Seasonal variation of thermal conductivity-organic materials: (a) 7.5 cm sphagnum moss, Thompson and Wrigley; ( b ) 45 cm peat, Thompson: ( c ) 10 cm peat. Ft. Wriplev: I di 20 cm organic clay. Thompson.
levels, where the soil stayed wet, relatively similar values for the thawed soil conductivity (within approximately +25%)
were found for all the sites (soil composition ranging from clay to sandy silt). Frozen soil conductivities were usually greater than thawed soil conductivities and they also showed a much greater dependence on site. In at least one case (shallow depth), the expected winter maximum failed to materialize even though in other years it was well developed.
In the upper levels of gravel pads at both Ottawa and Thompson, the greatest variability appeared in the thawed soil values. In addition, frozen soil values were frequently less than thawed soil values. Near the bottom of the gravel pad at Thompson, however, the thermal conductivity exhibited a
, well-defined bivalued (frozen/unfrozen) seasonal behaviour,
'
the frozen soil value being about 40% greater than that of the
ivity variations are likely to be consistent from year to year, there may be important differences dependent on site conditions, which affect the nature of the annual variations. At shallower depths the repeatability deteriorates significantly and estimates of representative thermal conductivity values could be grossly in error. Consideration should, moreover, be given to possible differences in moisture levels within nominally similar material layers when estimating thermal conductivities of granular materials for engineering structures.
Acknowledgements
This paper is a contribution from the Division of Building Research, National Research Council of Canada. Thanks are
due T. L. White, who carried out many of the measurements.
thawed soil.
At the two road embankment sites on permafrost at Inuvik, values directly beneath the insulation were lower than at the corresponding depths in an uninsulated section; the difference between the two sites was as much as 50% for the winter values. At Wrigley, for depths near the base of the embankment, similar values were found regardless of lateral position, whereas closer to the surface, winter values on the centre line were nearly double those measured on the shoulder. These effects suggest the need for some caution in estimating thermal properties for engineering design calculations on embankments.
Measurements made in sphagnum moss gave widely different values at two sites, although in both cases a well-defined bivalued seasonal variation was found. In peat, however, distinct winter/summer values were found at one site while, at the other, conductivity was much less clearly determined by phase state.
As a general conclusion, the results of this study suggest that, while for depths below -0.5- 1.0 m seasonal thermal conduct-
CRAWFORD, C. B. 1961. Engineering studies of Leda Clay, In Soils in Canada. Edited by R. F. Legget, Royal Society of Canada Special Publications, No. 3, pp. 200-217.
FAROUKI, 0 . T. 1981. Thermal properties of soils. United States Army, Corps of Engineers, Cold Regions Research and Engineering Laboratory, Hanover, NH, Monograph 8 1
-
1.JOHANSEN, 0. 1975. Thermal conductivity of soils. Ph.D. thesis, Trondheim University, Norway (Cold Regions Research and Engin- eering Laboratory Draft Translation 637, 1977, ADA 044002).
KERSTEN, M. S. 1949. Thermal properties of soils. University of Minnesota Engineering Experimental Station, Bulletin No. 28.
SLUSARCHUK, W. A,, and FOULGER, P. H. 1973. Development and calibration of a thermal conductivity probe apparatus for use in the field and laboratory. Division of Building Research, National Research Council Canada, Ottawa, Ont., NRCC 13267, Technical Paper 388.
WECHSLER, A. E. 1966. Development of thermal conductivity probes for soils and insulations. United States Army, Corps of Engineers, Cold Regions Research and Engineering Laboratory, Hanover, NH, Technical Report 182. Hanover, N.H.
T h i s p a p e r i s b e i n g d i s t r i b u t e d i n r e p r i n t f o r m by t h e I n s t i t u t e f o r Research i n C o n s t r u c t i o n . A l i s t of b u i l d i n g p r a c t i c e and r e s e a r c h p u b l i c a t i o n s a v a i l a b l e from t h e I n s t i t u t e may be o b t a i n e d by w r i t i n g t o t h e P u b l i c a t i o n s S e c t i o n , I n s t i t u t e f o r R e s e a r c h i n C o n s t r u c t i o n , N a t i o n a l Research C o u n c i l of C a n a d a , O t t a w a , O n t a r i o ,