HAL Id: hal-01849813
https://hal.archives-ouvertes.fr/hal-01849813
Submitted on 26 Jul 2018
HAL is a multi-disciplinary open access
archive for the deposit and dissemination of
sci-entific research documents, whether they are
pub-lished or not. The documents may come from
teaching and research institutions in France or
abroad, or from public or private research centers.
L’archive ouverte pluridisciplinaire HAL, est
destinée au dépôt et à la diffusion de documents
scientifiques de niveau recherche, publiés ou non,
émanant des établissements d’enseignement et de
recherche français ou étrangers, des laboratoires
publics ou privés.
Visualizing symmetric square matrices with rainbow
boxes: methods and application to character
co-occurrence matrices in literary texts
Jean-Baptiste Lamy
To cite this version:
Jean-Baptiste Lamy. Visualizing symmetric square matrices with rainbow boxes: methods and
ap-plication to character co-occurrence matrices in literary texts. International Conference Information
Visualisation (iV), Jul 2018, Salerno, Italy. �hal-01849813�
Visualizing symmetric square matrices with rainbow boxes: methods and application
to character co-occurrence matrices in literary texts
Jean-Baptiste Lamy
LIMICS, Université Paris 13, Sorbonne Université, Inserm, 93017 Bobigny, France Email: [email protected]
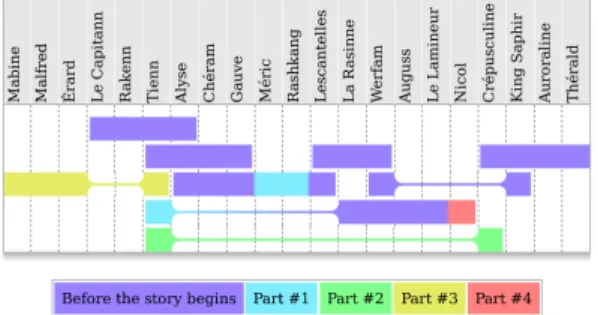
Figure 1. Rainbow boxes displaying groups of interrelated characters in a novel. Characters are in columns, and each rectangular box corresponds to a group of characters. In a given group, each character is related to each other character of the same group. Box colors indicate the part of the novel during which a character joins the group.
Abstract—A symmetric square matrix is a type of dataset frequently found in various domains. An example is character co-occurrence matrices in digital humanities. However, the visualization of these matrices is difficult. In this paper, we propose a method for visualizing symmetric square matrices, by transforming a matrix into overlapping sets, and then by visualizing these overlapping sets using rainbow boxes, a recent set visualization technique. We apply this method to the visualization of character matrices in novels, using two datasets: a small one (21 characters) and a large one (80 characters). We show that this visualization allows the finding of several insights. Finally, we discuss the advantages and drawbacks of this method, and we compare it to other approaches in the literature.
Keywords-Knowledge visualization, matrix visualization, over-lapping set visualization, symmetric square matrix, distant read-ing, digital humanities.
I. INTRODUCTION
Symmetric square matrices and co-occurrence matrices are a kind of dataset that can be encountered in many domains [1]. Any undirected graph can be represented by an adjacency matrix, leading to a symmetric square matrices. Such matrices are frequently encountered in visual text anal-ysis [2], which applies information visualization methods to digital humanities. When the structure of the text is not preserved by the visualization, this is called distant reading (by opposition to close reading). In particular, character co-occurrence matrices can be extracted from novels and narrative texts, and visualized with various techniques. An
example of a symmetric square matrix, representing the relations between the 21 main characters in a novel, is shown in Figure 2.
In this paper, we propose a method for visualizing symmetric square matrices, by transforming a matrix into overlapping sets, and then by visualizing these overlapping sets using rainbow boxes. Rainbow boxes is a recent set visualization technique [3], [4]. In rainbow boxes (see ex-ample on Figure 1), elements are represented in columns and each set is represented by a rectangular box that covers the columns corresponding to the elements belonging to the set (the set label can be shown inside the box, however, in Figure 1 the sets are unlabeled). When the elements of a given set cannot be placed next to each other, holes are present in the box (e.g. the yellow box on the left of Figure 1 has one hole of size 2). The column order is optimized for minimizing the number of holes in the visualization. We initially developed rainbow boxes for the comparison of drug properties [5] and then we applied them to biomedical data and knowledge. Here, we present an application of rainbow boxes in a totally different domain.
The method we propose is particularly aimed toward the identification and the representation of subsets of interrelated elements, for example in a novel, groups of characters that know each other.
The rest of the paper is organized as follows. Section II describes the visualization method we propose. Section III presents the application of the method to the visualization of character matrices, with two datasets: one small (21 charac-ters) and one large (80 characcharac-ters) and show various insights that can be produced from these visualizations. Section IV discusses the method and the results, and compares our approach to literature, before concluding.
II. METHODS
A symmetric square matrix can be formalized as M = (Mi,j)1≤i≤n,1≤j≤n ∈ R, with Mi,j = Mj,i. Our method for visualizing a symmetric square matrix follows two steps: first, producing a set of overlapping sets from the matrix, and second, visualizing these overlapping sets using rainbow boxes.
For the purpose of step 1, we consider each row/column of the matrix (i.e. each index i ∈ E = {1, 2, ..., n}) as an
Figure 2. Example of a symmetric square matrix showing the relations between 21 characters in a novel. Numbers in the matrix indicates the parts of the novel in which the two characters meet for the first time (0: no relation, 1: before the novel starts, 2: during part #1, etc).
element, and then we define several overlapping sets made of these elements. Each set will include only elements related to each other.
For describing the method, and facilitating customization, we will consider 3 functions: the selection function, the aggregation function and the colorization function. The selection function select : R → {T rue, F alse} indicates, for a given value in the matrix, if the two elements are considered as related, i.e. i and j are considered as related if (and only if) select(Mi,j) = T rue. For example, in the matrix of Figure 2, two elements are considered as related if the value in the matrix is not zero.
Using the selection function, we can generate all element subsets s that include only elements related to each other (e.g. when considering a character matrix, all characters in a given subset s know all the other characters of the subset). We name S0the set of all subset s.
S0= n
s ⊆ E | |s| > 1 ∧ ∀(i, j) ∈ (s, s) with i 6= j, select(Mi,j) = T rueo Then we compute S, the set containing only the largest subsets s in S0 (i.e. we only keep subsets s for which no superset exists in S0).
S = {s ∈ S0|6 ∃s0 ∈ S0, s ⊂ s0}
The subsets s in S are the largest sets of interrelated elements. These subsets can be visualized using rainbow boxes: each element in E (corresponding to row/columns of the matrix) will be represented by a column in rainbow boxes, and each subset will be represented by a rectangular box. The box covers all columns corresponding to the elements in the subset.
In addition to set membership, the values present in the matrix can be represented in rainbow boxes using colors. For a given element i ∈ E in a subset s ∈ S, there can be several values in the matrix. For example, if we consider s = {i, j, k}, two values are present in the matrix for i and the other elements of s: Mi,j and Mi,k. In the general case, the number of values is
s
−1. For the sake of visualization, we choose to aggregate these values into a single value and then to represent it using colors. The aggregation is achieved by the function aggregate : Rp→ R (with p ≥ 1). It takes one or more values from the matrix, and returns a single aggregated value.
Finally, the colorization function colorize : R → color takes as parameter the aggregated value and return a color. The color will be applied to the rectangular box in the corresponding column (i.e. colors are defined on a per-subset/box and per-element/column basis, thus a given box may have different colors).
Rainbow boxes require to optimize the column order, for minimizing the number of holes in the boxes. In previous works, we proposed a heuristic algorithm for solving this problem with up to 20-25 columns. However, one of the two datasets we will present in this paper includes 80 characters, leading to 80 columns. Therefore, we used the Artificial Feeding Birds (AFB) metaheuristic [6] for opti-mizing column order. AFB is a nature-inspired metaheuristic [7], inspired by the behavior of pigeons, and is able to solve both non-linear and combinatorial optimization problems.
III. APPLICATION TO CHARACTER MATRICES
A. Small dataset (Sombre comme l’Aurore)
Figure 2 shows a character matrix for Sombre comme l’Aurore, a French yet-unpublished novel written by the au-thor of the paper. This matrix includes the 21 main characters of the novel and was produced manually by the author. A rather conservative definition of “character relation” was considered: two characters are considered as related if it is plausible that they met together outside of the events directly reported in the novel. Since the novel covers a period of one year, not all events are reported and, in particular, characters that are friends to each other are likely to meet much more often that told in the novel. On the contrary, simple encounters that do not lead to regular relationship are not considered as “relation” in this matrix. Consequently, the matrix is not a simple co-occurrence matrix. When a relation holds between two characters, the matrix indicates by an integer number the part of the novel during which their relation starts: 1 means before the story begins, and 2-5 correspond to part #1-4 in the novel, respectively. Finally, 0 in the matrix indicates the absence of relation between two characters.
We used the previously described method for transforming this matrix in overlapping sets, and for visualizing these sets
using rainbow boxes. The three parameter functions were defined as follows. The selection function selects all pairs in the matrix were the value in the matrix is not zero. select : p 7→ T rue if p 6= 0, F alse otherwise
The aggregation function returns the minimum value (consistently with the content of the matrix, which indicates the first part of the novel where two characters have a relation).
aggregate : p1, p2, ... 7→ min(p1, p2, ...)
The colorization function produce a bright color, whose hue indicates the first part of the novel in which a character joins a group, using the color key shown at the bottom of Figure 1. Cold/hot colors correspond to the beginning/end of the story, respectively.
colorize : a 7→ violet if a = 1 cyan if a = 2 green if a = 3 yellow if a = 4 red if a = 5
Figure 1 shows the rainbow boxes representing the matrix in Figure 2. The 21 characters are represented by columns. Each box represents a group of interrelated characters, i.e. any character in a given group is related to any other char-acter of the group. For example, the top-most box indicates that Le Capitann, Raken, Tienn and Alyse are related to each other. In addition, the colors indicate when a character joined the group. The top-most box is entirely violet, indicating that the four characters were related to each other before the story begins. On the contrary, the box covering Alyse, Chéram, Gauve, Méric, Rashkang and Lescantelles is bicolor: Alyse, Chéram, Gauve and Lescantelles formed a group before the story begins (violet color) while Méric and Rashkang joined this group in part #1 (cyan color). Notice that, since we used the minimum function as aggregation function, the fact that Alyse is in violet in this box does not imply that she is related to all other characters in the group before the story begins: she may be related to only some characters in the group before the beginning, and then develop relations with the others later.
Several new insights can be obtained from Figure 1: (1) Many groups are already present before the story begins (the violet color is dominant). (2) Tienn is the character that belongs to the highest number of groups (five rectangular boxes in the Tienn column). Indeed, Tienn is the hero of the novel. (3) Tienn belongs to two groups before the story begins (the two violet boxes in his column). (4) In the first part of the novel, Tienn joins an already formed group of characters (La Rasinne, Werfam, Auguss and Le Lamineur). In fact, this corresponds to his colleagues in his first job. (5) This group will be joined by Nicol in part #4 (red segment in that box). He is a new colleague. (6) In part #2, Tienn encounters Crépusculine (the green box at the bottom). In
addition, we can see that Tienn and Crépusculine have no common friends at all (the green box includes no other characters), and that they are very distant in the visualization. Indeed, they come from two different worlds, and they fall in love. (7) Moreover, we can search the shortest path between Crépusculine and Tienn (ignoring their direct relation). This path is Crépusculine → King Saphir → Werfam → Tienn. (8) In part #3, Tienn joins a new group of three characters (Mabine, Malfred and Érard) that have no relations with any other characters. Indeed, those characters live isolated, in a kind of ghetto.
B. Large dataset (Les Misérables)
A well-known dataset from the Stanford GraphBase in-cludes a character graph from Les Misérables, a famous novel written by Victor Hugo. The graph contains 80 characters and indicates their co-occurrences in the novel. Each co-occurrence is a separate relation in the graph, and is labeled with the part and chapter in which it occurs. We transformed this dataset into two symmetric squared matrices, with characters as rows and columns, one including the parts of the novel and the other the numbers of co-occurrence.
The first matrix, M , indicates for each character pair the part (1-5) of the novel during which the first co-occurrence occurs. This matrix contains values similar to the one shown in Figure 2. It was visualized using the same selection and aggregation functions as in section III-A. Since no character joined a new group in part #5, the colorization function was modified to produce only 4 different colors (violet, cyan, green, red).
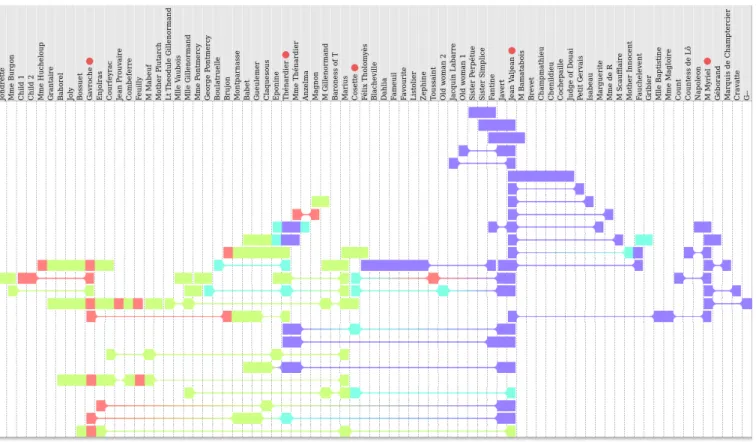
The resulting rainbow boxes are shown in Figure 3. The following insights can be obtained from the figure: (1) Most of the new character-group relations occur at the first and third part of the novel (violet and green colors are dominant). (2) Jean Valjean is the character that belongs to the highest number of groups. Indeed, he is the main character of the novel. (3) Cosette appears in part #2 and also joins new groups in part #3. (4) Gavroche appears in part #3, in a single group, but joins many other groups during part #4, two of them including Jean Valjean. (5) the characters seem quite well separated with regards to the parts of the novel: characters on the left appear mostly in part #3-4 while those in the right appear in part #1. The Thénardiers are the most noticeable exception: they appear in part #1, but join several groups later during parts #2 and #3.
The second matrix, M0, indicates for each character pair the number of co-occurrences (between 0 and 31). We visualized it using the previously defined selection function, and an aggregation function that computes the sum of the co-occurrences. Thus, the aggregation function returns the total number of co-occurrence between the character and the rest of the group.
Figure 3. Rainbow boxes displaying the symmetric square matrix of character co-occurrence in Les misérables. Hue (violet, cyan, green, red) indicates the parts (1-2-3-4) of the book, respectively. Characters mentioned in the text are highlighted with red dots.
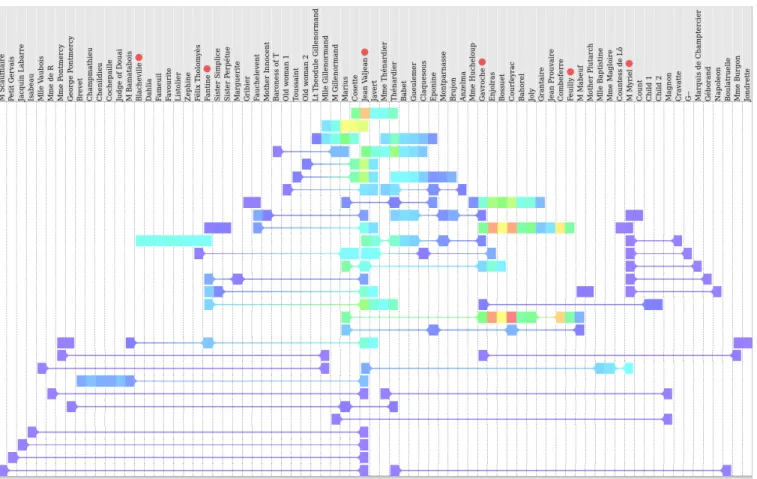
The colorization function produce “hotspot” colors, map-ping the lowest value (0) to violet and the highest value (77) to red, using a hue-based color gradient between the two extremes. Thus, cold/hot colors correspond to characters having few/many relations with the group.
In addition, the rainbow boxes column optimization was biased in order to favor holes in boxes associated with fewest co-occurrences (hence resulting in a different character order than in Figure 3). For each box, we computed mcooc the mean number of co-occurrence. Then, the cost for adding a hole in a given box was proportional to mcooc. This prevent splitting boxes corresponding to the most important (in terms of the number of co-occurrence) groups of characters.
The resulting rainbow boxes are shown in Figure 4. We can observe that: (1) Jean Valjean appear as the “central” character. (2) Myriel has several relations, but with very few co-occurrences (violet color). (3) There is a group of 8 interrelated characters (from Blacheville to Fantine, the cyan box on the left) that have very few relations with other characters (only Fantine and Félix are belonging to other groups). (4) In most groups he belongs to, Jean Valjean is the most interacting character (hotter color in his column); the group with the Gillenormands, Marius and Cosette is an exception, with Marius and Cosette being more active. (5) There are some highly interacting characters from Gavroche
to Feuilly, spread over three groups, and Courteyrac and Enjolras are the most active in these groups.
In both figures, we can see that Javert is placed next to Jean Valjean (they have 11 groups in common). Indeed, Javert is a policeman tracking Jean during most of the novel. In addition, a characteristic pattern of triangular “Christmas tree” (fir) can be observed around Myriel and (to a lesser extent) Jean Valjean. This pattern indicates that the central character (forming the trunk of the tree) has many isolated relations with other characters (the leaves), i.e. the central character is related to many other characters without having common friends with them. Depending on the global shape of the rainbow boxes, this pattern can be bilateral (as in Figure 3) or unilateral (as in Figure 4 for Myriel).
IV. DISCUSSION AND CONCLUSION
In this paper, we proposed a method for visualizing symmetric square matrices using rainbow boxes, a set visu-alization technique not initially aimed at representing matrix datasets. We applied this method to the visualization of character matrices in novels. We showed that this method was efficient for identifying groups of interrelated elements and generating new insights. Thus, it may be interesting for visualizing highly connected networks. We also described a characteristic pattern of “Christmas tree” for elements related to many isolated others.
Figure 4. Rainbow boxes displaying the symmetric square matrix of character co-occurrence in Les misérables. Hue indicates the frequency of character interactions (hotter colors corresponding to characters that interact more frequently with the group).
The two datasets we presented differ in size, but also qualitatively. The first one was produced manually by the author, using a conservative definition of “relation” between two characters. On the contrary, the second one was built automatically by considering co-occurrence of characters in the novel. Figure 1 is visually much simpler and easier to read than Figure 3, this can be explained by the smaller size of the dataset, but possibly also by the difference in the nature of the matrices. It would be interesting to extract a co-occurrence matrix from Sombre comme l’Aurore, and to compare it with the manually produced matrix.
When building overlapping sets from matrices, we consid-ered only pairwise relations. Thus, the character groups we extracted do not necessarily exhibit higher-level relations. For example, if A is related to B and C, and B is related to C, then A, B and C form a group. However, it does not necessarily imply that A, B and C meet all the three (i.e. ternary relation). Consequently, A might be unaware that B and C are related.
With regard to the matrix size, the proposed method is limited by the number of columns that can be shown on a screen, and by the optimization algorithm that reorders columns. On the 80-character dataset, the optimization took
several minutes. As a consequence, the method is currently limited to matrices with fewer than 100 rows/columns. This limit might be overcome by performing clustering beforehand, in order to group similar rows/columns and reduce their number.
In the literature, various approaches have been proposed for the visualization of symmetric square matrices. First, these datasets are frequently visualized as colored matri-ces after reordering rows and columns [8]; for instance, an online matrix visualization of Les Misérables can be seen at https://bost.ocks.org/mike/miserables/. An example of matrix-based tools is MatLink [9], which has been applied to the analysis of social networks.
Matrix reordering methods allow the identification of interrelated character groups: those groups form squares on the matrix diagonal (or triangle if only half of the matrix is shown). For example, in Figure 2, 5 such groups can be seen on the diagonal. However, with this approach, a character belongs only to a single group, or at most two if the character is placed in-between two squares on the diagonal. For instance, Tienn has been placed at the beginning of the matrix in Figure 2, but could also be placed at the end (due to the three “4” at the end of the Tienn’s row). On the contrary,
Tienn belong to not less than 5 groups in the rainbow boxes representation in Figure 1, and 9 interrelated groups have been identified (4 additional groups compared to the matrix reordering methods). Similarly, in Figure 4, we can see several overlapping groups at the top of the visualization, most of them including Jean Valjean. In addition, rainbow boxes allow a compact representation of the dataset: a group of n characters that know each other occupiesn×(n−1)2 cells in the matrix, but the entire group is represented as a single box in rainbow boxes, with a length of n columns.
Second, a character matrix can be treated as a similarity matrix. Therefore, dimension reduction techniques, such as Principal Component Analysis (PCA) or Multidimensional Scaling (MDS) [10], can be used in order to transform a matrix into a two-dimensional scatter plot, a topological landscape or a knowledge map. An example is the Text Vari-ation Explorer [11], which uses PCA to represent various sociolinguistic features in text fragments using a scatter plot. Another example is Memory Islands [12], which integrate hierarchical knowledge, e.g. from an ontology.
Third, a co-occurrence matrix can be represented as an undirected graph or a network. However, those graphs often become difficult to read when the number of nodes increases. For instance, word co-occurrences have been visualized using graphs for analyzing scientific literature on patient adherence [13]. Graphs have also been used for visualizing plagiarism in pieces of music, i.e. co-occurrences of several identical notes in several pieces [14].
Fourth, chord diagrams have been proposed for the visual-ization of character co-occurrences in novels [15]. The chord diagram displays all characters on a ring, and represent co-occurrences by “chords” linking two characters, and located in the middle of the ring. It allows selecting a character and observing its co-occurrences with other characters, but it does not help with the identification of groups of interrelated characters.
The perspectives of this work are (1) to extend the pro-posed method to the visualization of non-symmetric square matrices (including directed graphs), (2) to apply a similar method using overlapping set visualization techniques other than rainbow boxes, such as Euler diagrams, and (3) to apply the method to other domains, such as the visualization of FOAF (Friend Of A Friend) graphs in social media, protein-protein interaction matrices in bioinformatics, drug-drug interaction matrices in pharmacology, or matrices generated with Linkography [16].
REFERENCES
[1] L. Leydesdorff and L. Vaughan, “Co-occurrence matrices and their applications in information science: Extending ACA to the Web environment,” Journal of the association for information science and technology, vol. 57, no. 12, pp. 1616– 1628, 2006.
[2] S. Jänicke, G. Franzini, M. F. Cheema, and G. Scheuermann, “Visual text analysis in digital humanities,” pp. 226–250, 2016.
[3] J. B. Lamy, H. Berthelot, C. Capron, and M. Favre, “Rainbow boxes: a new technique for overlapping set visualization and two applications in the biomedical domain,” Journal of Visual Language and Computing, vol. 43, pp. 71–82, 2017. [4] J. B. Lamy, H. Berthelot, and M. Favre, “Rainbow boxes: a
technique for visualizing overlapping sets and an application to the comparison of drugs properties,” in International Conference Information Visualisation (iV), Lisboa, Portugal, 2016, pp. 253–260.
[5] J. B. Lamy, H. Berthelot, M. Favre, A. Ugon, C. Duclos, and A. Venot, “Using visual analytics for presenting comparative information on new drugs,” J Biomed Inform, vol. 71, pp. 58–69, 2017.
[6] Lamy JB, Advances in nature-inspired computing and ap-plications. Springer, 2018, vol. under press, ch. Artificial Feeding Birds (AFB): a new metaheuristic inspired by the behavior of pigeons.
[7] Yang XS, Nature-inspired metaheuristic algorithms (second edition). Luniver Press, 2010.
[8] H. Wu, S. Tzeng, and C. Chen, Handbook of data visualiza-tion. Springer, 2008, ch. Matrix visualization, pp. 681–708. [9] N. Henry and J. D. Fekete, “MatLink: Enhanced matrix visualization for analyzing social networks,” in INTERACT, Lecture Notes in Artificial Intelligence, vol. 4663. Springer, 2007, pp. 88–302.
[10] I. Borg, P. J. F. Groenen, and P. Mair, Applied multidimen-sional scaling. Springer, 2013.
[11] H. Siirtola, P. Isokoski, T. Säily, and T. Nevalainen, “In-teractive Text Visualization with Text Variation Explorer,” in International Conference Information Visualisation (iV), Lisboa, Portugal, 2016, pp. 330–335.
[12] B. Yang and J. G. Ganascia, “Creating knowledge maps using Memory Island,” International journal on digital libraries, vol. 18, no. 1, pp. 41–57, 2017.
[13] J. Zhang, J. Xie, W. Hou, X. Tu, J. Xu, F. Song, Z. Wang, and Z. Lu, “Mapping the Knowledge Structure of Research on Patient Adherence: Knowledge Domain Visualization Based Co-Word Analysis and Social Network Analysis,” Plos one, vol. 7, no. 4, pp. 1–7, 2012.
[14] R. De Prisco, A. Esposito, N. Lettieri, D. Malandrino, D. Pirozzi, G. Zaccagnino, and R. Zaccagnino, “Music pla-giarism at a glance: metrics of similarity and visualizations,” in International Conference Information Visualisation (iV), Lisboa, Portugal, 2016, pp. 410–415.
[15] Bilenko N, “The narrative explorer, Technical report, EECS Department, University of California, Berkeley,” 2016. [16] T. L. Hsieh and T. W. Chang, “Whether the relationscape
of Interaction design strategies during design process can be explained by Linkography,” in International Conference Information Visualisation (iV), London, United Kingdom, 2017, pp. 14–19.