Lighting ambiances and materialities of wood in architecture : a comparative evaluation of the quality of spaces in relation to interior finishes
174
0
0
Texte intégral
(2) . Lighting Ambiances and Materialities of Wood in Architecture: a comparative evaluation of the quality of spaces in relation to interior finishes. Mémoire. Hoda Jafarian. Sous la direction de:. Claude Demers, directrice de recherche Pierre Blanchet, codirecteur de recherche Véronic Landry, codirectrice de recherche .
(3) Résumé Le bois est un matériau souvent utilisé par les architectes pour améliorer l'ambiance générale d'un espace, mais peu de recherches en présentent l’impact réel du matériau sur les impressions visuelles et les effets lumineux. Cette recherche étudie l'influence de la matérialité du bois par rapport à la création d'ambiances d'éclairage spécifiques dans l'architecture. Plus particulièrement, elle se concentre sur l'impact des panneaux décoratifs en bois à générer de la diversité lumineuse dans les espaces intérieurs et son potentiel à améliorer la satisfaction environnementale et l'efficacité énergétique. La recherche utilise des maquettes à l’échelle pour leur précision dans la représentation des ambiances lumineuses d’espaces éclairés naturellement ainsi que les technologies récentes d'imagerie digitale pour capturer et analyser les résultats. La méthodologie permet la comparaison entre les différents réglages des espaces intérieurs créés par une sélection des types de matérialités du bois: la réflectance (valeur), la couleur et la réflectivité. Les modalités spatiales sont comparées en présence d’ensoleillement direct et sous des conditions de ciel couvert puisque les modèles d'éclairage et les ambiances diffèrent considérablement. Les résultats permettent d’établir une discussion sur les ambiances en termes de brillance et de contraste, sur la couleur ainsi que la répartition des zones lumineuses dans l'espace. La recherche souligne le rôle des matérialités que peuvent prendre le bois pour optimiser la diversité lumineuse et la création d'ambiances visuellement confortables, ainsi que ses possibilités d'améliorer les ambiances architecturales par rapport à la lumière.. iii.
(4) Abstract Wood is a material often used by architects to enhance the overall ambiance of a space but few research discuss its actual impact on visual impressions and luminous effects. This research studies the influence of wood materialities in relation to creating specific lighting ambiances in architecture. More particularly, it focuses on the impact of decorative wood indoor panels on the creation of daylighting diversity in interior spaces and the potential to improve environmental satisfaction and energy efficiency. The research uses scale models for their accuracy in rendering complex daylighting ambiances in conjunction with the latest imaging technologies to capture and analyze the results. The methodology enables the comparison between different settings of interior spaces created by a selection of wood type materialities: ratio (percentage), color and gloss. Spatial modalities are compared in the presence of direct sunlighting and diffuse skylight conditions since lighting patterns and ambiances differ considerably. The results enable a discussion of ambiances in terms of brightness and contrast, color, as well as the luminous distribution in the space. The research underlines roles of wood materialities to achieve luminous diversity and creating visually comfortable interior ambiances as well as its opportunities to enhance architectural ambiances in relation to light.. iv.
(5) Table of Contents Résumé ......................................................................................................................................... iii Abstract ......................................................................................................................................... iv Table of Contents ......................................................................................................................... v Table of table ............................................................................................................................. vii Table of figures ........................................................................................................................ viii Acknowledgment ......................................................................................................................... x Foreword ....................................................................................................................................... xi Chapter 1 Introduction .............................................................................................................. 1 1.1 Introduction ..................................................................................................................................... 1 1.1.1 Daylight ambiance .................................................................................................................................... 1 1.1.2 Wood environments and Biophilia ................................................................................................... 3 1.2 Problematic ...................................................................................................................................... 4 1.3 Objectives ......................................................................................................................................... 6 1.3.1 General .......................................................................................................................................................... 6 1.3.2 Specific .......................................................................................................................................................... 6 1.4 Hypothesis ........................................................................................................................................ 7. Chapter 2. Theoretical Context ............................................................................................... 8 2.1 Qualifying aspects of daylit ambiances ................................................................................... 8 2.1.1 Visual comfort ............................................................................................................................................ 8 2.1.2 Brightness ................................................................................................................................................. 10 2.1.3 Contrast ..................................................................................................................................................... 11 2.1.4 Color ............................................................................................................................................................ 13 2.2 Quantifying daylighting- Lighting simulation and measurements ............................ 14 2.2.1 Lighting simulation and daylight factor ....................................................................................... 16 2.2.2 Image based lighting ............................................................................................................................ 18 2.3 Analysis Tools and metrics for lighting simulations ....................................................... 19 2.3.1 Ecotect ........................................................................................................................................................ 19 2.3.2 Radiance .................................................................................................................................................... 20 2.3.3 Photosphere ............................................................................................................................................. 20 2.3.4 Photolux photo-luminancemeter system .................................................................................... 21. Chapter 3. Methodology ......................................................................................................... 22 3.1 Using a reduced scale model ................................................................................................... 23 3.1.1 Viewpoint .................................................................................................................................................. 24 3.1.2 Choosing the Wall frame .................................................................................................................... 26 3.1.3 Selection of a type of glass ................................................................................................................. 29 3.1.4 Scale Model ............................................................................................................................................... 30 3.1.5 Materials .................................................................................................................................................... 31 3.2 Quantifying Daylighting ............................................................................................................ 32. 3.2.1 Digital image analysis: HDR photography and the Photolux photo-luminancemeter ................................................................................................................................................................................... 32 3.2.2 Daylighting distribution and quantity: Ecotect Software .................................................... 33 3.3 Experimental variables ............................................................................................................. 34 3.3.1 Wood Samples ......................................................................................................................................... 35. v.
(6) 3.3.2 Gloss ............................................................................................................................................................ 39 3.3.3 Climate and type of sky cover .......................................................................................................... 39 3.4 Construction and Description of the model ....................................................................... 40 3.5 Pre-experimental phase ........................................................................................................... 42 3.6 Experimental phase .................................................................................................................... 44. Chapter 4- Analysis and Results .......................................................................................... 46 Introduction ......................................................................................................................................... 48 Methodology ........................................................................................................................................ 53 Experimental setting ........................................................................................................................................ 53 Experiments and Results ................................................................................................................. 62 Quantitative Analysis – Impact of the Type of Wood ........................................................................ 63 Quantitative Analysis - Impact of the Location of Wood Surfaces .............................................. 66 Qualitative analysis – Color Temperature of the Space ................................................................... 69 Qualitative analysis - Brightness and contrast .................................................................................... 72 Effect of Gloss on Brightness and Contrast ............................................................................................ 76 Discussions and Conclusions .......................................................................................................... 79 Advantages and Limitations of the Research ....................................................................................... 83 Authors’ contribution ....................................................................................................................... 84 Funding Acknowledgments ............................................................................................................ 84 Declaration of conflicting interests .............................................................................................. 84 Reference: ............................................................................................................................................. 84 Chapter 5- Conclusion ............................................................................................................. 88 Discussions and Conclusions .......................................................................................................... 88 Advantages and Limitations of the Research ............................................................................ 91 References .................................................................................................................................. 93 Annex - Article Bioresources ................................................................................................ 99 Annex B- Kruger data acquisition ..................................................................................... 115 Annex C- Pre-experimental research .............................................................................. 120 Annex D- Experimental Research- Theoretical frame work .................................... 131 Annex E- Experimental Research - Physical model .................................................... 137 Annex F - Experimental Research -Data acquisition .................................................. 141 Annex G- Experimental Research - Ecotect Simulations ........................................... 158. vi.
(7) Table of table. Table 1: Daylight Glare Index Scale (Chauvel et al. 1982) ............................................................................................... 10 Table 2: Recommended minimum daylight factor (Kauffman, 2008) .......................................................................... 17 Table 3: Optical properties of five glazing types selected by Pineault (2009).. ......................................................... 30. vii.
(8) Table of figures Figure 1:Schematic scal for image classification (Demers 2007) .............................................................................. 12 Figure 2: Ranges of brightness and contrast values of daylight classification system (Demers, 2007).. ............ 13 Figure 3: CIEL*a*b* color space showing the axis a*, b* and L*. Source Baardseth et.al 1976. ........................ 14 Figure 4: Representation of the reduction in information content in the experimental research. This figure is adapted from Lau (1972).. .................................................................................................................................................. 24 Figure 5: Horizontal location of camera - central and side viewpoints .......................................................................... 25 Figure 6: Vertical movement of camera - central and side viewpoints ........................................................................... 26 Figure 7: Comparing the effect of wall frame on the quality of the space. ................................................................... 27 Figure 8: Comparing the space with the application of different quantity of oak wood ........................................... 28 Figure 9: Photograph of the interior of the scaled office room taken from the viewpoint of the research participant. Figure a) shows the blue glazing, Figure b) the neutral and Figure c) the bronze glazing. Source Arsenault 2012 ......................................................................................................................................................... 29 Figure 10: Scale model proportion proposed by Reinhart (2005) .................................................................................... 31 Figure 11: shows two exposure settings studied for this research .................................................................................... 33 Figure 12: shows the result of using Radiance. ................................................................................................................. 33 Figure 13: Variables studied in this research ........................................................................................................................... 35 Figure 14: Available wood samples. Source: http://www.cecobois.com. ...................................................................... 37 Figure 15: Brightness levels of different samples. Source: http://www.cecobois.com.. ........................................... 37 Figure 16: Selection of wood samples based on the color .................................................................................................. 38 Figure 17: Choosing 3 samples among the 5. .......................................................................................................................... 38 Figure 18: Technician worked on preparing the model (Wood panel preparation for the construction of the physical model) ...................................................................................................................................................................... 41 Figure 19: Process of assembling the scale model in outdoor conditions. From left to right: platform location, model orientation, and variable transformation. ......................................................................................................... 41 Figure 20: Pre-experimental research setting and 3 sheets of paper ................................................................................ 42 Figure 21: Classifying the results of the pre-experimental research. ............................................................................... 43 Figure 22: Data acquisition under a) clear sky and b) overcast sky. ............................................................................... 45 Figure 23. Scale model proportion ..................................................................................................................................... 55 Figure 24. Exposure parameter for Photolux photoluminance meter using HDR images ................. 56 Figure 25. Dynamic Rang Photography from the interior of the scale model with low-gloss walnut floor and oak window wall under a clear sky on 27 November 2014 at 13h30 .......... 56 Figure 26. Data acquisition under a) clear sky and b) overcast sky. .............................................................. 58 Figure 27. Conceptual framework of location and number of wood surfaces .......................................... 59 Figure 28. CIE LAB Color Space (Source: Baardseth et.al 1976).. ...................................................................... 61 Figure 29. Impact of ratio, position and color of wood on Daylight Factor ................................................. 63 Figure 30. Impact of the color of wood on the quantity of daylight distributed within the space. a) room concept A and b) room concept B. Graph left column: Ecotect daylight factor (DF) distribution. Right: Photolux system results showing luminance data.. .......................................... 65 Figure 31. Physical modeling under overcast sky condition showing high dynamic range photographs with Photolux results (false color images). a) all white space, b) oak floor and ceiling, c) walnut floor and ceiling, d) grey floor and ceiling. ................................................................. 67 Figure 32. Impact of the location of darker wood types on daylighting ambiances. a) quantity of light, for dark color floor ambiances b) quantity of light for dark color ceiling ambiances.. ..................................................................................................................................................................................................... 68 Figure 33. a* and b* values of selected experiments under two sky conditions: overcast (left) and clear (right). ......................................................................................................................................................................... 70 Figure 34. Impact of the type of wood (Walnut, Oak and Grey) on the color temperature of the space for overcast sky and cloudy sky conditions. ........................................................................................ 72. viii.
(9) Figure 35. Overall brightness and contrast values (from Demers, 2007). Orange and Purple dashed square refers to overcast and clear sky data collections respectively. ............................ 74 Figure 36. Classifying data collection from overcast sky based on overall brightness and contrast of images. Green, blue and red squares respectively show the impact of color, gloss and wood ratio. ............................................................................................................................................................................ 76 Figure 37. Comparison the effect of a gloss on brightness and contrast using HDR, false color, grey scale mode images and histogram patterns ........................................................................................... 78 Figure 38. Summary of the results according to type of wood and its location. ....................................... 83 Figure 39. Summary of the results according to type of wood and its location.. ................................................ 91. ix.
(10) Acknowledgment I have just completed 2 years of interesting and stimulating work. I am especially grateful to my director, Claude MH Demers, completing my thesis with the publication of two articles was not possible without her guidance, generous time and effort, challenging discussions throughout the study, and constructive advices as well as criticism. I wish to thank my co-supervisors Professor Pierre Blanchet and Veronic Laundry for their esteemed feedback and assistance specially Professor Blanchet for financially supporting this research and making it possible for me to complete my studies in Canada. I thank the Natural Sciences and Engineering Research Council (NSERC) of Canada for its support under the Industrial Research Chair Program IRCPJ 461745 as well as the chair industrial partners. Outside the Department, I must thank Natalie Noël, Guylaine Belanger and Marthe Larouche from the Wood and Forest Sciences department. I thank technicians at the CRMR for their extreme patience while manufacturing the scale model. Finally, I couldn’t close this thesis without mentioning the moral support I have had over the years from my family and all my good friends and special thanks to my mother for putting up with my long absence from home. Last but not least, I thank my husband, Mehdi, for his true interest in my work, for his constant and solid support during the last 2 years.. x.
(11) Foreword During this research I participated in development and production of the scale model. I proposed, tested and analyzed different scenarios to choose them for the purpose of this research. This memory includes a main article, written in English, which presents the results of the research. This scientific article was submitted to Journal of Indoor and built Environment and can be found in Chapter 4 of this document. The article is presented in its integral form in the thesis, and therefore, parts of its introductory elements may also appear in chapter 1, 2 and 3. During the research program, a pilot study was carried out in an existing building. The result of this pilot study has been published as a scientific article (Annex A of the thesis). This article was published on January 4th 2016 by the Journal of Bioresources. It was previously submitted to the Journal on July 31th 2015, accepted with corrections on September 23th, subjected to revisions on November 14th and accepted for publication on November 21th.. These two articles are original intellectual products of the authors. I was the lead researcher, responsible for all major areas of concepts formation, data collection and analysis as well as manuscript composition. The annexes acknowledge the extent of the data collection, which consisted of a considerable array of experimental processes. The fact that not only visual data were collected but also simulations were performed illustrates the particular challenge of the research. Annexes also show the numerous tables, original to the research. Most of these tables particularly represent my interest in exploring diverse arrays of visualization techniques to represent wood ambiances in relation to daylight. Claude Demers, director of thesis and professor of architecture, was involved from the early stages of concept formation, analysis and manuscript edits. Pierre Blanchet and Veronic Landry, co-supervisors of the thesis, wood scientist and chemist, respectively, specialized in wood indoor coatings and finishes were involved as supervisory authors throughout this study.. xi.
(12) Chapter 4- Jafarian, Hoda., Demers, Claude M. H., Blanchet, Pierre and Laundry, Veronic. Lighting Ambiances and Materialities of Wood in Architecture: a comparative evaluation of the quality of spaces in relation to interior finishes. Journal of Indoor and Built Environment, Submitted on June 2016. Annex A: Jafarian, Hoda., Demers, Claude M. H., Blanchet, Pierre and Laundry, Veronic (2016). Impact of Indoor Use of Wood on the Quality of Interior Ambiances under Overcast and Clear Skies: Case Study of the Eugene H. Kruger Building, Québec City. Bioresources 11(1) :1647-1663.. xii.
(13) Chapter 1 Introduction 1.1 Introduction Lighting ambiances are greatly connected with the perception and materialities of wood surfaces of interior spaces. Wood is a material often used by architects to enhance the overall ambiance of a space but few researches discuss its actual impact on visual impressions and luminous effects. This research studies the influence of wood materialities in relation to creating specific lighting ambiances in architecture. More particularly, it focuses on the impact of decorative wood indoor panels on the creation of daylighting diversity in interior spaces and the potential to improve environmental satisfaction and energy efficiency. This research is a collaboration between the Groupe de Recherche en Ambiances Physiques (GRAP) from the School of Architecture at Laval University and Centre de Recherche sur les Matériaux Renouvlables (CRMR) from the department of Wood science and forest through the support of the Chaire Industrielle de Recherche du CRSNG sur la construction écoresponsable en bois (CIRCERB).. 1.1.1 Daylight ambiance Daylighting has always been a preferred strategy for architects to reveal architectural ambiances and create emotions. Part of this reason relates to the fact that vision is the first sense through which occupants experience architecture (Baker et al., 1993). As energy efficiency and sustainability become increasingly important issues in the field of architecture, daylighting is recognized as a key strategy in reducing the energy consumption by reducing the demand for electrical lighting in a building. In the current context of sustainable development, the work of the architect has become highly complex. Regrettably, one of the current risks is to focus on building energy performance on the detriment of other important aspects participating in architectural quality, such as visual. 1.
(14) ambiances and comfort in built environments. More recently, white spaces have been regarded as most efficient in distributing dayligting, but it also appears that the use of natural materials such as wood should provide additional qualities on the visual ambiance of a space. Daylight is increasingly perceived as an influent design parameter in creating visual ambiances, an efficient energy saving strategy as well as for enhancing productivity stimuli among other benefits. Previous research revealed that users are of great significance for the success of daylighting design (Bodart and Herde (2002), Baker and Steemers, (2002), Bennadji A. et al, (2002)). Other authors also stressed the importance of daylighting design to achieve primarily the occupants’ comfort (Leslie (2003), Parpairi (2002), Boyce (1998), Tabet (2002)). The presence of natural light in built environment with its fluctuations, the variations in its spectra composition, and the provision for external views is of great importance for the comfort and well-being of occupants, potentially resulting in enhanced productivity. If carefully designed, a daylight strategy can also bring energy savings, as long as it minimizes energy use for artificial lighting, manages to balance heat gains and losses and prevents visual discomfort (e.g. glare). According to Veitch and Newsham (1996) good lighting quality must meet requirements linked to task performance and behavioral effects, safety, as well as health, and aesthetic matters. In the ninth edition of the IESNA Lighting Handbook, good lighting is defined as a balance between the occupants’ needs, architecture, economics, and the environment (Rea, 2000). Daylight, even if it is variable in intensity and color, and daylit spaces generally offer a view toward the outside. A daylit space can be described as comprising several key attributes: 1) it uses daylight as the primary source of daytime illumination to accommodate the occupants' visual demands, 2) it is experienced as a visually and thermally comfortable place, 3) it is connected to outdoor phenomena and 4) it persistently maximizes electric lighting energy savings while minimizing peak energy demand (Wymelenberg 2008). Over the past four decades, many studies have highlighted the multiple influences of natural lighting on human beings. These impacts can be either purely visual (such as visibility, aesthetic judgment) or non-visual (impact on chronobiology, mood, cognition). 2.
(15) (Sutter et al. 2006). There are three ways for studying these impacts of daylighting: real world research, 3d reproductions such as scale models and 2d reproductions like virtual images and photos (Lau 1972).. 1.1.2 Wood environments and Biophilia Research into people’s choice of environments led to important progress in identifying positive environments. People in industrialized countries spend more than 80% of their time in indoor spaces (Leech et al. 2002). Since the industrial revolution and the growth of urban areas, the activities of human beings are increasingly restricted to indoor environments (Küller 2004). It is therefore beneficial to take into account the effect the indoor environment on human health, comfort and their demand for energy. Several researchers claim that people's health is partly affected by ambient lighting (van Bommel van den Beld & 2004; Boyce et al. 2006). Meanwhile, some other researches show the importance of materiality of indoor environment on improving physical and mental health of the users (Kelz et al. 2011, Tsunetsugu et al. 2007, Fell 2010 and Fell 2002). In the search for positive environments, nature appears as a constant theme. A connection with nature, even in the modern world, is critical to people’s physical and psychological wellbeing. Unfortunately, modern society increases the disconnection from nature (Kellert et al. 2008). One of the areas where this increasing separation from nature is reflected is through the modern built environment. This is especially problematic because people spend more than 80% of their time within buildings (Harijaona et al. 2009; Wymelenberg 2012; Veitch 2013), a reality that is even more critical during winter in cold climates. There are several ways of emphasizing a feeling of nature inside the built environment. Biophilia design addresses the deficiencies of contemporary building and landscape by establishing a new framework for satisfying experience of nature in the built environment (Kellert et al. 2008; Kellert 2005; Kellert and Finnegan 2011; Browning et al. 2014). Kellert and Calabrese (2015) categorize these challenges into three sections. First is through the direct experience of nature, which refers to actual contact with environmental features in the built environment including natural light, air, plants, animals, water, and landscapes. Second is. 3.
(16) via an indirect experience of nature, which refers to contact with the representation of nature including pictures, artwork, and natural materials such as wood furnishing and wooden fabrics. And finally, the experience of space and place refers to spatial features characteristic of natural environment such and complexity, mobility and way finding.. 1.2 Problematic In architectural daylighting studies, most researches have been conducted in office buildings on occupants’ behavioral patterns and their visual preferences. The importance of such topic is unquestionable due to the fact that more than 50% of the workforce in western societies works in offices (Redlich et al 1997). But more attention is needed to dedicate toward other contexts such as residential and educational environment. More particularly, there is a need to explore perceptual aspects linked with daylighting and wood materialities in other types of spaces to offer generalizable results applied to architecture. In this research an unfurnished room is chosen so that the results can be generalizable for different contexts such as office, study room, kitchen or even a living room. In modern architecture, white spaces have been regarded as most efficient in distributing dayligting, but it also appears that the use of natural material such as wood should provide additional qualities on the visual aspect of a space. The challenge of designing effective daylighting ambiances varies according to local climate conditions. Where there is a lower availability of direct sunlight such as in Nordic and cold climate countries, the impact of other parameters, including the materiality of interior surfaces, becomes more critical. Overcast skies are a critical consideration for daylighting strategies implemented in spaces located in northern latitudes, such as Canada. In Quebec City, overcast to partly overcast skies are dominant, and occur 63% of the year (Demers 2001). It is therefore important to study the effects of materiality of wood under the critical but characteristic conditions of the diffuse light, while still including the clear sky condition in order to cover different sky conditions throughout the year (Jafarian, et al. 2016).. 4.
(17) Daylit buildings can offer not only qualitative but also quantitative benefits. In the Canadian commercial building sector, electric lighting accounts for 21% of the total energy consumption and 38% electricity consumption (NRC, 2013). This presents a remarkable opportunity for good daylighting design to drastically reduce building energy use (NRC, 2013). Beside the potential economic and non-energy related benefits of daylighting, such as psychological and physiological impacts on building occupants, there are other parameters, notably materiality of indoor coatings that previous researches did not address. There are very few researches relating wood coatings in relation to daylighting. Based on preliminary work, it is appropriate to say that daylighting distribution is directly linked with the location and luminance of surfaces. In particular, dark surfaces with low luminance generally produce problematic daylighting condition, especially when located on the ceiling surface (Lam, 1986). There are, however, only very few researches that explore the impact of surface coating properties such as gloss in conjunction with a dark wood stain. Most researches relate to highly demanding tasks (such as reading and writing), and very few explore wood coatings in relation to ambient lighting, which offers a wider range of opportunities without penalizing the energy demand for light. Previous researches (Fell, D. R. 2010; Sakuragawa, S. 2005) indicate that the use of wood can improve thermal comfort, acoustical isolation, health and wellbeing of the occupants in interior environments while considerably reduce the impact on climate change. Yet, research on the impact of wood inner coating on daylighting and visual comfort and ambiances in architectural spaces is still limited. Although impacts of wood on enhancing physical and mental health of buildings’ occupants are nowadays recognized, research on the effect of indoor wood material on visual comfort and energy efficiency on an interior ambiance is limited. This research therefore explores visual comfort and energy efficiency of a daylit wooden ambiance. Visual comfort is reached when objects can be seen clearly, without tiredness and in a pleasantly colored environment (Wymelenberg, 2009). A visually comfortable environment supports the well-being of buildings’ occupants and their productivity. On the opposite, a too weak lighting or a too extremely lit space favors tiredness. In the long term, or sometimes sooner, these spaces can cause tiredness and other. 5.
(18) eyes problems, accompanied by a feeling of discomfort and a reduced visual performance (Wymelenberg, 2009). Due to the great variability existing between individuals as to when they start to perceive a bright surface as disturbing, this research evaluates visual comfort quantitatively by comparing brightness and contrast, as well as color temperatures of the space. This research analyses quantity of daylighting by comparing the following variables: Daylight Factor (DF), daylight pattern and false color images of different room concepts. The materialities of surfaces will vary in colors and finishes and relate to the impact of three types of various stain namely Oak, dark Walnut and Cape Cod Grey with two coating glosses (high gloss 90% and low gloss 12%) studied carrying a physical model. The proposed research is a first step in a better understanding of the relation between materialities of wood and daylit environment on energy saving potential. It moreover offers considerable advantages acknowledging the importance of wooden daylit ambiances on creating a visually comfortable environment. Focusing on these aspects is feasible through an experimental research that seeks to create a visually comfortable and energetically efficient daylit ambiances.. 1.3 Objectives 1.3.1 General The main objectives of this research are twofold. The first objective is to study the quantity of natural light distributed within a wooden space in relation to the ratio and type of wood finishing system used inside the interior environment. This objective enables studying the impact of materiality of wood on distributing the daylight within the space, a critical factor due to the increasing importance of sustainable design in architecture. The second objective is to increase visual satisfaction within an architectural ambiance in relation to wood. For this purpose, the effect of different quantity and quality of wood is investigated. 1.3.2 Specific Specific objectives of this research are:. 6.
(19) - Determine and compare the impact of different types of wood stain on quantity of daylight distributed within the space and its color temperature. - Analyzing the relation between wood position and its impact on color temperature of the space, daylight pattern and daylight factor (DF). - Studying the effect of wood coatings on the perception of space in relation to its brightness and contrast - Evaluating the impact of sky condition on enhancing color temperature of a wooden space.. 1.4 Hypothesis This research hypothesizes that the visual richness of wooden spaces in the presence of natural light increases the quality of interior ambiances as well as the quantity of daylight being distributed within the space. This research looks into the effect of adding wood surfaces to a space on the overall daylight distribution and the potential energy demand (Chapter 4). It seeks verification of the following assumptions in connection with the research questions mentioned below: 1- The type stain on wood influences the perceived atmosphere. 2- The position of wood influences the quality of the space. 3- The quantity of wood used affects the quality of the space. 4- The sky condition influences the quality of the space. The study consists of three groups of fundamental questions in relation to space: 1. Does the quality of the space vary by changing the position of wood? Or by using different color of stained wood? 2. Does the color of the space changes according to the position and type of wood? Or by using different quantities of wood? 3. Does the quantity of daylight decrease by using dark color wood? Does it vary by changing the position of wood?. 7.
(20) Chapter 2. Theoretical Context The research investigates the effect of wood on visual comfort within an interior space. Although the impacts of wood on enhancing physical and mental health of buildings’ occupants have become known, research on the effect of indoor wood material on visual comfort and energy efficiency of an interior ambiance is limited. This research therefore addresses the notion of visual comfort, which consists of a subjective impression related to the quantity, distribution, and quality of light. When addressed, it could lead to a decrease in external energy demand such as electrical lighting, and help in creating an energyefficient ambiance. In addition to understanding the impacts and uses of daylighting from the quantitative point of view, a qualitative perspective, which includes analyzing color, plays a large role in determining how daylighting emphasizes visual ambiances in buildings. Brightness, contrast, glare, color are design issues, which produce effects on visual comfort in interior workspaces under natural light. The present research also considers the effect of brightness and contrast and color on visual comfort of wooden spaces. The following sections address the main theoretical aspects of the research context. It is divided as followed: the first part relates to visual comfort in regard with brightness, contrast and color. It discusses those visual parameters related to comfort and provides information relevant to the analysis of color and light with particular emphasis on the CIE Lab system.. 2.1 Qualifying aspects of daylit ambiances 2.1.1 Visual comfort Visual comfort is an essential human need that can affect task performance, health, safety, mood and atmosphere. It describes the overarching subjective performance of visual quality within buildings. Visual comfort is reached when objects can be seen clearly, without tiredness and in a pleasantly colored environment (Wymelenberg and Inanici 2009).. 8.
(21) Absence of glare is one of the key parameters to reach visual comfort within a lit environment. Due to the great variability between individuals as to when they start to perceive a bright surface as disturbing, this study evaluates visual comfort quantitatively by comparing glare indices and also qualitatively by comparing brightness and contrast, as well as color temperature of the space. In this research, visual comfort of an architectural ambiance is studied in terms of its luminance diversity, brightness and color of the space. These items are studied regarding the quality and quantity of wood used within the space. Visual comfort within a daylight ambiance is separate from daylight sufficiency. For example, varying occupants can report high levels of visual comfort while receiving the same amounts of daylighting. Therefore, visual comfort is also a biophysical metric dependent on the occupant’s perception and encompasses a wide variety of visual and environmental factors such as: color, brightness, contrast, direction of light source, view size, view quality, materiality of indoor environment, light uniformity, and even thermal and visual comfort conditions can affect visual comfort (Boyce et.al 2003). This research addresses visual comfort in relation to materialities of wood within an interior ambiance. Knowing these impacts should help designers and architect to create delightful ambiances. Currently, visual comfort data is best captured by occupants’ surveys. There are two types of surveys: photometric surveys are based on using measuring equipment and human surveys, are linked to perception by using questionnaires, soliciting feedbacks from those who actually utilize the space. Human surveys using questionnaires are the most direct method for acquiring visual comfort information. However this type of data can be timeconsuming to collect, can be socially compromising to occupants, and requires that the building already be built and occupied. Although the scope of the present research does not allow for both approaches (photometric based and questionnaire-based surveys), this thesis is based on calibrated photometric surveys. Further developments of the present thesis should look into these aspects. Photometric survey conducted within existing buildings may be the best method for data acquisition but for new projects, predictive models are more effective, either physical or. 9.
(22) computer-based, to simulate actual building conditions for building design. Many researches have gone through exhaustive lengths to define and quantify the subjective sensation of visual comfort, and of the numerous models used to simulate visual comfort, the subject of glare has attracted by far the most attention (DiLaura et.al 2010). This thesis evaluates visual comfort qualitatively by comparing brightness and contrast, as well as color temperature of the space (Chapter 4). Among the glare indices driven from most measurement systems, Visual Comfort Probability (VCP) and Daylight Glare Index (DGI) evaluate glare caused from large sources such as the sun, while Unified Glare Ratio (UGR) is valid for small glare sources. The visual comfort probability (VCP) system evaluates lighting systems in terms of the percentage of the observer population that will accept the lighting system and its environment as being comfortable (Light Guide, 2012). Daylight Glare Index (DGI), however, is developed by Hopkinson, and Table 1 shows the scale for DGI proposed by Chauvel et al. (1982) to evaluate glare. According to this scale, DGI values greater than or equal to 26 represent an uncomfortable space. Table 1: Daylight Glare Index Scale (Chauvel et al. 1982) Glare Criterion Just perceptible Just acceptable Just uncomfortable Just intolerable. Daylight Glare Index (DGI) 16 20 26 28. 2.1.2 Brightness Brightness is perhaps the simplest of the visual sensations [Gregory, 1972]. The term brightness therefore usually refers to the strength of sensation resulting from viewing surfaces of spaces from which light comes to the eye (IES, 1984, p. 1.20) and is partly determined by conditions of observation such as adaptation. In fact, the brightness obtained by a given intensity depends on the state of adaptation of the eye, and on various complicated conditions determining the contrast of objects or patches of light (Hopkinson 1970). Brightness is a subjective impression of the appearance of a light source or an. 10.
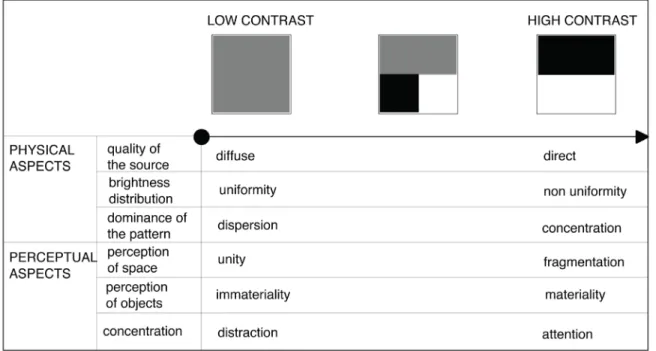
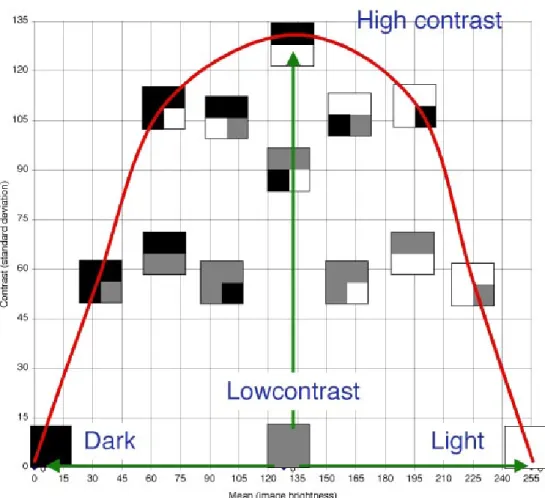
(23) illuminated surface. Quantitatively, the measure of this impression consists in the luminance of the light fixture source or task surface in terms of candelas per square meter. In terms of visual comfort and according to the Illuminating Engineering Society of North America (IESNA 2009), surfaces should not have extremely different brightness. Qualitatively, brightness is important in relation to space, not only in comfort terms but also because it is the most striking character of a space, which may describe the visual sensation associated with very dark versus bright ambiances. It is possible to measure the lighting levels of a space and compare it with other spaces, but this can become a long process and need specific meters that one does not necessarily carry all the time. In this research, histograms are used to analyze the distribution of pixels of certain brightness on an image, a process described in (Chapter 4). When using the image analysis process of brightness separation (refer to Chapter 4) it is possible to obtain a robust histogram of its brightness content, enabling a more global assessment of the grey level dominance and compare it to other images (Demers, 1997). Challenges of brightness perception in relation to wood surfaces should also relate to wood surface color and coatings (Chapter 4).. 2.1.3 Contrast. Architecturally, contrast of light and shade define surfaces and contribute to the character of a space, a question related not only to light and shade patterns, but also on the nature of the different sources of light and surrounding surfaces. The introduction of contrast as a global integrator of the quality as well as the quantity of light is therefore presented as a means to classify different types of light (Demers 1997). Four main factors that affect this ability to see are luminance, time, size and contrast. This research uses Demers’ daylight classification (Demers1997, 2007) to study the brightness and contrast patterns, which initiated the use of images as a qualitative assessment of light in space. The classification system categorizes images of interior architecture by plotting the mean brightness of each composition against the standard deviation of its luminance values. This method is useful in. 11.
(24) creating an early schematic design tool for comparing contrast-driven architectural types, as well as providing us with comparative data on the luminous composition of a single space under varied lighting conditions. It produces a typological language to codify lighting ambiances, a schematic scale of contrast (Figure 1), which identifies related perceptual aspects that have been recognized in association with the general visual appearance of space by scientists and architects (Demers 2007). Other studies that employed the use of similar greyscales to conduct daylight quality research in simulated and real spaces or photographed views include Newsham, et al. (2002 & 2005) and Vogels (2008).. Figure 1:Schematic scal for image classification (Demers 2007). Figure 2 shows how the classification system may be used to compare images from dark to light and low to high contrast. In the present research, the classification will be useful to manage a large array of data acquired for the series of images assessed during the experimental process to compare the effect of globally observed contrast from images of different wood installations (Chapter 4).. 12.
(25) Figure 2: Ranges of brightness and contrast values of daylight classification system (Demers, 2007).. 2.1.4 Color Daylight has the ability to emphasize textures, and structural features of a space, producing sometimes intricate patterns in architecture, and even minimalist and uniform compositions. These attributes are important in the elaboration of an aesthetic description of a space. Color and luminance patterns of different surfaces are also responsible for interaction with light and the perception of visual details in architecture. Color is a sensation that translates the impression received by the human eye in the form of electromagnetic energy (Chrisment 1997). The perception of color consists of a psychophysical phenomenon; it is therefore subjective and cannot be measured with exactitude. Although influenced by individual perceptions, it is, however, possible to assess the color distribution on surface of a space, and even in an image. There are several systems. 13.
(26) to describe and measure color, but the most recognized in terms of daylighting is the CIEL*a*b* system. The CIEL*a*b* has the advantage to measure the perceived lightness which associates with light, and include all perceivable colors. (CIE 1976). It is a. commonly used standard system which is dedicated to the study of the color using the parameters of L*, a* and b*. L* is the lightness of the color (0 perfect black, 100 pure white), a* refers to the position color between red (+100) and green (-100) and b* defines the position of the color between yellow (+100) and blue (-100), as illustrated in Figure 3. The combination of these parameters are chromatic coordinates the results in a vector in the L*a*b* system. Values a* and b* in this system indicate the temperature of the image. Positive values refer to red/yellow and negative values refer to green/blue. Therefore, higher a* and b* values indicate a warm environment while lower a* and b* value point to and colder color and environment (CIE 1976).. Figure 3: CIEL*a*b* color space showing the axis a*, b* and L*. Source Baardseth et.al 1976.. In this research, the CIE L*a*b* classification system will enable the assessment of the impact of direct and diffuse sunlight on color temperature of the space. For instance, a* and b* values are affected by the type of wood and its position in space, as studied in Chapter 4.. 2.2 Quantifying daylighting- Lighting simulation and measurements. 14.
(27) Daylighting offers tremendous potential for reducing the energy consumption of electric lighting. Artificial lighting is a substantial consumer of energy in non-domestic buildings. In offices it can account for as much as 50% of electricity consumption, and if the building has a deep plan it may use more energy than the heating does (Building energy efficiency standards 2008). The potential for savings through daylighting is affected by location, climate, orientation, building use and building shape. The behavior of the people who will use the building is another variable to be considered in relation to daylighting. However, in the current study, and in order to simplify the situation discussed in section 1.2 (also refer to chapter 3 for methodological considerations), the simulation model should consist of an unfurnished room without particular neighboring buildings and surroundings. Such type of study also corresponds to the absence of scale that the modeling of light offers, and has been previously performed in previous researches such as Demers (1991). Indeed, under a real sky, daylighting modeling is independent of the scale of the space, provided that the configuration and materials are identical. Moreover, the intensity of daylight varies throughout the day. To address this issue in a way that results can be comparable, this research is considering a CIE standard overcast sky for the simulation model. The CIE Standard Overcast Sky Distribution corresponds to a typical day when the sky is covered with clouds and the atmosphere is relatively clear. This type of sky is the typical sky condition in Nordic and cold climate countries. In this section, the fundamentals of architectural lighting simulations, measurements and visualization is discussed with a focus on the interpretation of the results. The goal of architectural lighting simulations is to effectively and accurately predict the lighting distributions in a space. Determining lighting information greatly helps architects to employ electric and daylighting strategies that support visual comfort, performance and human well-being along with significant energy savings. In order to ensure the use of lighting simulations in an efficient and accurate manner, it is necessary to understand the techniques and science behind the simulation methods. This section introduces the foundations of architectural lighting simulations by discussing the typical operations and methods involved. The aim of the following sub-sections is not to provide an exhaustive list of the available. 15.
(28) lighting software. One such list can be found at the Department of Energy directory (2012). The primary focus would rather be to introduce the advantages of the well-recognized Radiance software program for lighting simulations (Ward 1994, 1997) and Photosphere for high dynamic range (HDR) Photography. The choice of these software programs is based on validation studies carried by researchers and the relatively higher usage among professionals, which has previously been discussed in details by Inanici (2004, 2005). Photolux photo-lumiancemeter, derived from HDR photography is also discussed.. 2.2.1 Lighting simulation and daylight factor. A daylight simulation is a computer-based calculation which aims to predict the lighting. situation in a building under a specific daylight situation. Advances in Computer Graphics have enabled performing advanced lighting simulations and 3D renderings. Not only does the modern 3D rendering software recreate visually pleasing computer images, but the images could also predict with accuracy, daylighting pattern within a space. A daylight simulation program requires information on the building and sky condition. The result of such analysis shows indoor luminance/illuminance distribution. The main advantage of such simulations is its flexibility. As an example, it may be time consuming to perform a year round experiment using measurement techniques to derive sun and sky models. Lighting simulations hence are a quick way to predict performance of the building under any predefined condition through the available high speed computing frameworks currently available. However, the user should understand the underlying assumptions and approximations to effectively utilize such tools. The result from a computational daylight simulation is displayed either illuminance or luminance based daylight metric (Inanici, 2004). As this research did not consider the neighborhood and landscape that could partly obscure daylight in real life, and since it is looking for daylight distribution under an overcast sky, the illuminance and luminance based daylight metric chosen is the Daylight Factor (DF).. 16.
(29) 2.2.1.1 Daylight factor The Daylight Factor (DF) is the most widely applied daylight metric as a result of its ease of use and relatively low cost to measure or simulate. This metric is the only widely accepted, quantitative performance measure for daylighting, that applies for different building designs and accordingly have the capacity to influence design choices. Building geometry, surrounding landscape, surfaces properties such as color reflectance and gloss are the building components that have an impact on the daylight factor. On a practical level, daylight factor has the advantage that its predictions are intuitive and easy to communicate within a design team. However, there are some limitations with daylight factor uses such as the fact that it does not address facades orientation, building location, variable sky conditions, seasons and time of the day since it relates to the overcast sky condition. Also, it does not anticipate glare problems (Rienhart 2006, Mardaljevic 2001 and 2009). For this latter limitation of daylight factor in relation to glare, there is a common argument used by proponents of the daylight factor is that the reference overcast sky corresponds to the worst case sky condition in terms of daylighting quantity. Therefore any other sky will usually lead to more daylight in the space. The DF metric is used in chapter 4 to compare the results. Recommended minimum daylight factors for spaces of some building types are shown in Table 2. Lower daylight factors may be perfectly satisfactory for subsidiary spaces such as circulation areas and uses that do not need specific task lighting. Table 2: Recommended minimum daylight factor (Kauffman, 2008). Building Type Church Hospital ward Office Classroom Factory. Daylight factor (%) 1% 1% 2% 2% 5%. The daylight factor at any point on a working plane is calculated in terms of light coming directly from the sky (the Sky Component), light reflected from outside surfaces (the Externally Reflected Component), and light reflected from surfaces within the room (the Internally Reflected Component). Calculations are generally based on a model sky, such as. 17.
(30) the CIE Standard Overcast Sky (DeKay & Brown, 2014). Daylight factor distributions can be plotted for any space or set of spaces at the design stage. With this information, it is possible to estimate the percentage of the working year during which daylighting alone will meet the needs of the building’s occupants (Wymelenberg 2012). 2.2.2 Image based lighting While it is common to use computational simulation methods, the results of such methods do not represent real world lighting conditions. To adequately consider daylight variations, photography of the building’s surroundings may be used as the source of illumination for the scene where each pixel is treated as a light source. This method is known as Image based Lighting (Debevec 2002). According to Evans (1959), a properly exposed image is a direct record of the amount of light to which each area has been exposed. Image based lighting method uses HDR images as a source that contain information about the shape, color, and intensity of direct light sources, as well as the color and distribution of the indirect light from the surfaces in the scene. Therefore, one can use HDR images to accurately render and simulate how objects and environments would look if they were illuminated by light from the real world (Reinhart et, al 2005). 2.2.2.1 High Dynamic Range Photography Digital photography has been the subject of important developments and improvements during the past decade, offering support for recording lighting patterns in space and making it an ideal tool for research and practice. New digital cameras integrate a multi-reading pose-meter that grants more accuracy and flexibility in the evaluation of the correct exposure of photographs. The ideal digital camera used for acquiring visual data should therefore be chosen in relation to level of desired procedure to ensure valid analysis (Demers 1997). It is important to relate to the procedure as it determines the level of lighting obtained in the images. Photographic methods can be used to capture scene lighting information with benefits of lower cost, wider field of view, high resolution and ease of usage. Single images (of lower dynamic range) are limited by the amount of information that they can represent. HDR photography technique has emerged as a high resolution, low cost and flexible measurement technique to capture luminance values of a scene. Per-pixel. 18.
(31) values of HDR images can represent the luminance level of the measured point of the scene. Hence, HDR images gather detailed information that can be used to perform quantitative and qualitative lighting analysis. In order to capture High Dynamic Range images with a standard camera, multiple exposures of the same scene are taken and combined using specialized software such as Photolux and Photosphere. The output of this process is a HDR image file or a luminance map. The flexibility of per-pixel HDR images in conjunction with image processing functions is extremely valuable. Specific regions of interest such as vertical and horizontal task areas, windows, the ceiling, individual walls and other key surfaces can be analyzed individually by defining various masks. Process of applying this method for the present research is discussed in section 3.2.1. In order to visualize HDR images faithfully, the display must enable a realistic rendering of HDR images that can mimic the human visual system. Owing to the limited capabilities of display devices, HDR images have to be compressed to fit in the limited display depth. An alternative to visualizing HDR images in its native RGB format is using a false color representation. False color images represent the image as varying intensities of various colors. The measured quantity in false color images from lighting simulations may record luminances or illuminances. It must be noted that false color images are merely visualizing aids for the light intensity distribution and do not describe the color properties of the HDR image.. 2.3 Analysis Tools and metrics for lighting simulations The following consists of a discussion of the commonly used tools for architectural lighting analysis and simulations. It includes as well as a review on specialized softwares (Photolux and Photosphere) used to visualize and combine HDR images. This section is not intended to be exhaustive or serve as a manual for operating the tools 2.3.1 Ecotect Ecotect is a useful tool for early design studies that quantify daylight factor and visualize. 19.
(32) light rays. However, its native daylighting engine is not accurate enough to be used beyond early conceptual design. This tool is an intuitive 3D modeling with features analysis of solar, thermal, visual, acoustical which information may eventually translate into energy costs. Ecotect is one of the few tools to assess performance analysis that is simple to use, relatively precise and above all, visually effective (US Departament of Energy, 2010). It was developed by Andrew Marsh in 1996, the software was acquired by Autodesk in 2009. It has built-in connections with more sophisticated tools like Radiance. The advantage of such tool is its relative accessibility and ease to convert 3D models into daylighting analysis. Moreover, the simulation model is linked with Radiance (Crawley et al. 2008). 2.3.2 Radiance. Radiance is a well-recognized software package that is widely used by lighting designers. and architects for the purpose of modeling (and translating) scene geometry, physically based material properties, daylighting and electric lighting properties and to simulate and visualize luminous environments. Radiance also includes tools for manipulating images and converting them into various formats. It offers the advantage to produce luminance maps, which can be used to analyze glare problems and daylighting patterns (Hong et al., 2000).. 2.3.3 Photosphere. Photosphere is a software application that may be used to build an HDR image from a sequence of JPEG images, browse through collections of HDR images or calculate a. camera response curve. In addition to these functions, Photosphere allows the user to perform HDR image corrections such as lens flare removal, ghost removal, image alignment and exposure adjustments (Ward et al 1997). Photosphere also includes several useful HDR image analysis tools for performing further processing. Features such as image zoom using resampling, image crop, histogram (based on RGB as well as Luminance values), and visualizing HDR image using false color images have been included in a user friendly software interface. Photosphere allows saving the HDR image in various formats such as TIFF, Radiance RGBE, EXR and JPEG HDR. 20.
(33) formats. A calibration procedure in Photosphere allows fine-tuning of luminance values, a measured luminance value of the scene. These luminance maps are very similar to those produced by Radiance, but are hereby taken through photography of a physical model of a real space instead of a tridimensional digital simulation. The pixel values in the resulting images can correspond to absolute luminance quantities in cd/m2 1 (Kumaragurubaran 2012). False Color images are an alternate representation of pixel data for HDR images. Since the range of pixel values cannot be accommodated by conventional display devices or print media, an equivalent representation using colors and varying intensities are used. False color images are useful to visualize the luminance distribution patterns in the built space, to understand the absolute luminance values for each pixel, and dynamic range of luminance values within a scene (Kumaragurubaran 2012). 2.3.4 Photolux photo-luminancemeter system The Photolux software is part of the photo-luminancemeter system that produces from one or more photos (with different exposures) to create a luminance map providing a quasicontinuous representation of the luminance of a scene. It consists of the similar HDR technology used in Photosphere, but with the advantage of being calibrated. The digital camera images combined with the Photolux software provide a very easy and standardized method for collecting an enormous amount of data about the daylight characteristics of a space. Photolux automatically generates certain statistics about the image, such as UGR (Unified Glare Rating), DGI (Daylight Glare Index) Minimum, Maximum and Average luminance are described in detail in Annex A (Cantin, 2008).. 1 The candela per square meter (cd/m2) is the unit of luminance. The unit is based on the candela, the unit of. luminous intensity, and the square meter, the unit of area. As a measure of light emitted per unit area, this unit is frequently used to specify the brightness.. 21.
(34) Chapter 3. Methodology Previous research has confirmed that the evaluation of daylighting ambiances using a physical scale model was an appropriate solution that offered adequate levels of realism and detail (Arsenault 2012, Bodart 2006 and Pineault et.al 2009). Scale models and computational software are fast, inexpensive ways to study daylighting, which supplement each other. Therefore, while computational software enables studying different wood configurations in a relatively short period, scale models provide a simple means of changing one or more variables at a time allowing the examiner to compare visual aspects, and it also enables studying complex variables of light under real sky conditions. This research was thus performed using a scale model in conjunction with the computational software Ecotect. Another important advantage on experimental research using a scale model is the ability to evaluate multiple samples (in this case different types of wood) while in real environments, changing settings may be more complex and costly. Furthermore, previous study shows that a scale model 1:10 would achieve similar results to those obtained using a scale model 1:1 in terms of daylighting patterns and the quality of the daylighting ambiances (Lau 1972). Most researches in the field of architectural daylighting have been conducted in office buildings, and few researches relate to the impact of daylight ambiances in other building types (Pineault 2009). The scale model used in this study was constructed without furniture and other space customization elements so that the results could be generalized for several building types. Light has no scale, which enables a validation of the modeling for a wide array of uses. The proportion of the space has been devised so that it could represent various usages, from an office typology to a living room. The scale model measures 70 cm x 30 cm x 100 cm depth by height by the width. This research was conducted in the Kruger building at Laval University, particularly because of the availability of the immediate access to the exterior, which facilitates the measuring and data collection processes.. 22.
(35) The first phase, which occurred during September 2014, had as the main objective to test and validate the experimental protocol under clear sky. This phase was conducted using same dimensions of the scale model as for the real experiment and 3 sheets of paper, which represented 3 colors of wood. The method was then adapted to conduct the experiment a second time (November 2014) with larger number of wood room concepts and two different sky conditions.. 3.1 Using a reduced scale model Scale modeling provides a simple means of changing one variable or more at a time, allowing the examiner to visually compare several visual aspects and daylighting conditions between different wood configurations. While smaller scale models are used to evaluate the exterior shading, building massing and siting issues, larger scale models are required for interior evaluations and quantitative measurement (IESNA 8-20). Therefore, the model was built at a 1/10 scale, which is recommended to study diffuse and direct daylight penetrations by many researchers (Arsenault 2012: Bodart 2006). It should be, however, mentioned that daylighting results are not scale dependent, which means that daylight penetration within a space depends on the proportion of the space and not its scale. There are three ways for studying daylighting: research may collect data within the existing context at its full scale, 3D reproductions using physical, scale models and 2D reproductions such as virtual images and photos (Lau 1972). Figure 4 shows the reduction in information as we evolve from a real existing context to 2D reproductions. This research uses physical modeling 1:10, and data acquisition tools consist of a calibrated photoluminance-meter (Photolux system) equipped with a fish eye lens as well as computational software to analyze the HDR images.. 23.
(36) Figure 4: Representation of the reduction in information content in the experimental research. This figure is adapted from Lau (1972).. Regarding the use of a scale model, 3 types of details have been verified for this research. These details are view points, window wall frame and type of glass. These are discussed below. 3.1.1 Viewpoint The location of the viewpoint within the model is important in relation to the data acquisition systems, which relies on image analysis. The window is located on the largest wall whereas the position of the camera is proposed on one of the shortest walls to provide a wider view of the interior space as shown in Figure 5. To choose the exact position of the camera, several photos with different positions have been captured. Looking to the space through one of the shortest walls is the best way to study daylight distribution from window to the end of the space, resulting in a balanced view, as shown in Figure 5. Moreover, this viewpoint enables studying daylight patterns for the most relevant wood surfaces of the space, as discussed below. . Horizontal position of the camera The central viewpoint (Figure 5 top) generates an equal area of viewed surfaces of sidewalls on images, while the right side emphasizes one of the sidewalls (Figure 5 bottom) and produces an exaggeration of the perspective.. 24.
(37) Figure 5: Horizontal location of camera - central and side viewpoints. Vertical position of the camera While the central viewpoint provides equal values to floor and ceiling surfaces, the upper location of the viewpoint emphasizes the area of the ceiling and decreases the information obtained on the floor. The lower viewpoint emphasizes the view of the floor and decreases the information from the ceiling Figure 6. 25.
(38) Figure 6: Vertical movement of camera - central and side viewpoints. Therefore, a central viewpoint is chosen for the research, which enables studying all surfaces with the same relative value of surface exposition to the viewer. This viewpoint does not visually emphasize any of the surfaces and therefore provides information that is generalizable.. 3.1.2 Choosing the Wall frame The wall frame consists of 7 studs, which provide more strength as well as giving shadows to the space. This section focuses on the effect of window wall-frame on daylight distribution. Different scenarios are selected for this part of the research using a preliminary physical model analysis. In the first scenario, the effect of window wall-frame on the quality of the space is studied (Figure 7). This figure shows that installing different types of wood on this surface have an impact on the way the space is observed. For instance, in the Walnut stained wall frame room concept (figure 7) the contrast between the. 26.
Figure


+7


Documents relatifs
rosebushes of the UPOV reference varieties for flower number (‘Meichim’, ‘Kolima’, ‘Sweet 188.. Promise’ and ‘Meiburenac’) during the first flowering period, on
The present paper consists in replicating Repp and Crowder’s (1990) neutralisation hypothesis according to which the auditory trace left by the first vowel in a
Then to cope with the loss of regularity of the perturbation with respect to the background state due to the degeneracy of the equation, we apply the Nash-Moser-H¨ ormander iter-
The measure of delay can be obtained by different manners according to the aimed application, for example from the comparison of reference and degraded signals (if synchronized) by
(3.2) In order to establish the global existence of a solution of the Hall-MHD system in the case of small data, we shall first prove the corresponding result for the extended
VFOA BEHAVIOUR GENERATION MODEL VFOA Turns, Duration and Schedule Predictor Speaker Previous Speaker Previous Addresee Participant List Addressee NAO 756 Others 550 Final
Today, such ‘ambiances of the new’ are crafted by movements of opposition and construction which pursue an ‘horizontalist’ activism (such
By discussing the construction and manipulation of ambiances in Birmingham, UK from a gendered perspective, this paper demonstrates how urban
