Modeshapes recognition using Fourier descriptors: a simple SHM example
Joseph Morlier (ICA), L. Mevel (INRIA)
ICA
ISAE - Institut Sup´erieur de l’A´eronautique et de l’Espace, TOULOUSE, FRANCE This research was fund by EPICEA project (SAPES composites).
January 2012
Joseph Morlier (ICA), L. Mevel (INRIA) IMAC2012 1/ 26
Plan
1 Main objectives
2 Damage localization
3 Fourier Descriptors
4 A simple SHM example
5 Conclusion
Joseph Morlier (ICA), L. Mevel (INRIA) IMAC2012 2/ 26
Easy Classification of modeshapes
SP approach
Nowadays a large amount of modeshapes data is available Laser/optical measurements at high resolution
But we still use The MACa, why ?
aMAC (Modal Assurance Criteria), is only a vector correlation representing modeshape similarities
Joseph Morlier (ICA), L. Mevel (INRIA) IMAC2012 3/ 26
Nodal Lines
MAC index carries no explicit information on shape features. A new technique, based on the well-developed paradigms of Image Processing (IP) and Pattern Recognition (PR) is considered.
This new method is developed to provide a set of features (Fourier Descriptors) for comparing modeshapes with ”local” similarities of higher interest (MAC= ”global” similarities) using Nodal Lines.
=⇒These lines are able to characterize modeshapes very easily. So when damage occurs, we are able to track the few descriptors changes to localise the damage.
=⇒Simple plate example demonstrates the damage localisation skills of this new method (through several damage scenarii).
Joseph Morlier (ICA), L. Mevel (INRIA) IMAC2012 4/ 26
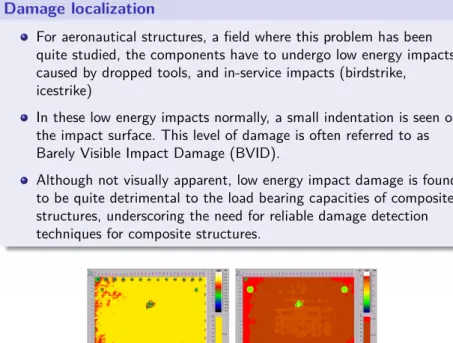
Damage localization
For aeronautical structures, a field where this problem has been quite studied, the components have to undergo low energy impacts caused by dropped tools, and in-service impacts (birdstrike, icestrike)
In these low energy impacts normally, a small indentation is seen on the impact surface. This level of damage is often referred to as Barely Visible Impact Damage (BVID).
Although not visually apparent, low energy impact damage is found to be quite detrimental to the load bearing capacities of composites structures, underscoring the need for reliable damage detection techniques for composite structures.
Figure:NDT results
Joseph Morlier (ICA), L. Mevel (INRIA) IMAC2012 5/ 26
References
The main hypothesis in this work is that the modeshapes are acquired using very fine spatial resolution.
According to well known theorem sampling theorem, [Stubbs and Park] and then [Schulz et al. ] address the issue of damage resolution as a function of spatial distribution of sensors.
Optimal sampling theory [Sazonov and Klinkhachorn] to estimate high resolution mode shapes taking into account experimental noise and enables to evaluate even small damages.
Wavelets approach [Lee, Morlier, Rucka ...]
Figure:Maxima of wavelets by [Rucka et al]
Joseph Morlier (ICA), L. Mevel (INRIA) IMAC2012 6/ 26
Modeshape comparison
In SHM, methods based on modeshapes (or curvature) suffer of apparition of numerous false damages.
It’s not easy to classify them directly.
The main idea is to compare Features ”compressed” of modeshapes (approximation + details) through the Fourier Descriptors
Joseph Morlier (ICA), L. Mevel (INRIA) IMAC2012 7/ 26
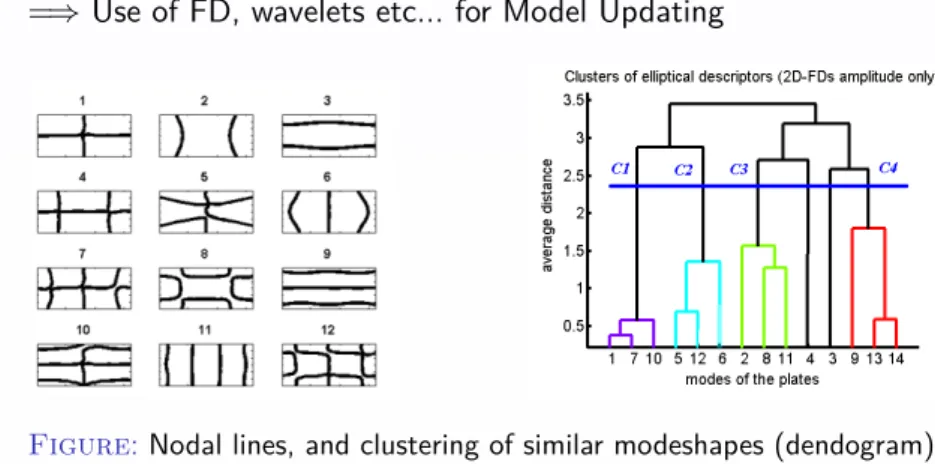
Wang (University of Liverpool) was the first to try to enhance the MAC
=⇒Use of FD, wavelets etc... for Model Updating
Figure:Nodal lines, and clustering of similar modeshapes (dendogram) from FD analysis
Joseph Morlier (ICA), L. Mevel (INRIA) IMAC2012 8/ 26
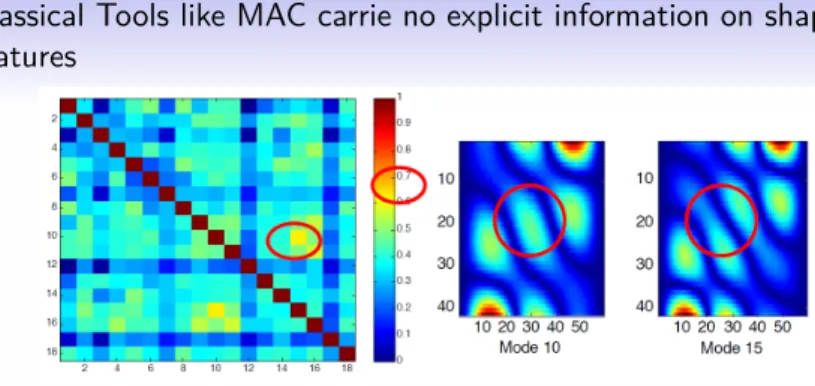
Classical Tools like MAC carrie no explicit information on shape features
Figure:MAC exhibits high similarities (>0.7) betweens mode 10 and 15 (red circle), but comparing mode 10 and 15 we can easily see the difference in the center of the plate
Comparing two modeshapes in the space of shape (Fourier) descriptors should determine the distance between descriptors of two models as a meaningful measure of the underlying similarity of their shapes
Joseph Morlier (ICA), L. Mevel (INRIA) IMAC2012 9/ 26
Shape Descriptors SD
The SD of an image (modeshape) may be considered as a point in the shape-feature vector space. 2D mode shapes are considered in this paper. Thus, the general form of SD can be expressed as :
D =f [I(x,y)]
where I(x,y) denotes the displacement modeshape function and f [*] is the tranformation extracting the shape features.
More specifically, we can project the image onto the kernel function R(x,y) as :
D= Z
Ω
R(x,y)I(x,y)dxdy
Joseph Morlier (ICA), L. Mevel (INRIA) IMAC2012 10/ 26
Mapping
Shape descriptors are so dependant on the kernel function. Fourier, Wavelets and Zernike moments have been successfully used. Here We choose to analyse modeshapes using the Elliptic Fourier Descriptor. The FD is based on the frequency components from Fourier Transform (FT) of the images.
The kernel function of the SD is the complex valued sinusoid : Df(u,v) =
Z +∞
−∞
e−i2π(ux+vy)I(x,y)dxdy
Df(u,v) is a continuous function having the same cardinality as I(x,y), and for real applications, this needs to be reduced whilst retaining as much information as possible. Using lower frequency and higher energy components we can describe the shape.
Joseph Morlier (ICA), L. Mevel (INRIA) IMAC2012 11/ 26
Contour
The cumulative angular function transforms the two-dimensional (2D) description of a curve into a one-dimensional periodic function suitable for Fourier analysis. In contrast, EFD maintain the description of the curve in a 2D space by defining the complex plane. Each pixel is represented by a complex number. The first coordinate represents the real part, while the second represents the imaginary part. Thus, a curve is defined as
c(t) =x(t) +jy(t)
Figure:Principe de la description par tangente et principe de la description dans le plan complexe [?]
Joseph Morlier (ICA), L. Mevel (INRIA) IMAC2012 12/ 26
Elliptic Fourier Descriptors EFD
To obtain the elliptic Fourier descriptors of a curve, we need to obtain the Fourier expansion of the curve. The Fourier expansion can be performed by using the complex or trigonometric form. In general, the equation linking curve and Fourier expansion terms is expressed in matrix form as :
"
x(t) y(t)
#
=0.5
"
ax0
bx0
# +
+∞
X
k=1
"
axk bxk
ayk byk
# "
cos(kωt) sin(kωt)
#
Joseph Morlier (ICA), L. Mevel (INRIA) IMAC2012 13/ 26
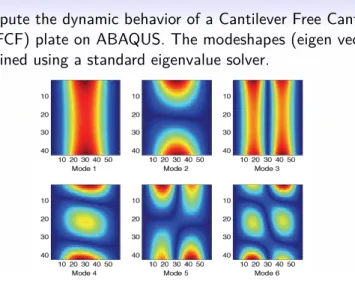
Simple Example
We compute the dynamic behavior of a Cantilever Free Cantilever Free (CFCF) plate on ABAQUS. The modeshapes (eigen vectors) are obtained using a standard eigenvalue solver.
Figure:6 first Modeshapes
One drawback of the method is that the image resolution should be enhanced (from 40 by 50 pixels to 200 by 250 pixels, so the resolution is increased by a factor 5 by splines interpolation)
Joseph Morlier (ICA), L. Mevel (INRIA) IMAC2012 14/ 26
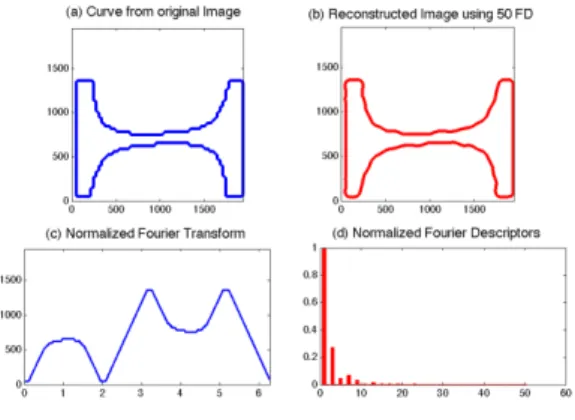
Using a classical EFD algorithm :
1 Contours are extracted from the nodal lines data using IP thresholding.
2 From the complex curve, we compute Normalized Fourier Transform, then Fourier Descriptors.
3 Retrieval of the original modeshape can accurately be obtained by the inverse Fourier transform
Figure:Elliptic Fourier descriptor are used to reconstruct mode 2 (a) based on 50 Fourier descriptors (d).
Joseph Morlier (ICA), L. Mevel (INRIA) IMAC2012 15/ 26
Good approximation may reasonably be achieved by retainingonly a small number of high energy terms (50 terms). We can see clearly the approximation is enhanced with number of Fourier Descriptors
Figure:A schematic contour gradual reconstruction of mode 2, using, respectively, 2, 6, 12 and 50 descriptors
Joseph Morlier (ICA), L. Mevel (INRIA) IMAC2012 16/ 26
But just comparing FD of these two modes (Mode 10 and 15), we can see that important dissimilarities exist. We can also conclude that reconstruction from FD can help to have ”local” information of dissimilarities.
Figure:Dissimiliraties can be seen between mode 10 and 15 comparing relative amplitude of Fourier Descriptors
Joseph Morlier (ICA), L. Mevel (INRIA) IMAC2012 17/ 26
Avoid false damages ?
Changes in modal parameters (frequency, damping, mode shapes) are commonly used in SHM to detect, localize and identify damages in structures.
Direct comparison of modeshapes of damaged and undamaged plate gives no reliable information about the damage location because many false damages can appear in the map.
This method will help us to select ”interesting modes” in the entire modal basis.The question is : How do we classify them ?=⇒ Comparing 2 states of modeshapes by their Fourier Descriptors, we can see easily the modeshape influenced by damage
Joseph Morlier (ICA), L. Mevel (INRIA) IMAC2012 18/ 26
SAPES Project
Structural Health Monitoring of an Aircraft door Partners :Lat´eco`ere / ISAE / Medysys Air Espace
Figure:Vibration Based method applied to composites pannel (b)
Joseph Morlier (ICA), L. Mevel (INRIA) IMAC2012 19/ 26
Plate Test
Composites plateT700 M21 (Laminates) modeled onABAQUSwith and without damage
Boundary conditions : Clamped Dimensions 236 x 291 mm
E1=110.3GPa, E2=E3=7.69GPa, G12=G13=4.75GPa, G23=2.746GPa, density 1550kg/m3
Figure:Maillage de l’´el´ement plaque (maille d’une porte) et localisation du d´elaminage. Fr´equences propres, r´esultats du calcul modal
Joseph Morlier (ICA), L. Mevel (INRIA) IMAC2012 20/ 26
In a first approach, comparing all the modeshapes between the two states gives lots of false damage. Then we compute the MAC between state 1 and 2. We can not conclude about the damage existence and location only using this result (very close from the MAC using only undammaged case)
Figure:Modal Assurance Criteria (MAC) of modeshapes of undamaged plate Vs damaged plate gives no information about the damage location
Joseph Morlier (ICA), L. Mevel (INRIA) IMAC2012 21/ 26
In a second approach we compare FD of the 15 modeshapes between the 2 states (undammaged, damaged). It also seems to have high correlation between the 2 cases
Figure:Comparison of Fourier Descriptors of mode 9 for undamaged and damaged cases and Regression which allows to establish indicators to classify interesting mode shapes
Joseph Morlier (ICA), L. Mevel (INRIA) IMAC2012 22/ 26
It is interesting to note that the results obtained from classification from R and slope are slightly different (Mode 9 is always the most dissimilar), so we decide to average the influence of these two indicators by creating an indicator which give the same weight to R and slope.It aims at quantifying the ”local dissimilarities” of the modeshapes.
Figure:Mixed indicators versus modes, high changes of this indicator permits to see the influence of damage on the nodal line changes. In red, extracted mode shapes for damage localization using lower values of the mixed indicator.
Joseph Morlier (ICA), L. Mevel (INRIA) IMAC2012 23/ 26
The mapping of a potential damage zone is created by a weighted indicator basedon the absolute difference between selected modeshapestaking into account only the INTERSECTION of dissimilar modes in the modal basis (Mode 9, then Modes 5,9 then Modes (5,9,13)).
Figure:Difference between selected modeshapes (5,9,13). Top mode 9 only, middle combination of mode 5,9, down combination of mode 5,9,13. Classifying most interesting modes permits to reduce influence of false damages.
Joseph Morlier (ICA), L. Mevel (INRIA) IMAC2012 24/ 26
Conclusion and Future works
Shape Descriptors show the desirable properties of computational efficiency and ease of image reconstruction using a small number of SD terms. The Elliptic Fourier Descriptors are more general and very effective at extracting mode-shape features by virtue of their sinusoidal patterns=⇒Can be used for an enhanced MAC computation
Nodal lines are able to characterize modeshapes very easily and are also sensitive to damage
Our SHM method will help the user to select ”interesting modes”
automaticaly and compute a MAP of Dissimilarities between two successive state for different scenarii on a damaged plate in composites.
Futur works will focus on testing Fourier Descriptors on Experimental data and to develop wavelets decomposition as enhanced feature descriptors.
Joseph Morlier (ICA), L. Mevel (INRIA) IMAC2012 25/ 26
![Figure : Maxima of wavelets by [Rucka et al]](https://thumb-eu.123doks.com/thumbv2/123doknet/2357551.38298/6.544.92.455.271.400/figure-maxima-wavelets-rucka-et-al.webp)
![Figure : Principe de la description par tangente et principe de la description dans le plan complexe [?]](https://thumb-eu.123doks.com/thumbv2/123doknet/2357551.38298/12.544.120.423.165.390/figure-principe-description-tangente-principe-description-plan-complexe.webp)