HAL Id: cirad-00180342
http://hal.cirad.fr/cirad-00180342
Submitted on 18 Oct 2007HAL is a multi-disciplinary open access
archive for the deposit and dissemination of sci-entific research documents, whether they are pub-lished or not. The documents may come from teaching and research institutions in France or abroad, or from public or private research centers.
L’archive ouverte pluridisciplinaire HAL, est destinée au dépôt et à la diffusion de documents scientifiques de niveau recherche, publiés ou non, émanant des établissements d’enseignement et de recherche français ou étrangers, des laboratoires publics ou privés.
Dirk Raes, Erwin de Nys, Petra Deproost
To cite this version:
Dirk Raes, Erwin de Nys, Petra Deproost. UPLOW, a model to assess water and salt movement from a shallow water table to the topsoil. Atelier du PCSI (Programme Commun Systèmes Irrigués) sur une Maîtrise des Impacts Environnementaux de l’Irrigation, 2002, Montpellier, France. 9 p. �cirad-00180342�
Serge Marlet et Pierre Ruelle (éditeurs scientifiques), 2002. Vers une maîtrise des impacts environnementaux de l’irrigation. Actes de l’atelier du PCSI, 28-29 mai 2002, Montpellier, France. CEMAGREF, CIRAD, IRD, Cédérom du CIRAD.
U
PFLOW, a model to assess water and salt movement from
a shallow water table to the topsoil
Dirk RAES*, Erwin DE NYS*, Petra DEPROOST**
* K.U. Leuven, Department Land Management, Vital Decosterstraat 102, B-3000 Leuven, Belgique. E-mail: dirk.raes@agr.kuleuven.ac.be
** Bodemkundige Dienst van België vzw, Willem de Croylaan 48, B-3001 Leuven, Belgique
Résumé
UPFLOW, un modèle pour estimer la remontée d’eau et de sel depuis une nappe phréatique. UPFLOW est un outil informatique qui permet d’estimer la remontée d’eau et de sel depuis une nappe phréatique peu profonde vers la couche superficielle du sol, pour une période déterminée et des conditions environnementales spécifiques. Dans le modèle, les conditions environnementales sont spécifiées par : (i) l’évapotranspiration moyenne pendant la période considérée ; (ii) la teneur en eau moyenne de la couche superficielle pendant cette période ; (iii) la profondeur de la nappe en dessous de la superficie du sol ; (iv) l’absorption de l’eau par les racines ; (v) la profondeur et les caractéristiques des différentes couches du sol et (vi) la teneur en sel de la nappe phréatique. Une remontée permanente est assumée pendant la période considérée. Pour des conditions d’irrigation fragiles, caractérisés par une nappe phréatique superficielle et/ou saline, UPFLOW est un outil intéressant pour estimer les effets de pratiques agriculturales et/ou mesures de contrôle. Cet article présente deux applications : (i) l’effet de la remontée capillaire sur le programme d’irrigation de la mangue dans le périmètre irrigué de Maniçoba dans le nordeste du Brésil et (ii) le calcul des besoins en eau pour le contrôle de la salinité dans les périmètres rizicoles dans le Delta du Fleuve Sénégal. Des mesures de terrain au Brésil et au Sénégal confirment que les simulations des quantités d’eau et de sel transportés par remontée capillaire vers la zone racinaire se situent dans un bon ordre de grandeur.
Abstract
UPFLOW: a model to assess water and salt movement from a shallow water table to the topsoil. UPFLOW is a software tool developed to estimate the expected upward water and salt movement from a shallow water table to the topsoil during a specific period and for the given environmental conditions. The environmental conditions are specified in the program by: (i) the average evapotranspiration demand of the atmosphere during the period under consideration, (ii) the average soil water content that is maintained in the topsoil during that period, (iii) the depth of the water table below the soil surface, (iv) the water extraction pattern of the plant roots, (v) the thickness and characteristics of successive layers of the soil profile and (vi) the salt content of the water table. A steady state upward flow is assumed during the period. In vulnerable irrigation systems, characterized by a shallow and/or saline ground water table, UPFLOW may be an interesting tool to estimate the effects of existing or potential agricultural practices and/or control measures. Two applications are presented in the paper: the effect of capillary rise on irrigation scheduling of Mango in the Maniçoba perimeter in the northeast of Brazil and the water requirement for salt control in rice schemes in the Senegal River Delta. Field measurements in Brazil and Senegal confirms that UPFLOW simulates the correct order of magnitude of the amount of water and salt that is transported by capillary rise to the root zone.
Introduction
In water balance studies, the change of water stored in the root zone is monitored by keeping track of the incoming and outgoing water fluxes at its boundary. The soil water content that can be expected at the end of a time period can be derived from the differences between the incoming and outgoing water fluxes over the concerned time period. The calculation of the soil water balance is an important tool to assess the water availability for crops throughout the growing season, the water flow required for irrigation and the excess water flowing to drains. It has found wide application in the planning and management of both irrigated and rainfed agriculture, as well as in the simulation and evaluation of water management strategies.
In the presence of a shallow water table, the upward water movement by capillary rise from the water table to the root zone is an important incoming flux at the bottom boundary of the root zone. Since the upward transported water can cover part or even the total crop water requirement, the flux should not be neglected when estimating the irrigation water requirement. The determination of the upward flux however is not simple and requires a good knowledge of all factors that affect the flow such as the depth of the water table, the capillary properties of the soil profile, the evaporative demand of the atmosphere, root water uptake characteristics, and the soil water content in the root zone. UPFLOW (Raes, 2002) was developed to estimate indicative values for the capillary rise under the given environmental conditions. The software simulates not only the magnitude of the expected upward water movement, but also allows the user to evaluate the effects of the environmental conditions on the upward flow.
In irrigated agriculture, many salinity problems are associated with or strongly influenced by a shallow water table (Ayers and Westcot, 1985). The amount of salts that will accumulate in the topsoil depends on the quality and quantity of the water that move upward. When the build-up of salts in the root zone is important and no leaching by rainfall or excess irrigation water is applied, the salt concentration might affect crop yield. Given the salt content of the water table UPFLOW calculates for the given environmental conditions, the amount of salts that will accumulate in the topsoil over a given time period.
Calculation procedure
UPFLOW estimates the amount of water that will move from a shallow water table to the topsoil for the specified environmental conditions under a steady state condition. The steady state condition assumes that the flow does not change with time. As such the calculated flux is valid as soon as the water flow is in equilibrium with the environment and as long as the specified environmental conditions do not change.
Steady upward flow
The steady upward flow to the topsoil is estimated by means of a calculation procedure presented by De Laat (1980; 1995). By assuming a constant flux from a shallow water table to the top soil, De Laat rewrote and integrated the Darcy equation as
∫
+ − = h dh h K q h K z 0 ( ) ) ( (Eq. 1)where z [m] is the vertical co-ordinate, q the constant upward flux [m3.m-2.day-1] of water, h the soil matric potential per unit weight of water (head) [m], and K(h) the hydraulic conductivity [m.day-1]. The reference level is chosen at the stationary phreatic surface at which level z and h are zero. The vertical co-ordinate and the flux are both taken positive upward. If the functional
relation between K and h is known, the soil matric potential at specific points above the water table can be calculated for particular steady upward flows by means of Eq. 1. The obtained relation between the height above the water table (z) and the matric head (h) is called a pressure profile. Given the relation between the soil water content (θ) and the matric head (soil water characteristics curve) the pressure profiles are easily transformed in moisture profiles. Given the K-h and θ-h relation for the various soil layers of the profile above the water table, UPFLOW calculates for various fluxes the corresponding pressure and soil moisture profiles. Moisture profiles whereby the soil water content in the topsoil drops below the specified mean water content are rejected. To guarantee a steady state condition, the amount of water that is transported upward will have to be removed with the same rate from the topsoil by evapotranspiration. As such the upward flow can never exceeds the specified average evapotranspiration demand. Given the above restrictions, the maximum upward flow that can be expected under the specified environmental conditions is obtained and displayed, and the corresponding moisture profile is plotted.
Field capacity at equilibrium
For the specified depth of the water table, UPFLOW displays also the soil water content that can be expected in the topsoil when the water content in the specified soil profile is in equilibrium with the water table. This so-called 'field capacity at equilibrium' is calculated by means of Eq. 1 by assuming a very small value for q (0.1 mm/day).
Water logging in the root zone
The closer the water table is to the soil surface, the more the root zone becomes waterlogged. The degree of water logging is derived from the calculated moisture profile. If at a particular area in the root zone the soil water content is above the anaerobiosis point, the soil is assumed to be waterlogged in that area. Water logging will result in deficient aeration conditions and will hamper root water uptake. If all over the root zone the soil water content is above the anaerobiosis point, the root zone is fully waterlogged and the transpiration rate becomes zero.
Water extraction by plant roots
UPFLOW calculates the amount of water that will move upward from the water table to that point in the root zone where it is completely extracted by plant roots. The calculation procedure estimates the zone where the water is extracted by considering the root extraction rate. If the soil is not cultivated, the water will be transported to the soil surface where it evaporates.
The amount of water that plant roots can extract from a given soil volume is given by the root extraction rate Smax (Feddes et al., 1978). Because of the proliferation of roots in the upper root zone, Smax is usually much larger in the top than in the bottom of the root zone. A compilation of literature data for cereals, grass and deciduous trees (Diels, 1994; Hubrechts et al., 1997; Van de Moortel et al., 1998) indicates that the relation between Smax and soil depth is exponential. When the root zone is waterlogged, the water uptake is hampered. This is simulated in UPFLOW by multiplying Smax with a water stress coefficient (Ks) that is smaller than or equal to one. Once the aeration conditions in the root zone are deficient, Ks decreases exponentially from one to zero.
Salt transport
If the salt content of the water table is known, Eq. 1 can also be used to predict the amount of salts that move upward by means of capillary rise. The salts dissolved in the soil solution will
accumulate in the root zone as more and more water is removed by evapotranspiration. In the calculation procedure, the assumption is made that 1 dS/m is equal to 640 mg/litre (Abrol et al., 1988; ASCE, 1996).
Input
The input for the UPFLOW model consists in specifying the environmental conditions that are valid during the period of upward flow (Fig. 1):
Evapotranspiration demand
UPFLOW calculates the upward flow that responds to the specified average evapotranspiration demand (ET) of the atmosphere for the given period. Since the water flow inside the soil profile is assumed to be steady, the capillary rise from the water table to the topsoil can never exceeds ET. Allen et al. (1998) present guidelines to estimate ET from cropped and non-cropped surfaces.
Average soil water content that is maintained in the top soil during the period
Various degrees of soil wetness can be selected, ranging from very dry (no irrigation during the dry season), to a well-watered soil (irrigation period) or even a very wet soil (heavy rainy period resulting in drainage of the top soil).Depth of the water table below the soil surface
The depth of the water table is measured in piezometers or can be estimated from water levels in drain channels or from a soil profile description.
Water extraction characteristics of the plant roots
Indicative values for Smax and the anaerobiosis point for a number of various crop types are available and can be selected in UPFLOW. The user can adjust or import new values.
Soil profile (thickness and characteristics of successive soil layers)
A soil water retention curve (θ-h) describes the relationship between the soil water content (θ) and the corresponding soil matrix potential (h). UPFLOW contains two sets of 12 soil water retention curves. Each curve describers the θ-h relationship for one of the twelve different soil texture classes. In one set (Parameters), the curves are characterised by the Van Genuchten parameters (Van Genuchten, 1991) while in the other set (Curves) each soil water retention cure is described by θ-h values for various soil water contents. Although, the two sets of 12 soil water retention curves embedded in the program are considered as representative and believed to give a good picture of the general trend that can be expected for the given textural class, the user can import other curves in the program.
The functional relation between the hydraulic conductivity (K) and soil matric potential (h), required to perform the integration in Eq. 1, is derived at run time once the user has specified the θ-h relation and the value for the saturated hydraulic conductivity (Ksat). The K-h relation is given by Mualem’s model (Mualem, 1976; Van Genuchten et al., 1991) if Set 1 (Parameters) is used for the θ-h relationship or obtained from the water retention curve by the method described by Kunze et al. (1968) and Jackson (1972) if Set 2 (Curves) are used. In order to perform the calculations, values for the saturated hydraulic conductivity are required. Unfortunately, typical Ksat values for the various soil textural classes do not exist. Even for a very specific soil, it is not
uncommon to measure rather important variations for Ksat in space and time as a result of variations in soil structure, bulk density, biological activity and soil management. Since equations that predict hydraulic conductivity from readily available soil parameters (Ahuja et al., 1989; Williams et al., 1993; Suleiman and Ritchie, 2001) do not consider all relevant parameters the equations can only give an order of magnitude. Therefore, UPFLOW offers the possibility to the user to adjust the displayed indicative values for Ksat at run time, before the K-h relation is derived. If Ksat is larger than the listed value, more water can be transported upwards. If Ksat is smaller, the capillary rise will be less important.
Salt content of the water table
The water salinity is expressed by its Electrical Conductivity (EC).
Output
For the given environmental conditions, UPFLOW displays (Fig. 1): - Expected steady upward flow from the water table to the topsoil (if any);
- Soil water content expected in the topsoil when no water flow occurs. This is referred to as field capacity in equilibrium with the water table;
- Amount of salt transported upward during the given period, when the water table contains salts; - Degree of water logging in the root zone (if any);
- Graphical display of the soil water profile above the water table.
Applications
Two examples illustrate the use of UPFLOW in the formulation of practical irrigation guidelines.
Irrigation charts for the Maniçoba perimeter (Brazil)
Irrigation charts (Raes et al., 2000; De Nys et al., 2001) are simple tools that help farmers to adjust the irrigation calendar to actual weather and water limiting conditions. Irrigation charts are designed by means of a soil water balance for specific climatic conditions, crop and soil type, and irrigation method, by considering the irrigation requirements for the given conditions and the unavoidable water application losses.
Given the shallowness of the water table in the Maniçoba irrigation perimeter (São Francisco Valley, Northeast Brazil), the capillary rise is significant and reduces strongly the irrigation
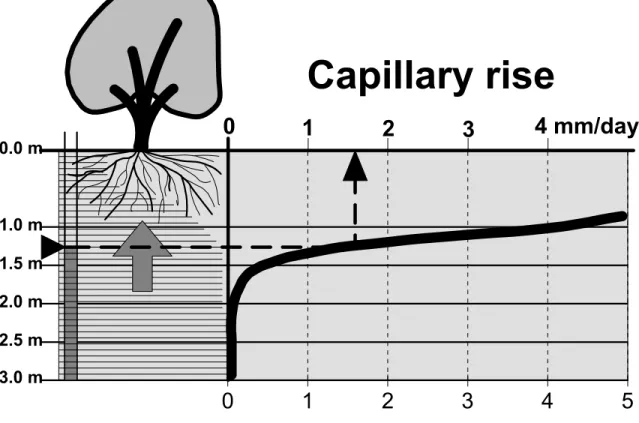
requirement. With UPFLOW the capillary rise was estimated for the given environmental conditions (Fig. 2) and the results were integrated in the irrigation charts for Mango’s (DIM et al., 2001).
Vandersypen (2001) determined by means of gravimetric sampling the soil water content in the root zone of Mango between two irrigation applications in the dry season. By considering the actual evapotranspiration demand, she was able to derive the soil water balance during the irrigation interval (varying from 7 up to 15 days) and to estimate the capillary rise in a Lixisol for three different depths of the water table (0.9, 1.20 and 1.50 m). Sampling was repeated at three places within a radius of 7 m around the piozemeters recording the depth of the water table. By comparing the measured with simulated upward flow, it was concluded that UPFLOW estimated correctly the upward flow for those conditions.
Figure 2. Expected capillary rise (mm/day) from a shallow water table to the root zone of a Mango tree for various depth (m) of the water table below the soil surface in a Lixisol for the Maniçoba perimeter in the Northeast of Brazil (from DIM, KULeuven, Cirad, 2001)
0
1
2
3
4
5
0.0 m 1.0 m 1.5 m 2.0 m 2.5 m 3.0 m0
1
2
3
4 mm/day
Capillary rise
Water requirements for salt control in rice schemes in the Senegal River delta
(Senegal)
In 1990 about 17,500 ha were irrigated in the delta of the Senegal River (SAED, 1993). In most schemes irrigated rice is the major crop. When fields are not cultivated, salts are transported to the topsoil by capillary rise from the very saline and shallow ground water table. If double or single rice cropping is applied, such conditions are valid during 100 up to 200 days. To keep during the irrigation season the salinity level in the rice fields below a threshold value, salts have to be removed from the fields either by deep percolation (leaching) or by regularly flushing the standing water from the fields. In order to estimate the water requirement for salt control in the irrigation schemes, input and output of salt were simulated by considering the amount and the salinity of water transported to and from the scheme (Raes et al., 1995). Results indicated that if the schemes are located on the riverbanks (fondé), flushing at the beginning of the season and the percolation losses throughout the season may be sufficient to remove the salts out of the root zone. On the less permeable soils in the depressions (hollaldé), extra flushing during the irrigation season is required to evacuate enough salts from the fields. In total about 2,300 m3 ha-1 of water may be needed for flushing. If flushing is not practised, the schemes have to be abandoned after a few years of cultivation due to build-up of soil salinity. Several field observations during the period 1998-1993 confirm that the simulations and estimates of salt deposition in the root zone are in the correct range (Raes et al., 1993; Raes et al., 1995).
Conclusions
In vulnerable irrigation systems, characterized by a shallow and/or saline ground water table, the UPFLOW software may well be an interesting tool to estimate the effects of existing or potential agricultural practices and/or control measures.
The upward flow from a water table to the root zone is often not considered when planning irrigation. When the water table is shallow, this results in over-irrigation, flushing of valuable nutrients out of the root zone and water logging in the perimeter. With a simple tool such as UPFLOW, one is able to quickly estimate the expected capillary rise for the given environmental conditions and subsequently to adjust the irrigation interval or application depth.
Dissolved salts from a saline shallow water table move upward by capillary rise and will be deposited in the root zone when water is removed by evapotranspiration. To prevent soil salinization salts have to be leached or flushed out of the root zone. To calculate the extra water requirement for salinity control, all incoming and outgoing fluxes of salt have to be considered. With the help of UPFLOW the incoming salts by capillary rise can be quickly estimated.
UPFLOW is public domain software and hence freely available.
Bibliography
ABROL I.P., J.S.P. YADAV and P.I. MASSOUD. 1988. Salt-affected soils and their management. FAO Soils Bulletin No 39. Rome, Italy. 131 pp.
ALLEN, R., L. PEREIRA, D. RAES and M. SMITH. 1998. Crop evapotranspiration (guidelines for computing crop water requirements). FAO Irrigation and Drainage Paper No 56. Rome, Italy. 300 pp.
AHUJA, L.R., D.K. CASSEL, R.R. BRUCE, and B.B. BARNES. 1989. Evaluation of spatial distribution of hydraulic conductivity using effective porosity data. Soil Science Journal. Vol. 148, N°6: 404-411.
ASCE. 1996. Agricultural salinity assessment and management. Water quality technical committee of the Irrigation and Drainage Division of ASCE. New York, USA. 619 p.
AYERS, R.S., and D.W. WESTCOT. 1985. Water quality for agriculture. FAO Irrigation and Drainage Paper No 29. Rome, Italy. 174 pp.
DE LAAT, P.J.M. 1980. Model for unsaturated flow above a shallow water-table. Applied to a regional sub-surface flow problem. PUDOC, Doctoral thesis, Wageningen, The Netherlands. 126 pp.
DE LAAT, P.J.M. 1995. Design and operation of a subsurface irrigation scheme with MUST. In Pereira, L.S., B.J. van den Broek, P. Kabat and R.G. Allen (Editors). Crop-water-simulation models in practice. Wageningen Pers, The Netherlands: 123-140.
DE NYS, E., E.C. KIPKORIR, A. SAHLI, R. VAES, D. RAES. 2001. Design of farmer-oriented irrigation charts by using a soil-water balance model. 4th Inter Regional Conference on Environment-Water, ICID. 27-30 Aug., Fortaleza, Brazil: 235-243.
DIELS, J. 1994. A validation procedure accounting for model input uncertainty: methodology and application to the SWATRER Model. Doctoral Thesis. Faculty of Agric. and Applied Biol. Sciences, K.U.Leuven, Belgium. Dissertationes de Agricultura No. 256. 173 pp.
DIM, KULeuven and CIRAD. 2001. Calendário de Irrigação por Microbacias – Manga (a partir de 6 anos). Assistência Téchnica e Extensão Rural do Distrito do Périmetro Irrigado de Maniçoba. Juazeiro, Brazil.
FEDDES, R.A., P.J. KOWALIK and H. ZARADNY. 1978. Simulation of field water use and crop yield. Simulation Monographs. PUDOC, Wageningen, The Netherlands. 189 pp.
HUBRECHTS, L., R. VAN DE MOORTEL and J. FEYEN. 1997. Berekening van de bodemwaterbalans onder bos voor de proefvlakken van het ‘Bosbodemmeetnet Vlaanderen’ (periode 1990-1995). Institute for Land and Water Management, K.U.Leuven. Internal Publication N° 47.
JACKSON R.D. 1972. On the calculation of hydraulic conductivity. Soil Sci. Amer. Proc. 36: 380-382.
KUNZE R.J., G. UCHARA G. and K. GRAHAM. 1968. Factors important in the calculation of hydraulic conductivity. Soil Sci. Amer. Proc. 32: 760-765.
MUALEM, Y. 1976. A new model for prediciting the hydraulic conductivity of unsaturated porous media. Water Resour. Res. 12: 513-522.
RAES, D. ET B. SY. 1993. Rapport final. Projet Gestion de l’Eau, Coopération Scientifique KULeuven – SAED. Saint-Louis, Sénégal. 63 pp.
RAES, D., DECKERS J. AND DIALLO A.M. 1995. Water requirements for salt control in rice schemes in the Senegal river delta and valley. Irrigation and Drainage Systems Volume 9(2): 129-141.
RAES, D., A. SAHLI, J. VAN LOOIJ, N. BEN MECHLIA, and E. PERSOONS. 2000. Charts for guiding irrigation in real time. Irrigation and Drainage Systems. Volume 14(4): 343-352.
RAES, D. 2002. UPFLOW – water movement in a soil profile from a shallow water table to the topsoil. KULeuven, Reference manual. 18 pp.
SAED. 1993. Rapport et cartes de synthèse présentant les aménagements hydro-agricoles de la délégation de Dagana en novembre 1990. SAED, DAIH-DPDR, Saint-Louis, Sénégal.
SULEIMAN A.A., and J.T. RITCHIE. 2001. Estimating saturated hydraulic conductivity from soil porosity (in press).
VAN DE MOORTEL, R., J. DECKERS, en J. FEYEN. 1998. Groei en vitaliteit van wintereik en zomereik in relatie tot de waterhuishouding. Institute for Land and Water Management, K.U.Leuven. Internal Publication N° 53.
VANDERSYPEN, K. 2001. Evaluation of Producers’ irrigation strategies and impact on the environment: the case of two gravitary projects in North-East Brazil. Master Dissertation. Faculty of Agric. and Applied Biol. Sciences, KULeuven, Leuven, Belgium. Master Dissertation. 111 pp. VAN GENUCHTEN, M.TH., F.J. LEIJ and S.R. YATES. 1991. The RETC code for quantifying the hydraulic functions of unsaturated soils.. US. Salinity Laboratory, Riverside, California. 85 p. WILLIAMS, R.D., and L.R. AHUJA. 1993. Using available water content with the one-parameter model to estimate soil water retention, Soil Science. Vol. 156 (6): 380-388.