HAL Id: hal-02942970
https://hal.archives-ouvertes.fr/hal-02942970
Submitted on 18 Sep 2020HAL is a multi-disciplinary open access
archive for the deposit and dissemination of sci-entific research documents, whether they are pub-lished or not. The documents may come from teaching and research institutions in France or
L’archive ouverte pluridisciplinaire HAL, est destinée au dépôt et à la diffusion de documents scientifiques de niveau recherche, publiés ou non, émanant des établissements d’enseignement et de recherche français ou étrangers, des laboratoires
Probability of myopia in children with high refined
carbohydrates consumption in France
Claire Berticat, Sonia Mamouni, Angelique Ciais, Max Villain, Michel
Raymond, Vincent Daien
To cite this version:
Claire Berticat, Sonia Mamouni, Angelique Ciais, Max Villain, Michel Raymond, et al.. Probability of myopia in children with high refined carbohydrates consumption in France. BMC Ophthalmology, BioMed Central, 2020, 20 (1), �10.1186/s12886-020-01602-x�. �hal-02942970�
Probability of myopia in children with high refined carbohydrates
consumption in France
Claire Berticat1*#, Sonia Mamouni2#, Angelique Ciais3 , Max Villain2, Michel Raymond1x, Vincent Daien2,4x
*Corresponding author
E-mail: claire.berticat @umontp ellier .fr
Postal adress : UMR5554, University of Montpellier, Cc 065, Place Eugène Bataillon, F-34095 Montpellier cedex 05
Telephone number: (33) [0]467144615 Fax number: (33) [0]467143622
# These authors contributed equally to this work
x These authors contributed equally to this work
1 Institute of Evolutionary Sciences Montpellier, UMR 5554 - CNRS - IRD - EPHE- University of Montpellier, Montpellier, France
2 Department of Ophthalmology, Gui De Chauliac Hospital, Montpellier, France 3 Department of Orthoptist, Gui De Chauliac Hospital, Montpellier, France 4 Inserm, UMR 1061, Montpellier, France
1 2 3 4 5 6 7 8 9 10 11 12 13 14 15 16 17 18 19 20 21 22 23
Abstract
Background: Evaluate risk factors for paediatric myopia in a contemporary French cohort taking into account consumption of refined carbohydrates (starches and sugars).
Methods: An epidemiological cross-sectional study was conducted between May 2017 and May 2018. 264 children aged 4 to 18 years attending the Centre Hospitalier Universitaire Gui de Chauliac in Montpellier were recruited. Ophthalmologic or optometric cycloplegic refraction were measured. Evaluated risk factors for myopia were collected, including family history of myopia, outdoor time, reading time, screen time, physical activity, and consumption of refined carbohydrates. Association between the probability of at least one eye showing myopia (defined as < 0 D) and frequency of refined carbohydrates consumption adjusted for risk factors and control factors was tested.
Results: Overall, 86/264 (32.6%) children investigated showed myopia in at least one eye. We included
180 children exhibiting refraction < 3 D in both eyes: 88 (48.9%) girls and 92 (51.1%) boys. The consumption of refined carbohydrates significantly increased the probability of myopia for girls (odds ratio [OR]=1.07; 95% confidence interval [CI], 1.02–1.13; P=0.009) but decreased it for boys
(OR=0.94; 95% CI, 0.89–0.98; P=0.011). The probability of myopia was marginally increased with increased screen time (OR=2.32; 95% CI, 0.94–6.47; P=0.083). Outdoor time seemed marginally protective (OR=0.74; 95% CI, 0.54–1.01; P=0.057).
Conclusion: Refined carbohydrates consumption could be associated with child myopia, with
increased probability for girls and unexpected reduced probability for boys, possibly due to the fact that frequency of carbohydrates consumption do not really capture boy's chronic hyperglycemia, boys being
more physically active than girls at all ages. Some known risk/protective factors of myopia were marginally significant: screen time (risk) and outdoor time (protective). This study reinforces the belief that modifiable risk factors for myopia could be targets for future public health actions.
24 25 26 27 28 29 30 31 32 33 34 35 36 37 38 39 40 41 42 43 44 45 46
Key words: myopia, risk factors, diet, refined carbohydrates, sugar, starch, screen time, outdoor time, children
Background
Myopia is a multifactorial refractive disorder characterised by blurry distance vision with eyes displaying steeper corneal curvature and/or longer axial length as compared with emmetropes [1]. High myopia (usually defined as < -6 D) is a risk factor for potentially blinding complications such as retinal detachment, subretinal neovascularisation, early cataract and glaucoma [2].
Myopia has become a significant public health problem, with a substantial increase in
prevalence worldwide [3]. For example, in China, the proportion of people with myopia increased from 20% in the 1970s to 90% in 2018 [4]. In 2010, 28% of the world’s population was myopic and a group of world health experts projected that with the current trends, half of the world’s population will be affected by myopia in 2050 [5].
With the fast time-scale increase in myopia (less than 2 to 3 generations), non-genetic
associated factors are being identified [6, 7]. Time spent doing close eye work (near-work), duration of study time and level of education are most frequently cited as the main environmental factors
underlying the development of myopia[8–10]. Outdoor time (exposure to natural light) but not physical activity is described as a protective factor because children spending more time outside show less incidence of myopia [11–13]. To control for genetic variability, Ramessuret et al. (2015) compared refractions in several pairs of homozygous twins and showed that the most myopic twin was the one who spent the least time outside [14].
47 48 49 50 51 52 53 54 55 56 57 58 59 60 61 62 63 64 65 66 67
Other possible factors were previously proposed, but were later discarded. For example, in 1956, Gardiner suggested dietary involvement in the pathophysiology of myopia: a comparison of the diet of 33 active myopic and 251 stable myopic individuals showed increased consumption of lipids and carbohydrates in the active group [15]. Almost 2 decades ago, Cordain et al. (2002) first proposed that via hyperinsulinism, consumption of refined carbohydrates (starches and sugars) could be involved in the development of juvenile-onset myopia: the interaction between hyperinsulinism and hormonal regulation of eye growth could increase the elongation of the axial eyeball [16]. This hypothesis has been supported by more recent evidence [17–23]. Of note, the dietary hypothesis and the near-work hypothesis cannot be tested independently, because the type and quantity of diet is associated with physical activities, which may be negatively correlated with time spent on near-work [24–26]. To our knowledge, only one study considered both effects jointly by controlling also for outdoor activities with the conclusion that axial length and sugary diet were not associated [27]. However, in this study, sugars and starches consumption were considered separately and without distinction of their refined origin, possibly reducing the ability to detect an effect. Moreover, this study found a statistically significant link between consumption of saturated fatty acids as well as cholesterol level and increase in axial length. Saturated fat is a known antagonist of insulin and a contributor to insulin resistance[28], so these findings lend some support to the hyperinsulinemic theory of Cordain et al [16]. Thus, the contribution of these two hypotheses, near-work or diet, to the emergence of juvenile onset myopia is unclear.
The aim of this study was to simultaneously test modifiable risk factors suspected to be involved in the development of myopia in children, taking into account nutritional factors especially the consumption of refined carbohydrates.
68 69 70 71 72 73 74 75 76 77 78 79 80 81 82 83 84 85 86 87 88 89 90
Methods
Design
All children age 4 to 18 years who attended the University Hospital Center of Montpellier from May 2017 to May 2018 were considered. We excluded children with organic ophthalmological pathologies such as cataract, glaucoma, retinoblastoma, and Coat’s disease but included those with a history of amblyopia and functional strabismus.
Measurements
All included children underwent a complete ophthalmologic examination, including refraction under cycloplegia, slit-lamp examination and dilated fundus examination. Children with refraction error ≥ 3 D in at least one eye were excluded because those individuals were considered as moderate to high hyperopic and thus could not be used as control (i.e. non myopic). The resulting children were
considered myopic (< 0 D for one or both eyes; using a cut-off of - 0.5 D does not change qualitatively the results) or controls (non-myopia for both eyes). Parents completed the study questionnaire to collect the following information on the child: sex (M, F), age (year), height (cm), weight (kg), whether the mother or father was myopic (yes/no), reading time (hours per day), screen time (tablets/cell phones, video games, computers etc.; hours per day), outdoor time (hours per day), physical activities (yes/no) and refined carbohydrates consumption by using a food frequency questionnaire (see Additional file 1 and 2) .
Refined carbohydrates consumption. Refined carbohydrates intake was measured by summing the frequency of weekly consumption of high glycaemic load products reported in the food frequency questionnaire. Reported frequencies were transformed in weekly frequencies as follows: 0 for never,
91 92 93 94 95 96 97 98 99 100 101 102 103 104 105 106 107 108 109 110 111 112
0.5 for less than once a week, 1 for once a week, 2.5 for two to three times a week, 5 for four to six times a week, 7 for every day. This food frequency questionnaire was adapted from the one used in the French national cohort Constances, designed to reflect intake in the French population, selected food items being compliant with the nutritional guidelines from the French National Nutrition and Health Program (PNNS) [29].
Cycloplegic refraction. Cycloplegia was obtained with administration of cyclopentolate (Skiacol, Alcon, Fort Worth, TX, USA) or IsoptoAtropine (Alcon, Forth Worth, TX, USA) at 0.5% for children age 4 to 12 years and 1% for children age 12 to 18 years as recommended by French health authorities. Instillation protocols were those validated in current practice: 1 hr, 55 and 50 min before measurement for Skiacol and twice a day for 5 days before measurement for IsoptoAtropine. Refraction was
measured by using a NIDEK TONOREF II Auto Refractometer (Nidek medical, Settimo Milanese, Italy) in children age 12 to 18 years and the Retinomax 2 Portable Self-Refractometer (Visionix, Bensenville, IL, USA) when the child's cooperation did not allow use of the TONOREF II.
Statistical analyses
All statistical analyses involved using R v3.5.2 (www.r-project.org) with MASS v.7.3-51.1 [30]. Logistic regression was used to analyse the probability of being myopic, estimating odds ratios (ORs) and 95% confidence intervals (CIs). The binary response variable corresponded to spherical refractive error < 0 D versus ≥ 0 D for at least one eye. Explanatory variables were reading time per day
(quantitative), screen time per day (quantitative), time spent outside per day (quantitative) and refined carbohydrates consumption per week (quantitative). Control variables were z-scores for body mass index (BMI [weight/height2], based on the growth reference for age 5 to 19 years from the World
113 114 115 116 117 118 119 120 121 122 123 124 125 126 127 128 129 130 131 132 133 134 135
Health Organization https://www.who.int/growthref; quantitative), mother and father myopia (categorical), sex (categorical), age (quantitative) and sport (categorical). All quantitative variables were centered. The following interactions were analysed beforehand: age with sex, screen time, reading time, outside time, and sport; sex with screen time, reading time, outside time, and sport; and refined carbohydrates consumption with sport, sex, outside time, and age. The significance of each term was assessed from the model including all the other variables by using a likelihood ratio chi-square test. P<0.10 was considered statistically significant for interactions. The variance inflation factor was calculated by the function vif in the R package car [31].
Results
Population description
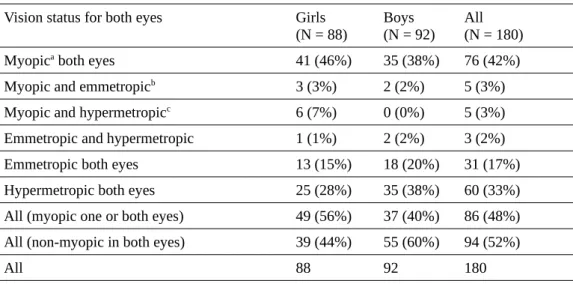
Among 264 children with age 4 to 18 years, 86 (32.6%) were myopic in at least one eye, with an unequal distribution by sex (girls: 49/128 [38.3%], boys: 38/136 [27.9%]). We included 180 children exhibiting refraction < 3 D in both eyes in the study: 88 (48.9%) girls and 92 (51.1%) boys. The mean age of children was 9.5 years old. The description of their characteristics is in Table 1 and the age distribution is in Table 2. The description of vision status is in Table 3. Two categories of vision status were considered: myopic in one or both eyes (N = 86; 49 girls, 37 boys; Table 3) and non-myopic in both eyes (N = 94; 39 girls, 55 boys).
136 137 138 139 140 141 142 143 144 145 146 147 148 149 150 151 152 153 154 155 156 157 158
Table 1. Characteristics of children included in the study (n=180).
Girls (N = 88)
Boys (N = 92)
Myopica (N=49) Non-myopicb (N=39) Myopica (N=37) Non-myopicb (N=55)
Mea
n SD Range Mean SD Range Mean SD Range Mean SD Range Age (years) 10.43 4.06 4–
17 8.31 3.32 4–17 10.89 3.72 4–17 8.31 3.65 4–18 BMIc Z-score 0.21 1.47 -3.60–
3.57 0.22 0.92 -1.27–2.03 -0.02 1.50 -5.03–2.45 -0.03 1.31 -3.38–2.45 Sphere right eye (D) -2.62 2.57 -8.50–
1.50 0.94 0.89 0.00–2.75 -3.37 2.78 -12.00–0.00 1.01 0.92 0.00-2.75 Sphere left eye (D) -2.62 2.91 -10.25–
2.25 0.88 0.86 0.00–2.5 -3.21 2.77 -9.75–0.00 1.00 0.99 0.00–2.75 Outdoor time (hr/day) 2.48 1.40 0.57– 6.43 2.63 1.38 1.28– 7.14 2.31 1.22 0.57– 5.86 2.89 1.65 1.00– 7.14 Reading (hr/day) 0.73 0.21 0.50– 1.00 0.68 0.21 0.50– 1.00 0.71 0.20 0.50– 1.00 0.65 0.20 0.50– 1.00 Screens (hr/day) 2.63 0.61 1.00– 4.00 2.29 0.48 1.00– 3.25 2.78 0.57 2.00– 4.00 2.47 0.53 0.50– 3.50 Refined carbohydrates consumption (frequency/week) 41.94 13.56 13.00– 86.00 35.04 11.06 10.00–53.50 35.03 12.04 0.50–56.00 40.78 10.98 11.50–56.50
aMyopic on one or both eyes (D < 0) bNon myopic on both eyes (0 ≤ D < 3) cBMI, body mass index
Table 2. Distribution of the children by age class.
Age, years Girls
(N=88) Boys(N=92) All(N=180) 4–6 26 (29%) 31 (34%) 57 (32%) 7–10 28 (32%) 28 (30%) 56 (31%) 11–18 34 (39%) 33 (36%) 67 (37%) All 88 (100%) 92 (100%) 180 (100%) 159 160 161 162 163 164 165 166 167
Table 3. Vision status of children.
Vision status for both eyes Girls (N = 88)
Boys (N = 92)
All (N = 180) Myopica both eyes 41 (46%) 35 (38%) 76 (42%)
Myopic and emmetropicb 3 (3%) 2 (2%) 5 (3%)
Myopic and hypermetropicc 6 (7%) 0 (0%) 5 (3%)
Emmetropic and hypermetropic 1 (1%) 2 (2%) 3 (2%) Emmetropic both eyes 13 (15%) 18 (20%) 31 (17%) Hypermetropic both eyes 25 (28%) 35 (38%) 60 (33%) All (myopic one or both eyes) 49 (56%) 37 (40%) 86 (48%) All (non-myopic in both eyes) 39 (44%) 55 (60%) 94 (52%)
All 88 92 180
a refraction error < 0D brefraction error = 0D c0D < refraction error < 3D
Effects on probability of myopia
Only the interactions age with screen time, age with reading time and sex with refined carbohydrates consumption were significant (χ2 =3.74 df=1 P=0.053, χ2 =5.50 df=1 P=0.019 and χ2 =12.7 df=1
P=0.0003, respectively) and were thus kept in the final model. The final model (Table 4, Fig. 1) explained 22% of the total deviance and the variance inflation factor was < 2.5, indicating weak multicollinearity between covariables, and did not need to be accounted for [31]. The effect of refined carbohydrates consumption on myopia differed by sex (β= -0.133; P<0.001; OR=0.87; 95% CI, 0.81– 0.94, Table 4, Fig. 1). The consumption of refined carbohydrates significantly increased the probability of myopia for girls (β= 0.068; P=0.009; OR=1.07; 95% CI, 1.021.13) and decreased it for boys (β= -0.065; OR=0.94; 95% CI, 0.89–0.98; P=0.011). Myopia was associated but not significantly with screen time (β= 0.844; OR= 2.32; 95% CI, 0.89-6.05; P=0.083), and outdoor time seemed protective but was not significant (β= -0.307; OR= 0.74; 95% CI, 0.54-1.01; P=0.057). The age with reading time
168 169 170 171 172 173 174 175 176 177 178 179 180 181 182 183 184 185 186 187
interaction was marginally significant (β= -0.555; OR= 0.57; 95% CI, 0.33-1.00; P=0.050), which indicates less myopia with increased age and reading time. Male sex was inversely associated with myopia (β= -1.047; OR= 0.35; 95% CI, 0.15-0.8; P=0.015) all things being equal. Parental myopia had no significant influence, either when myopia of each parent were considered separately (for both,
P>0.50), or when the number of myopic parent (0, 1 or 2) was considered as a quantitative variable
(P=0.973).
Table 4. Association of risk variables on the probability of myopia in children. For categorical data, the estimates are for one category compared to the reference category (underlined term). For each variable, the estimate β, standard error of the mean (SE), Z value and corresponding P-value, Odd-ratio with 95% confidence interval are given. Bold characters indicates significant (P < 0.05) effects. Italic characters indicates trends (P < 0.1).
β SE z value P(>|z|) OR (95% CI) Intercept -0.253 0.548 0.055 0.956
Refined carbohydrates consumption
(frequency/week) 0.068 0.026 2.615 0.009 1.071 (1.017–1.127) Screen time (hr/day) 0.844 0.488 1.731 0.083 2.326 (0.894–6.049)
Reading time (hr/day) 0.281 1.065 0.264 0.792 1.325 (0.164–10.694) Outdoor time (hr/day) -0.307 0.161 -1.903 0.057 0.736 (0.536–1.009) Mother myopia (yes/no) 0.231 0.438 0.528 0.598 1.260 (0.534–2.975) Father myopia (yes/no) -0.282 0.467 -0.604 0.546 0.754 (0.301–1.885) Sport (yes/no) 0.421 0.501 0.839 0.401 1.523 (0.570–4.073) Age (years) 0.103 0.067 1.548 0.122 1.109 (0.973–1.263) Sex (boys/girls) -1.047 0.430 -2.438 0.015 0.351 (0.151–0.814) BMI z-scores -0.103 0.160 -0.645 0.519 0.902 (0.658–1.235)
Interactions
Age with screen time 0.183 0.129 1.424 0.154 1.201 (0.933–1.547) Age with reading time -0.555 0.283 -1.959 0.050 0.574 (0.330–1.000) Sex with refined carbohydrates
consumption (boys with refined carbohydrates consumption /girls with refined carbohydrates consumption )
-0.133 0.037 -3.565 3 10-4 0.875 (0.814–0.942) 188 189 190 191 192 193 194 195 196 197 198 199
Discussion
This study aimed at evaluating conjoint modifiable risk factors involved in the development of
myopia in a French paediatric population, including the impact of consumption of refined
carbohydrates. We found an association between child myopia and this type of diet. Risk of myopia was increased for girls with refined carbohydrate consumption but decreased for boys. Some already known risk/protective factors of myopia were concurrently detected: screen time was marginally associated with increased probability of myopia and outdoor time seemed protective.
Carbohydrates consumption and myopia. Since the seminal study of Cordain (2002), very few studies had focused on the possible effect of refined carbohydrate consumption on myopia [17, 27].
Here we found a positive association between refined carbohydrates consumption and prevalence of
myopia in girls aged 4 to 18 years but a negative one in boys. Refined carbohydrates (refined starches
and sugars) are rapidly absorbed into the bloodstream, inducing a high peak of insulin
(hyperinsulinemia), The more a carbohydrate is refined, the larger is the glycaemic and insulinaemic
responses which can be measured by the glycemic load [32]. Fructose is an exception, being
metabolised independently of insulin action in the liver. However, chronic hyperinsulinemia and
fructose metabolism leads to insulin resistance [16, 33–35] and compensatory hyperinsulinemia[36–
38], associated with many health challenging condition [39, 40]. Cordain et al. (2002) and recently
Galvis et al. (2016) suggested that this hyperinsulinism could increase the elongation of the globe via
the promotion of increased insulin-like growth factor-1 (IGF-1) and decreased insulin-like growth
factor binding protein-3 (IGFBP-3) action in scleral fibroblasts [16, 17].
The increase in prevalence of myopia observed in all countries or populations that have adopted
a sugar-rich western diet supports this hypothesis [3, 41, 42], even if several social and/or genetics
200 201 202 203 204 205 206 207 208 209 210 211 212 213 214 215 216 217 218 219 220 221
factors are modulating this correlation. For example, Alaskan Inuit moved from a 0-2% prevalence of
myopia to > 50% prevalence in a single generation as a result of a westernised lifestyle including eating
habits [41]. Morgan and Munro (1973) reported similar patterns in several ethnic groups of the Yukon
and Northwest regions of Canada, where myopia prevalence rates were also age-dependent [42]. Wong
et al. (1993) found an increase in myopia prevalence (18.4%) among urban Hong Kong fishermen who
had not attended school, which suggests that lifestyle factors such as changes in eating habits could be
involved in the prevalence of myopia [43].
Unexpectedly, we showed a negative association between refined carbohydrate consumption
and myopia for boys. The result that carbohydrates play different roles in boys and girls was
unexpected, and not previously reported. This result cannot be attributed to quantitative difference in
consumption between the sexes, as the sex had no significant influence on refined carbohydrate
consumption recorded (P = 0.63, details not shown), although the qualitative difference of high refined
carbohydrates consumption was not considered here. This finding could be the due to the frequency of
carbohydrates consumption not really capturing boy's chronic hyperglycemia because boys are more
physically active than girls at all ages [44].
Outdoor time and myopia. Time spent outside seemed a protective factor in myopia, in agreement
with several studies [12, 13, 45], although the association was here marginally significant. It has been
shown in children that the elongation of the globe, and the subsequent increase in myopia, was greater
in winter than summer [46]. This effect could result from the increase exposure to natural light during
lengthening days in summer, or less near-work and more outdoor activities in summer [46]. However,
possible variations in seasonal diet were not controlled for. This protective trend of exposure to natural
light is based on the assumption that such exposure increases the release of dopamine in the retina, a
neurotransmitter known to reduce eye growth in experimental studies [47, 48]. Although these findings
222 223 224 225 226 227 228 229 230 231 232 233 234 235 236 237 238 239 240 241 242 243 244
are from animal models, they are consistent with the results of study in humans.
Near-work and myopia. On-screen and reading activities requiring near vision are described as a risk
factor for myopia [49]. Here, we detected a marginal effect of screen time, although the contribution of
reading time did not seem a significant risk factor. The absence of an effect of reading time could be
due to the relatively young age of the children (32% were < 7 years old; Table 2) with high probability
of illiteracy. The association between near-work and myopia could also be due to people with myopia
engaging in more near-work because taking part in some sports might be difficult when wearing
spectacles. A prospective study reported that myopic children may be more at risk of lower levels of
physical activity than their non-myopic peers [50]. However, we did not find a significant effect of
sport practice on myopia.
Prevalence of myopia. Variations in the prevalence of myopia by geographical location are well
documented [6, 49, 51]. However, the prevalence of myopia in French children has been less studied
than in other countries, with limited current data available to understand its evolution in the context of
the worldwide increase in myopia incidence. Overall, the proportion of myopic patients in our initial
sample reached 32% (38% for girls, 28% for boys). The lower prevalence of myopia in boys is
consistent with data from other countries [13, 52]. However, the representativeness of our sample
relative to the global paediatric population in France is probably biased because data were collected
from hospital consultations, and recruitment included many strabismus patients who were potentially
hyperopic in the context of accommodative strabismus.
Limitations. The size and diversity of the population studied is one of the main limitations. Patients
were recruited during medical consultations, which implies some selection bias. Moreover, although
the composition of dietary intake varies between age 4 and 18 years, only one food frequency
questionnaire was used. In addition, the subjective measurement of refined carbohydrates intake
245 246 247 248 249 250 251 252 253 254 255 256 257 258 259 260 261 262 263 264 265 266 267
through questionnaire is another limitation. A larger cohort and a food frequency questionnaire that is
more age-appropriate will be required to confirm and refine our results.
Conclusion
This study supports the findings of recent research on risk factors for myopia development and brings
new results for the potential effect of refined carbohydrates consumption on this visual disorder.
Further prospective studies are needed to confirm these findings and to disentangle the mechanisms by
which diet can affect myopia. This study also reinforces the belief that modifiable risk factors for
myopia could be targets for future public health actions in France and around the world.
Abbreviations
Not applicable
Declarations
Ethics approval and consent to participate. The study was reviewed and approved by the ethics
committee of Montpellier Hospital Center and complied with the tenets of the Declaration of Helsinki.
Written informed consent was obtained from the parents of all included children and data were
analysed anonymously.
Consent for publication. Not applicable.
Availability of data and materials. The datasets used and/or analysed during the current study are
available from the corresponding author on request.
268 269 270 271 272 273 274 275 276 277 278 279 280 281 282 283 284 285 286 287 288 289
Competing interests. The authors declare that they have no competing interests. Funding. No funding was required for the completion of this study.
Authors’ contributions. Study design : CB, MR and VD. Data acquisition: SM and AC. Analysis and
interpretation of data: CB and MR. Write the manuscript: CB and SM. Revise the manuscript: CB, MR,
MV and VD. All authors have read and approved the content and agree to submit for publication in the
journal.
Acknowledgments
.
We thank the parents and children who participated to this study. This iscontribution ISEM 2020-220 of the Institute of Evolutionary Science of Montpellier.
References
1. Grosvenor T, Goss D. Role of the cornea in emmetropia and eyopia. Optom Vis Sci. 1998;75:132–
45.
2. Flitcroft DI. The complex interactions of retinal, optical and environmental factors in myopia
aetiology. Prog Retin Eye Res. 2012;31:622–60.
3. Pan C-W, Dirani M, Cheng C-Y, Wong T-Y, Saw S-M. The age-specific prevalence of myopia in
Asia: a meta-analysis. Optom Vis Sci. 2015;92:258–66.
4. Chen M, Wu A, Zhang L, Wang W, Chen X, Yu X, et al. The increasing prevalence of myopia and
high myopia among high school students in Fenghua city, eastern China: a 15-year population-based
survey. BMC Ophthalmol. 2018;18:159. 290 291 292 293 294 295 296 297 298 299 300 301 302 303 304 305 306 307 308
5. Holden BA, Fricke TR, Wilson DA, Jong M, Naidoo KS, Sankaridurg P, et al. Global Prevalence of
myopia and high myopia and temporal trends from 2000 through 2050. Ophthalmology.
2016;123:1036–42.
6. Morgan IG, Ohno-Matsui K, Saw S-M. Myopia. The Lancet. 2012;379:1739–48.
7. London DS, Beezhold B. A phytochemical-rich diet may explain the absence of age-related decline
in visual acuity of Amazonian hunter-gatherers in Ecuador. Nutr Res N Y N. 2015;35:107–17.
8. Li S-M, Li S-Y, Kang M-T, Zhou Y, Liu L-R, Li H, et al. Near work related parameters and myopia
in Chinese children: the Anyang Childhood Eye Study. PLOS ONE. 2015;10:e0134514.
9. Mirshahi A, Ponto KA, Hoehn R, Zwiener I, Zeller T, Lackner K, et al. Myopia and level of
education: results from the Gutenberg Health Study. Ophthalmology. 2014;121:2047–52.
10. Vera-Díaz FA, Strang NC, Winn B. Nearwork induced transient myopia during myopia progression.
Curr Eye Res. 2002;24:289–95.
11. Rose KA, Morgan IG, Ip J, Kifley A, Huynh S, Smith W, et al. Outdoor activity reduces the
prevalence of myopia in children. Ophthalmology. 2008;115:1279–85.
12. Dolgin E. The myopia boom. Nature. 2015;519:276–8.
13. He M, Xiang F, Zeng Y, Mai J, Chen Q, Zhang J, et al. Effect of time spent outdoors at school on
the development of myopia among children in China: a randomized clinical trial. JAMA.
2015;314:1142–8.
14. Ramessur R, Williams KM, Hammond CJ. Risk factors for myopia in a discordant monozygotic
twin study. Ophthalmic Physiol Opt. 2015;35:643–51.
309 310 311 312 313 314 315 316 317 318 319 320 321 322 323 324 325 326 327 328
15. Gardiner P. The diet of growing myopes. Trans Opthal Soc U K. 1956;76:171–80.
16. Cordain L, Eaton SB, Brand Miller J, Lindeberg S, Jensen C. An evolutionary analysis of the
aetiology and pathogenesis of juvenile onset myopia. Acta Ophthalmol Scand. 2002;80:125–35.
17. Galvis V, López-Jaramillo P, Tello A, Castellanos-Castellanos YA, Camacho PA, Cohen DD, et al.
Is myopia another clinical manifestation of insulin resistance? Med Hypotheses. 2016;90:32–40.
18. Liu X, Wang P, Qu C, Zheng H, Gong B, Ma S, et al. Genetic association study between insulin
pathway related genes and high myopia in a Han Chinese population. Mol Biol Rep. 2015;42:303–10.
19. Feldkaemper MP, Neacsu I, Schaeffel F. Insulin acts as a powerful stimulator of axial myopia in
chicks. Invest Ophthalmol Vis Sci. 2009;50:13–23.
20. Zhuang W, Yang P, Li Z, Sheng X, Zhao J, Li S, et al. Association of insulin-like growth factor-1
polymorphisms with high myopia in the Chinese population. Mol Vis. 2012;18:634–44.
21. Zhu X, Wallman J. Opposite effects of glucagon and insulin on compensation for spectacle lenses
in chicks. Invest Ophthalmol Vis Sci. 2009;50:24–36.
22. Sheng C, Zhu X, Wallman J. In vitro effects of insulin and RPE on choroidal and scleral
components of eye growth in chicks. Exp Eye Res. 2013;116:439–48.
23. Tang R, Tan J, Deng Z, Zhao S, Miao Y, Zhang W. Insulin-like growth factor-2 antisense
oligonucleotides inhibits myopia by expression blocking of retinal insulin-like growth factor-2 in
guinea pig. Clin Experiment Ophthalmol. 2012;40:503–11.
24. Fountaine CJ, Liguori GA, Mozumdar A, Jr JMS. Physical Activity and Screen Time Sedentary
Behaviors in College Students. Int J Exerc Sci. 2011;4(2):102-12.
329 330 331 332 333 334 335 336 337 338 339 340 341 342 343 344 345 346 347 348
25. Sisson SB, Broyles ST, Baker BL, Katzmarzyk PT. Screen time, physical activity, and overweight
in U.S. youth: National Survey of Children’s Health 2003. J Adolesc Health. 2010;47:309–11.
26. Sandercock GRH, Ogunleye A, Voss C. Screen time and physical activity in youth: thief of time or
lifestyle choice? J Phys Act Health. 2012;9:977-984.
27. Lim LS, Gazzard G, Low Y-L, Choo R, Tan DTH, Tong L, et al. Dietary factors, myopia, and axial
dimensions in children. Ophthalmology. 2010;117:993-997.e4.
28. Kennedy A, Martinez K, Chuang C-C, LaPoint K, McIntosh M. Saturated fatty acid-mediated
inflammation and insulin resistance in adipose tissue: mechanisms of action and implications. J Nutr.
2009;139:1–4.
29. Plessz M, Kesse-Guyot E, Zins M, Czernichow S. Les habitudes alimentaires dans la cohorte
Constances : équilibre perçu et adéquation aux recommandations nutritionnelles françaises. Bull
D’épidémiologie Hebd. 2016;2016:660–6.
30. Fox J, Weisberg S. An R Companion to Applied Regression. SAGE Publications; 2018.
31. Zuur AF, Ieno EN, Elphick CS. A protocol for data exploration to avoid common statistical
problems. Methods Ecol Evol. 2010;1:3–14.
32. Foster-Powell K, Holt SH, Brand-Miller JC. International table of glycemic index and glycemic
load values: 2002. Am J Clin Nutr. 2002;76:5–56.
33. Cordain L, Eades MR, Eades MD. Hyperinsulinemic diseases of civilization: more than just
Syndrome X. Comp Biochem Physiol Part A. 2003;136:95–112.
349 350 351 352 353 354 355 356 357 358 359 360 361 362 363 364 365 366 367
34. Mortera RR, Bains Y, Gugliucci A. Fructose at the crossroads of the metabolic syndrome and
obesity epidemics. Front Biosci Landmark Ed. 2019;24:186–211.
35. Tappy L, Lê KA, Tran C, Paquot N. Fructose and metabolic diseases: New findings, new questions.
Nutrition. 2010;26:1044–9.
36. Seong J, Kang JY, Sun JS, Kim KW. Hypothalamic inflammation and obesity: a mechanistic
review. Arch Pharm Res. 2019;42:383–92.
37. Brown JC, Harhay MO, Harhay MN. The value of anthropometric measures in nutrition and
metabolism: comment on anthropometrically predicted visceral adipose tissue and blood-based
biomarkers: a cross-sectional analysis. Nutr Metab Insights. 2019;12:1178638819831712.
38. Deacon CF. Physiology and pharmacology of DPP-4 in glucose homeostasis and the treatment of
type 2 diabetes. Front Endocrinol. 2019;10:80.
39. Jellinger PS. Metabolic consequences of hyperglycemia and insulin resistance. Clin Cornerstone.
2007;8:S30–42.
40. Craft S. Insulin Resistance and alzheimers disease pathogenesis: potential mechanisms and
implications for treatment. Curr Alzheimer Res. 2007;4:147–52.
41. Young FA, Leary GA, Baldwin WR, West DC, Box RA, Harris E, et al. The transmission of
refractive errors within eskimo families. Am J Optom Arch Am Acad Optom. 1969;46:676–85.
42. Morgan RW, Munro M. Refractive problems in Northern natives. Can J Ophthalmol J Can
Ophtalmol. 1973;8:226–8. 368 369 370 371 372 373 374 375 376 377 378 379 380 381 382 383 384 385 386
43. Wong L, Coggon D, Cruddas M, Hwang CH. Education, reading, and familial tendency as risk
factors for myopia in Hong Kong fishermen. J Epidemiol Community Health. 1993;47:50–3.
44. Trost SG, Pate RR, Sallis JF, Freedson PS, Taylor WC, Dowda M, et al. Age and gender differences
in objectively measured physical activity in youth: Med Sci Sports Exerc. 2002;34:350–5.
45. Chassine T, Villain M, Hamel CP, Daien V. How Can We Prevent Myopia Progression? Eur J
Ophthalmol. 2015;25:280–5.
46. Donovan L, Sankaridurg P, Ho A, Chen X, Lin Z, Thomas V, et al. Myopia progression in Chinese
children is slower in summer than in winter. Optom Vis Sci Off Publ Am Acad Optom. 2012;89:1196–
202.
47. McCarthy CS, Megaw P, Devadas M, Morgan IG. Dopaminergic agents affect the ability of brief
periods of normal vision to prevent form-deprivation myopia. Exp Eye Res. 2007;84:100–7.
48. Jiang L, Long K, Schaeffel F, Zhou X, Zheng Y, Ying H, et al. Effects of dopaminergic agents on
progression of naturally occurring myopia in albino guinea pigs (Cavia porcellus). Invest Ophthalmol
Vis Sci. 2014;55:7508–19.
49. Pan C-W, Ramamurthy D, Saw S-M. Worldwide prevalence and risk factors for myopia.
Ophthalmic Physiol Opt. 2012;32:3–16.
50. Deere K, Williams C, Leary S, Mattocks C, Ness A, Blair SN, et al. Myopia and later physical
activity in adolescence: a prospective study. Br J Sports Med. 2009;43:542–4.
387 388 389 390 391 392 393 394 395 396 397 398 399 400 401 402 403 404
51. Williams KM, Bertelsen G, Cumberland P, Wolfram C, Verhoeven VJM, Anastasopoulos E, et al.
Increasing prevalence of myopia in Europe and the impact of education. Ophthalmology.
2015;122:1489–97.
52. Gao Z, Meng N, Muecke J, Chan WO, Piseth H, Kong A, et al. Refractive error in school children
in an urban and rural setting in Cambodia. Ophthalmic Epidemiol. 2012;19:16–22.
Figure
Fig. 1. Adjusted odd ratios and 95% confidence intervals for the model studying the impact of risk and
control variables on the probability of myopia in children. For categorical data, the estimates are for one category compared to the reference category (underlined term). * P < 0.05 ** P < 0.01 *** P < 0.001
Additional files
Additional file 1.doc
Title: Food frequency questionnaire.
Additional file 2.doc
Title: Originalversion of food frequency questionnaire.
405 406 407 408 409 410 411 412 413 414 415 416 417 418 419 420 421 422
Fig. 1 423 424 425 426 427 428 429
Additional file 1
How often does your child consume the following foods or beverages, regardless of how they are stored (fresh, canned or frozen), when they are eaten (meals or between meals) and where they are consumed (home or out of home) ?
Foods: Never or
almost never Less than once a week 1 time per week 2-3 times per week 4-6 times per week Every day Meat, poultry, egg, fish
Milk
Unsweetened dairy products (cheese, fresh cheese, yogurt, white cheese,…)
Sweetened dairy products (cheese, fresh cheese, yogurt, white cheese,…) (already sweet or in which your child adds sugar, honey, jam, compote...)
Sweet desserts (dessert cream, mousse, ice cream, compote, fruit in syrup), ...
White bread, rusks, crackers, sandwich bread,...
Wholemeal bread, buckwheat bread, rye bread, wholemeal rusks,
Breakfast cereals
Muesli without added sugar
White starchy foods (pasta, rice, potato, semolina, flour, ...)
Wholemeal starchy foods (wholegrain pasta, rice, semolina, flour, ...)
Legumes (lentils, dry beans, chickpeas,...) Vegetables (raw or cooked)
Fruits (excluding pressed fruit juices) Ready to eat food
430 431 432 433
Fast food products (hamburgers, pizzas, quiches,…)
Fried food (french fries, chips, donuts,...) Aperitif snacks
Cookies
Nuts (peanuts, walnuts, hazelnuts, almonds,...)
Cakes, pastries, viennoiseries Chocolate or cereal bars Sweets
Jam, cocoa, honey, sugar
Sugar sweetened beverages (cola, ice-tea,...)
Fruit juices (pressed or not, with or without added sugar) 434 435 436 437 438 439 440 441 442 443 444 445 446
Additional file 2
Habituellement, à quelle fréquence votre enfant consomme-t-il les aliments ou boissons suivants, quel que soit leur mode de conservation (frais, en conserve ou surgelé), le moment de consommation (repas ou hors repas) et le lieu (domicile ou hors domicile) ? Aliments : Jamais ou presque Moins d'1 fois par semaine 1 fois par
semaine 2 à 3 fois par semaine 4 à 6 fois par semaine Tous les jours
Viande, volaille, œufs, poissons, charcuterie Lait
Produits laitiers (fromage, petits suisse, yaourt, fromage blanc,…) non sucrés
Produits laitiers (fromage, petits suisse, yaourt, fromage blanc,…) sucrés (déjà sucrés ou dans lesquels votre enfant rajoute sucre, miel, confiture, compote...)
Desserts sucrés (crème dessert, mousse, glace, entremet, compote avec sucre ajouté, fruits au sirop), ...
Pain blanc, biscottes, pain de mie blanc, tartines craquantes, pains suédois
Pain complet, intégral, au sarrasin, au seigle, biscottes complètes
Céréales pour le petit-déjeuner Muesli sans sucre ajouté
Féculents blancs (pâtes, riz, pomme de terre, semoule, farine, ...)
Féculents de type complet (pâtes complètes, riz complet, semoule complète, farine complète,...) Légumes secs (lentilles, haricots secs, pois-chiche,...)
Légumes crus ou cuits 447
448 449 450
Fruits frais (hors fruits pressés)
Plats cuisinés du commerce (en conserve, surgelés, traiteur,...)
Plats de restauration rapide (hamburgers, pizzas, quiches,…) du commerce (surgelés ou frais).
Aliments frits de type frites, chips, beignets,... Biscuits salés
Biscuits sucrés
Graines (cacahuètes, noix, noisettes, amandes,...)
Biscuits, gâteaux, pâtisseries, viennoiseries Barres chocolatées, de céréales
Bonbons
Confiture, cacao, miel, sucre en poudre ou en morceaux
Sodas, boissons aromatisées sucrées (ice-tea, oasis,...)
Jus de fruits 451
452 453