HAL Id: hal-00628729
https://hal.archives-ouvertes.fr/hal-00628729
Submitted on 20 Aug 2018
HAL is a multi-disciplinary open access archive for the deposit and dissemination of sci-entific research documents, whether they are pub-lished or not. The documents may come from
L’archive ouverte pluridisciplinaire HAL, est destinée au dépôt et à la diffusion de documents scientifiques de niveau recherche, publiés ou non, émanant des établissements d’enseignement et de
Toward an adjustable nonlinear low frequency acoustic
absorber
Riccardo Mariani, Sergio Bellizzi, Bruno Cochelin, Philippe Herzog,
Pierre-Olivier Mattei
To cite this version:
Riccardo Mariani, Sergio Bellizzi, Bruno Cochelin, Philippe Herzog, Pierre-Olivier Mattei. Toward an adjustable nonlinear low frequency acoustic absorber. Journal of Sound and Vibration, Elsevier, 2011, 330 (22), pp.5245-5258. �10.1016/j.jsv.2011.03.034�. �hal-00628729�
Toward an adjustable nonlinear low frequency acoustic
absorber
R. Mariania, S. Bellizzia, B. Cochelin∗,a, P. Herzoga, P.O. Matteia aLaboratoire de Mécanique et d’Acoustique, UPR CNRS 7051
31 chemin Joseph-Aiguier 13402 Marseille Cedex 20, France Tel: +33 4 91 16 40 07, Fax: +33 4 91 71 28 66
Abstract
A study of the target energy transfer (TET) phenomenon between an acoustic resonator and a thin viscoelastic membrane has recently been pre-sented in the paper [R. Bellet et al., Experimental study of targeted energy transfer from an acoustic system to a nonlinear membrane absorber, Journal of Sound and Vibration 329 (2010) 2768-2791], providing a new way to pas-sive sound control in the low frequency domain where no efficient dissipative device exists. This paper presents more experimental results to show that a loudspeaker working outside its range of linearity can also be used as a nonlinear acoustic absorber, instead of a thin viscoelastic membrane. The main advantage of this technology of absorber is the perspective to adjust independently the device parameters (mass, nonlinear stiffness and damping) according to the operational conditions.
To achieve this purpose, quasi-static and dynamic tests have been
per-∗corresponding author.
Email addresses: [email protected] (R. Mariani),
[email protected] (S. Bellizzi), [email protected] (B. Cochelin), [email protected] (P. Herzog), [email protected] (P.O. Mattei)
formed on different types of commercial loudspeakers (one with structural modifications), in order to define the constructive characteristics that the loudspeaker should present. An experimental set-up has been developed us-ing a one-dimensional acoustic linear system coupled through a box (actus-ing as a weak spring) to a loudspeaker acting as an essentially nonlinear oscillator. The tests carried out on the whole vibro-acoustic system have showed the occurrence of the acoustic TET from the acoustic media to the loud-speaker and demonstrated the efficiency of this new kind of absorber at low frequencies over a wide frequency range. Moreover, the experimental anal-yses conduced with different NES masses have confirmed that it is possible to optimize the noise absorption with respect to the excitation level of the acoustic resonator.
Key words: Targeted Energy Transfer, tuned acoustic absorber, nonlinear
1. Introduction
In the last ten years, numerous research studies have been performed in order to develop nonlinear vibration absorbers that exploit the phenom-ena called Targeted Energy Transfer (TET) or Energy Pumping [1], [2], [3]. This phenomena can be obtained by coupling a damped oscillator with an essentially nonlinear stiffness (absorber) to a linear primary system, whose dynamic response has to be controlled. If the nonlinear system is properly designed for the linear system and its operational conditions, an irreversible energy transfer from the linear system toward the absorber occurs, the energy is dissipated in the absorber damper and the forced dynamic response of the primary system is limited [4]. This means that the nonlinear system behaves
like a "sink" where there is a motion localization and an energy dissipation (in literature this is often called Nonlinear Energy Sink: NES).
The complex dynamics of this kind of coupled systems can be described en terms of resonance capture [2] or nonlinear normal modes [5]. As men-tionned above [4], under periodic external excitation applied to the linear primary system, the nonlinear absorbers can efficiently reduce the resonance peak by entering the whole system in a quasi-periodic motion with repetitive TET phase that has been named “strongly modulated response” in [6]. The very important point is that this peak reduction can occurs in a large fre-quency band, with the NES adapting itself to the resonance frequencies of the primary system. On the others hand, the NES can operate efficiently only in a limited range of the excitation amplitude. As a result the design and the tuning of a NES absorber is very different from that of linear absorbers, since they have very differents limitations. Indeed, a linear absorber can work well for a large excitation amplitude but only in a very narrow frequency band.
In parallel to theoretical and numerical studies, the concept of NES has also been developed and validated experimentally. In the context of vibra-tion reducvibra-tion, essential (nonlinearizable) stiffness nonlinearities have been experimentally implemented with two linear springs having polynomial (in general cubic) nonlinearity. In [7], piano wires have been used as springs whereas in [8] two linear helical springs have been considered. Essential stiff-ness nonlinearity has also been experimentally implemented using an single vibroimpacting mass [9]. In the field of acoustic and in the context of noise reduction , the TET provides a promising approach to passive sound con-trol of an acoustic resonator in the low frequency domain, where no efficient
dissipative mechanism exists. Extending the results in [10], it was shown in [11] that a thin viscoelastic membrane performing large amplitude oscilla-tions can be an efficient NES that is able to operate on the first few modes of an acoustic resonator. Such membrane NES are cheap, easy to build and reliable, but their mechanical characteristics result from their design (they depend on the radius, the thickness and the material of the membrane). They cannot be adjusted when fitted or during the NES operation, which can be a limitation for the optimization of the NES performance.
One answer to this limitation can be obtained developing an acoustic NES that makes use of a loudspeaker (LS). This kind of device is more elaborate but it presents several advantages over the membrane device. The most im-portant one is that it allows to adjust independently the different parameters of the NES (in terms of nonlinear restoring force, mass and damping) and thus to optimize its effectiveness with respect to the operational conditions. For example, the mass can be increased by mounting additional weights on the moving part of the LS and the damping can be controlled by exploiting the electromagnetic circuit of the LS (motor). Last but not least, this motor connects the acoustic system to an electric circuit, possibly giving additional degrees of freedom for adjusting its properties. Such features have already been used for linear acoustic absorbers [12, 13]. Nevertheless, some draw-backs in the use of the LS technology exist. The LSs are generally designed to have an elastic response as linear as possible and a large damping. These two aspects that are in contradiction with the TET requirements.
The main objective of this work is to show that it is possible to obtain TET in acoustics by using a LS NES. The second objective is to indicate
the constructive characteristics that a LS needs to be used as an acoustic NES. Finally, we want to show the interest of adjusting the NES parameters, especially its mass and damping, in order to adapt it to targeted operational conditions. The paper is organized as follows : in Section 2 the princi-ple of TET is recalled by means of numerical simulations of the free and forced response of a simple 2 Degrees of Freedom (DOF) system. In section 3 a numerical analysis shows the importance to adjust the NES mass and damping. Section 4 deals with quasi-static and dynamic tests performed on different types of loudspeakers to characterize their dynamic behavior. From these tests a candidate LS for use as a NES is defined and the parameters of a 1 DOF model able to describe its low frequency dynamics are identi-fied. Section 5 describes the experimental set-up used in the TET tests and the associated theoretical model. The results of the energy pumping tests are illustrated and discussed in Section 6. The last Section deals with the conclusions of this study.
2. NES principle and TET description
In this section the most important aspects of the Targeted Energy Trans-fer (TET) from a linear primary system to a grounded NES are recalled using numerical illustrations. A complete analysis is beyond the scope of this paper: it can be found in [3].
The discrete mechanical system under study is shown in Fig. 1. This system includes a linear oscillator with an attached grounded NES. The linear oscillator (or primary linear system) is characterized by a mass m1, a linear
Figure 1: A classical two DOF system for illustrating the targeted energy transfer (energy pumping) phenomena.
grounded NES) by a mass m2, a cubic nonlinear spring of stiffness kN L and a
viscous damping c2. The two oscillators are weakly connected by means of a
linear spring of stiffness kc. Introducing the non-dimensional time t = τ/ω1,
where ω1 =
q
k1
m1 is the natural frequency of the primary linear system, the
equations of motion can be written as:
¨ u1 + µ1˙u1+ u1+ β(u1− u2) = 0 (1) γ ¨u2+ µ2˙u2+ α2u32+ β(u2− u1) = 0 (2) where β = kc k1, γ = m2 m1, µ1 = c1 √ k1m1, µ2 = c2 √ k1m1 and α2 = kN L k1 .
Eqs (1)(2) will be used first to analyze the behaviour of the system under free response, and then under forced response with an external excitation applied to the primary mass m1, thus adding an external force to Eq. (1).
Subsequent numerical results are obtained solving the equations of motion using an explicit Runge-Kutta solver.
Figure 2: Free response of the system with β = 0.1, γ = 1, µ1 = 0, µ2= 0.1 and α2= 1.
Initial conditions : ˙u2(0) = u1(0) = u2(0) = 0 with (a) ˙u1(0) = 2 and (b) ˙u1(0) = 4 .
2.1. Free response
Numerical evidence of nonlinear energy pumping can be observed on the free responses of the system (1)(2) to an impulsive excitation defined by the initial conditions u1(0) = u2(0) = ˙u2(0) = 0 and ˙u1(0) different from zero.
Fig. 2 shows that the time response of the two oscillators changes significantly when the impulse level ˙u1(0) applied on the mass of the primary system
is varied. When ˙u1(0) = 2 (Fig. 2(a)), the system is weakly excited, the
oscillation amplitude of the primary system is larger than that of the absorber and its exponential decrease is slow as it is lightly damped. Furthermore, the two masses oscillate at the same frequency and are out of phase.
terms of initial velocity condition) is exceeded: ˙u1(0) > ˙u01,T. The response
of the system is then characterized by two different behaviors. In the ini-tial phase (0 < t < 100), the displacement of the two oscillators is almost in-phase, the oscillation amplitude of the NES is large and the decay of the primary system amplitude is linear and very fast compared with the previous case: this is the energy pumping condition, characterized by an irreversible transfer of energy from the primary system to the nonlinear subsystem (en-ergy localization in the NES), where it is dissipated. In the second phase (t > 100), the behavior of the two oscillators is similar to that of the weakly excited case, showing out-of-phase displacements. Only the linear damping is acting so oscillations decay slowly: the energy pumping phenomena vanishes below a certain amplitude of oscillation, for which the residual energy of the primary system is smaller than in the previous case. The efficiency of energy pumping can be studied analytically, as for example in refs. [14][15].
2.2. Forced response
Numerical evidence of nonlinear energy pumping can be observed on the steady state responses of the system (1)(2). The displacement has been sim-ulated under forced harmonic excitation starting with zero initial conditions F (t) = F0sin(Ωt), applied to the primary mass. Fig. 3 shows the
normal-ized values of the displacement amplitude of the primary system versus the frequency of excitation force F (t) for t ≥ 0 for different values of the force amplitude F0. The frequency responses of the associated linear system is also
reported on Fig. 3. The associated linear system is defined from Eqs. (1)(2) assuming the mass m2 at rest (u2 = 0).
Figure 3: Frequency responses of the primary system for various force amplitude. (β = 0.15, γ = 1, µ1= 0.01, µ2= 0.3, α2= 1).
on the amplitude of the excitation. For a small force amplitude the energy pumping does not occur and the frequency response of the primary system is similar in the whole frequency range to that of the underlying linear system. An increase of the excitation level leads to the pumping regime (peak limit-ing) over a frequency range that increases with the force amplitude. However if the excitation level exceeds a certain value, the primary system response exhibits again a resonance peak at a frequency lower than the linear system natural frequency. There is thus a specific force value F0 for which the
re-duction of the primary system motion is optimal over a wide frequency range around its natural resonance frequency. Around this level, the system time response alternates between the pumping and non-pumping conditions, with a modulation of oscillation amplitudes and a continuous change of phase. A theoretical analysis of these different regimes can be found in [16] [17].
3. Influence of the damping and mass of the NES
Figure 4: Dependence of pumping threshold (v10,threshold) in term of ˙u1(0) ( ˙u2(0) =
u1(0) = u2(0) = 0) versus the NES damping coefficient µ2. (Free response with β = 0.1,
γ = 1, µ1= 0, α3= 1, T = 1000 and Te= 100).
The behavior of the system (especially regarding the TET threshold and the response of the primary linear system) is strongly dependent on both damping and mass of the nonlinear absorber. In Fig. 4 the pumping thresh-old in the case of free response is plotted as a function of the damping coeffi-cient µ2 of the NES. The pumping threshold, denoted v10,threshold, is defined
Appendix A. It corresponds to the initial condition ˙u1(0)giving the
appear-ance of the two phases in the free response with an important reduction of the response amplitude of the primary system at the end of the first phase. This curve shows that the TET threshold increases with the damping of the nonlinear absorber.
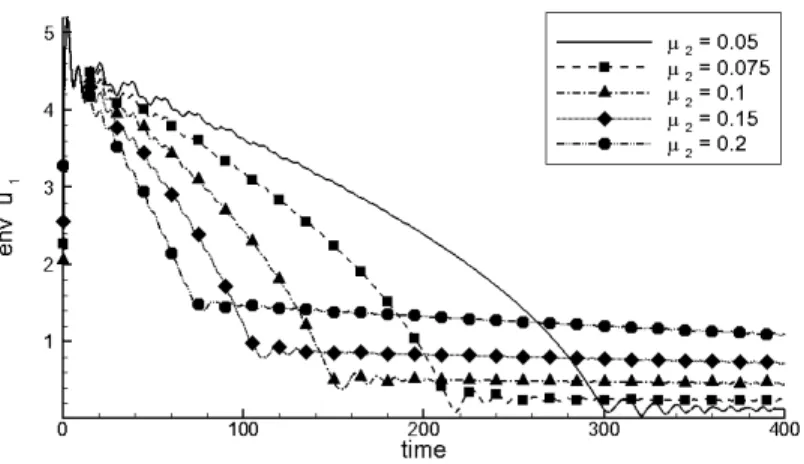
Fig. 5 presents amplitude envelopes of the free responses of the primary mass in the case of an impulsive excitation ˙u1(0) = 5 for different values of
Figure 5: Envelope of the free response of the primary system for various values of the NES damping coefficient µ2. ( ˙u1(0) = 5, ˙u2(0) = u1(0) = u2(0) = 0, β = 0.1, γ = 1,
µ1= 0, α2= 1).
the damping coefficient µ2(smaller that 0.4 which is the upper value ensuring
pumping, see Fig. 4). These curves show that a small value of the damping is associated to a small residual motion of the primary system after the pumping phase. On the other hand, a large value of µ2 increases the residual motion
but allows a faster decay of the amplitude of the primary system during the pumping phase.
In Fig. 6 the frequency response of the primary system is presented for two different values of the NES damping coefficient µ2and three values of the
excitation level. When µ2 = 0.1(Fig. 6(a)) the best reduction of the primary
system response is obtained for F0 = 0.1. A higher level of excitation leads
to a new resonance at lower frequency. On the other hand, when µ2 = 0.3
(Fig. 6(b)) the performances of the NES are moderate for F0 = 0.1 and very
Figure 6: Dependence of the frequency response of the primary system on the NES damp-ing coefficient µ2: (a) µ2= 0.1, (b) µ2= 0.3. (β = 0.12, γ = 1, µ1= 0.01, α2= 1).
the primary system response occurs. The system presents a similar behavior when varying the mass ratio γ as shown in Fig. 7. In this case the frequency response of the primary system for three excitation levels is plotted for two different values of γ. These results show that it is possible and desirable to optimize the performance of the absorber with respect to the excitation level by varying its damping and/or its mass.
In the case of TET application in acoustics the advantage of building a NES using a loudspeaker technology is to adjust independently these two pa-rameters: additional masses can be easily installed on the moving part of the LS and the the mechanical damping can be increased by electromagnetic cou-pling with an external electric circuit. However, this requires specifications which seem different than those for audio use.
Figure 7: Dependence of the frequency response of the primary system on the mass ratio γ: (a) γ = 0.7, (b) γ = 1.2. (β = 0.12, µ1= 0.01, µ2= 0.1, α2= 1).
4. Characterization of loudspeakers
A generic LS structure is presented in Fig. 8. The equivalent mass is given by the moving parts (diaphragm, dust cap and voice coil), the elastic and dis-sipative behaviors are determined by the diaphragm surround (peripherical suspension) and by the "spider" (central suspension used for the alignment between the voice coil and the pole pieces). Various sources of damping exist in such a LS: mechanical damping in suspensions, sound radiation, electrical damping, etc. An unexpected one is related to the flow between the voice coil and the pole pieces, which has been found quite significant during dynamic tests. Audio LS are usually designed with a linear behaviour over a large displacement range, and with high damping.
To develop an acoustic NES that fully exploits a loudspeaker (LS) tech-nology, the required mechanical characteristics are: a strong nonlinear elastic behavior with a limited linear stiffness (in order to have a low threshold and a high efficiency), a limited mass (for a given area of the diaphragm) and a
Figure 8: Loudspeaker structure with motor assembly, and without motor assembly.
low damping (allowing a large adjustement range when adapting the NES to the operational conditions). Candidate LS have been searched from man-ufacturer data, selecting the units which we felt were closer to our needs. Three kinds of LSs have been tested. The first one (LS1), shown in Fig. 9, is a commercial model characterized by a half-torus shape surround made of elastomer and a diaphragm in polypropylene. The second one (LS2) shown in Fig. 10 is a commercial model with a paper diaphragm and a corrugated surround. The third one (LS3) shown in Fig. 11 is obtained by replacing the surround of a commercial model by a flat ring of latex, weakly stretched. This latter unit has been used as NES to perform the pumping tests.
Two different kind of experimental tests have then been carried out on these LSs to assess their suitability as acoustic NES: (i) quasi-static tests for the elastic and dissipative characterization of the LS in term of axial response, (ii) dynamic tests for the identification of the equivalent mass and
first ("piston") mode damping. The dynamic tests have been carried out both with (Fig. 8(a)) and without (Fig.8(b)) the motor assembly, in order to evaluate its contribution on the mechanical damping. For the quasi-static tests the motor assembly has been removed to allow a reliable mounting on the experimental set-up. Only the results of the quasi-static tests are presented in detail; the dynamic tests results are only described qualitatively. 4.1. Quasi-static tests
The quasi-static tests have been carried out on the LSs without motor assembly using an electromechanical testing machine (a MTS servohydraulic test system). The LS frame has been attached to the chuck of the machine and the LS moving part fixed to a load measuring cell. An axial displacement has been imposed to the LS basket and the reaction force has been measured by the load cell. The tests have been performed by using symmetric triangu-lar (constant velocity) cycles with different velocity-amplitude combinations. For each of the three LS under test (measured without motor assembly), the figures (c-d) of figs. 9, 10 and 11 represent measurements of force versus displacement with (i) a maximal displacement related to the LS (1 mm, 1 mm and 6 mm respectively) and different velocities (figures (c)) and (ii) a constant velocity of 5 mm/min and different amplitudes (figures (d)).
Figure 9(c-d) shows the results concerning the tests carried out on LS1. The pronounced dependence of the cycles on both velocity and amplitude points out important viscous effects. Moreover, as well as a large dissipative behavior, it is possible to observe how the elastic behavior is weakly nonlinear even in the case of large deformations. The quasi-static tests have been repeated after the removal of the central suspension of the LS (the "spider").
(a) (b)
Figure 9: LS1 without motor assembly: (a) picture, (b) surround detail, (c) displacement diagram with cycle amplitude of 1 mm at various velocity, (d) force-displacement diagram at velocity of 5 mm/min for various cycle amplitudes.
The results are not presented in this paper, as they show that the spider adds a negligible dissipation and only increases the stiffness in the nonlinear range. This suggests that its role is marginal for our purpose, and that it should be kept for pumping tests.
Figure 10(c-d) shows the results of the tests carried out on LS2. It is characterized by a large stiffness and a limited dissipative behavior. Its elastic response remains almost linear within a large range of deformations and becomes strongly nonlinear on a very limited range of deformations, very
(a) (b)
Figure 10: LS2 without motor assembly: (a) picture, (b) surround detail, (c) displacement diagram with cycle amplitude of 1 mm at various velocity, (d) force-displacement diagram at velocity of 5 mm/min for various cycle amplitudes.
close to the limit of irreversible damage, thus prohibiting its utilization as a NES.
The best characteristics for the use as an acoustic NES have been found for LS3: the results show a moderate dissipative effect and a large ratio between the nonlinear and linear component of elasticity. The cycle depicted with a red line in Fig. 11(c) results from a test carried out at a velocity of 5 mm/min with a pause of 30 min every 1.5 mm of displacement, allowing for relaxation of the surround material. It has been performed in order to identify
(a) (b)
Figure 11: LS3 without motor assembly: (a) picture, (b) surround detail, (c) displacement diagram with cycle amplitude of 6 mm at various velocity, (d) force-displacement diagram at velocity of 5 mm/min for various cycle amplitudes.
its behavior when dissipative effects are minimized (almost independent on the velocity) in order to identify the elastic characteristics of LS3.
4.2. Dynamic tests
Dynamic tests of the LS have been performed by fixing them on a face of a wooden box, an acoustic pressure being generated by another loudspeaker fixed on the opposite face of the box. The acoustic pressure on the LS diaphragm has been measured by a microphone located near the box center. The LS diaphragm axial velocity has been measured by a laser vibrometer.
diaphragm area [m2] 1 − st mode nat. freq. [Hz] visc. damp. coeff. [kg/s] mass [kg]
LS1 0.0117 42 0.68 0.009
LS2 0.0254 120.5 0.49 0.011
LS3 0.0254 25.5 0.37 0.017
Table 1: Results of dynamic tests on LS (without motor assembly).
Calculating the frequency response function between the velocity and the pressure allowed to estimate the mechanical impedance of le LS. These tests have been carried out with various excitation levels (to check the linearity of the system) and using three different values of mass (two different masses have been added to the moving mass of LS). The first natural frequency and modal damping have been calculated from the frequency response function, from the central frequency and −3 dB bandwidth. The equivalent mass of the moving part of the LS has then been obtained from the shifts of resonance frequency when masses are added. The parameters identified for the three LSs (without motor assembly) are presented in table 1.
A comparison (not shown here) between the frequency response functions obtained with and without the motor assembly showed that it can signifi-cantly increase the dissipation depending on the structure of the LS pole pieces. In the case of LS1 the motor increases the damping coefficient by about 5 times, although in the case of LS3 the increase is only 50%.
4.3. Nonlinear elastic behavior of experimental NES
From the previous results, LS3 has been chose as a candidate for building a NES. In order to perform numerical simulations, its nonlinear elastic behavior has been approximated by a 5-degree polynomial which has been calculated
by fitting the loaded-unloaded mean values of the equilibrium points obtained from the quasi-static test (see Fig. 11(c)) with relaxation. The resulting theoretical model is the following:
mnesu¨nes+ cnes˙unes+ nN L
X
i=1
knes,i(unes)i = 0 (3)
The coefficients of this polynomial are knes,1 = 235N/m, knes,2 = −1970N/m2,
knes,3 = 2 × 10⁷ N/m3, knes,4 = 1.09 × 10⁹ N/m4, knes,5 = 6.5 × 10¹⁰ N/m5.
The even terms of the polynomial allow to describe the asymmetry of the experimental curve (Fig. 11(c)).
5. Vibro-acoustical experimental set-up and sizing
In order to validate the suitability of the LS technology, a experimental set-up has been realized to observe and to analyse the targeted energy trans-fer(energy pumping) phenomenon from an acoustic medium to the LS3 unit. It is based on the same principle used in [11]. A schematic of the set-up is provided in Fig. 12. The acoustic medium is composed by a tube of length L and section area St (half-wavelength acoustic resonator). The coupling
between the tube and the NES (here a LS3 structure) is ensured acoustically by the air in the coupling box (at right on Fig. 12) of volume V2. For the
excitation of the tube, a loudspeaker and a coupling box connected to the entrance of a tube (at left on Fig. 12) are used as an acoustic source.
As described in [11] and under the same assumptions (that is, the two boxes are designed so that the acoustic behavior of the tube is close to the one of an open-open waveguide), a simple model for the experimental set-up can be obtained. Indeed, when the tube is excited at a frequency close to its first
Figure 12: Sketch of experimental set-up using the LS3 without motor assembly as NES.
resonance frequency, the dynamics of the air it contains remains symmetric, and a linear 1-DOF system can approximate the response of the tube. On the other hand, the behavior of the acoustic NES can be approximated by the 1-DOF spring-mass nonlinear with equation of motion given by Eq. (3). A weak vibro-acoustic coupling between the air in the tube and the NES is achieved by the compressibility of the air contained in the coupling box V2
where the pressure can be considered uniform. The vibro-acoustic behavior of the experimental set-up can be then approximated by the following equations: mau¨a(t) = −ct˙ua(t) − ktua(t) − Stpb(t) + Stpssin(ωst) (4)
mnesu¨nes(t) = −cnes˙unes(t) − nN L
X
i=1
knes,i(unes(t))i− Snespb(t) (5)
where ua(t)is the displacement of the air at the right end of the tube (x = L),
with an axial distribution corresponding to the first mode of the tube (i.e Ua(x, t) = ua(t) cos(πxL)). This displacement is proportional to the pressure
pt(t)at middle axial position of the tube (Pt(x, t) = pt(t) sin(πxL)) accordingly
to the relationship ua(t) = −πρLac2 0pt(t). The quantities ma = ρaStL 2 , kt = π2c2 0ρaSt
2L and ct represent the mass, the stiffness and damping of the 1-DOF
source is represented by the sinusoidal acoustic pressure pssin(ωst)at the left
end of the tube. In Eq. (5) (and as introduced in section 4.3), unes(t), Snes ,
mnesand cnes are the axial displacement, the equivalent section, the mass and
the damping coefficient of the NES; knes,i are the coefficients of its nonlinear
elastic reaction. The vibro-acoustic coupling between the two subsystems is given by the pressure into the coupling box pb(t)which is dependent on ua(t)
and unes(t)accordingly to:
pb(t) = ρac20 Vb (Stua(t) − Snes 2 unes(t)) (6)
Introducing the following adimensional quantities and time normalization u1 = 2St Snes ua d , u2 = unes d and τ = ωt with ω 2 = kt ma (7)
where d is a characteristic length of the experiment (d have to be chosen), the equations of motion Eqs. (4)(5) reads now
¨
u1+ µ1˙u1+ u1+ β(u1− u2) = F sin(Ωτ ) (8)
γ ¨u2 + µ2˙u2+ f (u2) + β(u2− u1) = 0 (9) where β = 2StL π2V b , µ1 = 2ct πc0ρaSt , γ = 4Stmnes ρaLSnes2 , µ2 = 4Stcnes πc0ρaSnes2 , (10) f (u2) = nN L X i=1
α2,iui2 with α2,i =
4StLdi−1 π2c2 0ρaSnes2 knes,i, (11) F = 4L π2c2 0ρaSnesd Stps, and Ω = ω ωs . (12)
It is interesting to note that the parameters β, µ1, γ and µ2 do not depend
on the length adimensional parameter d. The difference between the experi-mental system represented by Eqs. (8)(9) compared to the ones described by
Eqs. (1)(2) is that the elastic behavior of the NES it is now represented by a polynomial of degree five containing also a linear part.
To determine a combination of geometrical parameters of the vibro-acoustical experimental set-up which is able to produce TET with a reasonable level of pressure into the tube, Eqs. (8)(9) combined with the numerical values of the parameters of the LS3 model (see table 1 and section 4.3) have been used. The following characteristics for the tube and the coupling box were retained: tube length L = 3.85 m, tube area St = 0.045 m2, coupling box
volume V2 = 0.28 m3. The associated numerical values of β, µ1, γ and µ2
are given Table 2. These numerical values are very closed to the numerical ones used in section 2 in particular for the main parameters β and γ. .
β µ1 γ µ2
0.1254 0.014 0.9477 0.07
Table 2: Numerical values of the adimensional system parameters.
Finally, it is interesting to note that the dimensions of the vibro-acoustical experimental set-up used in this wook differ significantly from the one used in [11]. The tube area is seven times the tube area used in [11] and the coupling box volume is ten times the coupling box volume used in [11]. 6. Experimental results
The experimental tests to achieve acoustic targeted energy transfer have been performed by using LS3 without motor assembly as the NES, with three different values of its mass. The motor has been removed to achieve a low enough pumping threshold and therefore to allow a parametric analysis of the
absorber mass influence. As a consequence no parametric analysis could be conducted about additional electromagnetic damping. Three values of mass have been used: m0 = 0.017 kg (original mass of the NES) m1 = 0.012 kg
(obtained by removing the voice coil of the loudspeaker) and m2 = 0.022kg
(obtained by adding a mass of 0.005 kg). The measurements have also been carried out on the system without the NES but keeping the coupling box in order to evaluate the linear absorption. This configuration corresponds to the associated linear system as described in Section 2.
The tests were performed by exciting the tube by means of an acoustic source powered by an harmonic voltage signal Vextsin(ωst) provided by an
loundspeaker ( see Fig. 12). The mode power amplifier (InterM R150) driving the loundspeaker was operated in tension-feedback mode. During a test, the corresponding responses were measured: the acoustic pressure at the middle section of the tube and in the coupling box by means of two microphones and the velocity of the LS3 diaphragm by means of a laser vibrometer (see Fig. 12). A multi-channel analyzer/recorder (OROS OR38) including a signal generator was used to control the tests. A constant amplitude frequency linear sweep was used to analyze the behavior of the system in the frequency domain. The sweep was generated by the analyzer in the frequency range [35, 60]Hz with a frequency step equal to 0.125Hz. At each frequency step, a sampling frequency of 800 Hz and number of samples recorded equal to 6400 were recorded.
In Fig. 13 the frequency response, i.e. the pressure (pt(L/2, t) measured
at the middle section of the tube divided by the amplitude of excitation signal Vext, is plotted in the case of system with mass mnes = 0.017kg, without and
Figure 13: Experimental results: frequency response without NES and with NES for different excitation levels (mnes= 0.017 kg).
with a NES for various excitation levels. When the excitation level exceeds the pumping threshold (here for Vext > 8 V), a significant reduction of the
response amplitude is observed. Moreover, this reduction increases when increasing the excitation level. In comparison with the numerical results shown in Fig. 3, the secondary resonance that could be expected for very large levels barely appears, because our experimental set-up does not allow to reach a sufficient excitation level.
Some regimes observed under sinusoidal excitation are compared in Fig. 14. We focus on the behavior of the system under sinusoidal excitation at the frequency near the fisrt acoustic mode (here ωs
2π = 45.75) for several
excita-tion levels. When the excitaexcita-tion level is small (Fig. 14(a-b)), the regime is periodic. The LS is inative and has small vibrations. If the excitation level increases, the level is geather than a certain pumping threshold (here for Vext > 8 V) and the regime is almost periodic with a slow evolution of the
Figure 14: Experimental results: periodic regime under sinusoidal excitation at the fre-quency ωs
2π = 45.75 with input voltage (a) Vext = 0.8, (b) Vext = 8V,(c) Vext = 12V,(d)
envelope of the vibrations (Fig. 14(c)). This regime corresponds to strongly modulated responses [3]. The amplitude of the pressure at the middle of the tube increases and decreases. When the pressure amplitude decreases, the vibrations of the pressure and the LS are out of phase. Increasing the excitation level, the regime becomes again periodic (Fig. 14(c)) but now the the vibrations of the pressure and the LS are always out of phase.
In Fig. 15 the frequency response of the system in the cases mnes = 0.012
kg and mnes = 0.022 kg are compared for two different excitation levels.
When Vext= 16V, the reduction of the tube pressure is larger with a mnes =
0.012 kg. On the other hand for Vext = 28 V, the performance of the NES
with mnes = 0.012kg deteriorates (the effect of the secondary peak begins to
be important) and, except in the frequency range [47, 49] Hz, the reduction of the acoustic pressure is larger by using mnes = 0.022kg.
Figure 15: Experimental results: Dependence of the frequency response on the NES mass (mnes= 0.012 kg and mnes= 0.022 kg): (a) Vext= 16 V, (b) Vext= 28 V.
7. Conclusion
This work has investigated the possibility to build an adjustable nonlinear acoustic absorber for the reduction of low frequency noise. The main idea is to use a loudspeaker as an acoustic NES instead of a viscoelastic membrane, as proposed in ref. [11]. Numerical simulations have demonstrated the interest of being able to adjust two NES parameters (mass and damping) depending on the operational conditions (especially the excitation level).
Dynamic and quasi-static tests have been performed on different type of loudspeakers (one with a surround modification) in order to select a LS adapted to the purpose of acoustic TET. The mechanical property required are: small mass/area ratio of the diaphragm, limited dissipative behavior and elastic response exhibiting a strong nonlinearity. Experimental analyses showed that the dissipative and elastic behavior of the LS mainly depends on the characteristics of the diaphragm surround. To limit the damping of the LS and to reach a sufficiently nonlinear elastic response, the use of an elastomer diaphragm surround with a flat shape and weakly stretched is proposed.
The tests for the LSs characterization have also permitted to identify the parameters of a nonlinear 1-DOF model able to describe the low frequency dynamics of the selected LS. Numerical simulations based on the use of this model have been performed to design an experimental set up. Experiments could then be carried out, showing the occurrence of the acoustic TET from the acoustic resonator to the NES, and proving the efficiency of this NES for the reduction of a resonance level. Moreover, experimental analyses with different values of NES masses have confirmed that is possible to adapt it to
the excitation level range to be controlled. Acknowledgment
This research was supported by French National Research Agency in the context of the ADYNO project (ANR-07-BLAN-0193).
A. Pumping threshold
The pumping threshold can be estimated from the responses of the system (1)(2) over [0, T ] (for enough large T ) to impulsive excitations defined by the initial conditions u1(0) = u2(0) = ˙u2(0) = 0 and ˙u1(0) = v10(6= 0).
To this end, the averaged value of the normalized energy still accumulated by the mass m1 up to the time interval [T − Te, T ] is computed by
E(v10) = 1 E0 Z T T −Te Eu1(t)dt (13) where Eu1(t) = 1 2u1(t) 2+1
2˙u1(t)denotes the energy of the mass m1, E0 = 1 2v
2 10
is the total energy of the system at t = 0 and Te > 0is small with respect to
T.
Plotting E(v10)versus v10, the pumping threshold denoted v10,theshold
cor-responds to the v10 value where a negative abrupt change of E(v10) occurs
with increasing values of v10.
References
[1] O. Gendelman, L. Manevitch, A. Vakakis, R. M’Closkey, Energy pump-ing in nonlinear mechanical oscillators: Part I - Dynamics of the un-derlying hamiltonian systems, Journal of Applied Mechanics 68 (2001) 34–41.
[2] A. Vakakis, O. Gendelman, Energy pumping in nonlinear mechanical oscillators: Part II - Resonance capture, Journal of Applied Mechanics 68 (2001) 42–48.
[3] A. Vakakis, O. Gendelman, L. Bergman, D. McFarland, G. Kerschen, Y. Lee, Nonlinear targeted energy transfer in mechanical and structural systems, Vol. 156 of Solid mechanics and its applications, Springer, 2008. [4] E. Gourdon, N. Alexander, C. Taylor, C. Lamarque, S. Pernot, Non-linear energy pumping under transient forcing with strongly nonNon-linear coupling: Theoretical and experimental results, Journal of Sound and Vibration 300 (2007) 522–551.
[5] G. Kerschen, M. Peeters, J. Golinval, A. Vakakis, Nonlinear normal modes, part I: A useful framework for the structural dynamicist, Me-chanical Systems and Signal Processing 23 (1) (2009) 170–194.
[6] Y. Starosvetsky, O. Gendelman, Dynamics of a strongly nonlinear vibra-tion absorber coupled to a harmonically excited two-degree-of-freedom system, Journal of Sound and Vibration 312 (2008) 234–256.
[7] X. Jang, D. McFarland, L. Bergman, A. Vakakis, Steady state passive nonlinear energy pumping in coupled oscillators: theoretical and exper-imental results, Nonlinear Dynamics 33 (2003) 87–102.
[8] E. Gourdon, N. Alexander, C. Taylor, C.-H. Lamarque, S. Pernot, Non-linear energy pumping under transient forcing with strongly nonNon-linear coupling: Theoretical and experimental results, Journal of Sound and Vibration 300 (2007) 522–551.
[9] F. Nucera, F. Lo Iacono, D. McFarland, L. Bergman, A. Vakakis, Ap-plication of broadband nonlinear targeted energy transfers for seismic mitigation of a shear frame: Experimental results, Journal of Sound and Vibration 313 (2008) 57–76.
[10] B. Cochelin, P. Herzog, P.-O. Mattei, Experimental evidence of energy pumping in acoustics, C. R. Mecanique 334 (11) (2006) 639–644. [11] R. Bellet, B. Cochelin, P. Herzog, P.-O. Mattei, Experimental study of
targeted energy transfer from an acoustic system to a nonlinear mem-brane absorber, Journal of Sound and Vibration 329 (2010) 2768–2791. [12] H. Lissek, X. Meynial, A preliminary study of an isodynamic transducer for use in active acoustic materials, Applied Acoustics 64 (2003) 917– 930.
[13] R. Boulandet, H. Lissek, Optimization of electroacoustic absorbers by means of designed experiments, Applied Acoustics 71 (2010) 830–842. [14] L. Manevitch, E. Gourdon, C. Lamarque, Parameters optimization for
energy pumping in strongly nonhomogeneous 2 dof system, Chaos, Soli-tons and Fractals 31 (2007) 900–911.
[15] T. Pham, S. Pernot, C.-H. Lamarque, Competitive energy transfer be-tween a two degree-of-freedom dynamic system and an absorber with essential nonlinearity, Nonlinear Dynamics Available on line (2010) (In press).
[16] O. Gendelman, E. Gourdon, C. Lamarque, Quasiperiodic energy pump-ing in coupled oscillators under periodic forcpump-ing, Journal of Sound and Vibration 294 (2006) 651–662.
[17] Y. Starosvetsky, O. Gendelman, Strongly modulated response in forced 2DOF oscillatory system with essential mass and potential asymmetry, Physica D 237 (2008) 1719–1733.
Figure captions
• Figure 1: A classical two DOF system for illustrating the targeted energy transfer (energy pumping) phenomena.
• Figure 2: Free response of the system with β = 0.1, γ = 1, µ1 = 0,
µ2 = 0.1 and α2 = 1. Initial conditions : ˙u2(0) = u1(0) = u2(0) = 0
with (a) ˙u1(0) = 2and (b) ˙u1(0) = 4.
• Figure 3: Frequency responses of the primary system for various force amplitude. (β = 0.15, γ = 1, µ1 = 0.01, µ2 = 0.3, α2 = 1).
• Figure 4: Dependence of pumping threshold in term of ˙u1(0) ( ˙u2(0) =
u1(0) = u2(0) = 0) versus the NES damping coefficient µ2. (Free
response with β = 0.1, γ = 1, µ1 = 0 and α3 = 1).
• Figure 5: Envelope of the free response of the primary system for var-ious values of the NES damping coefficient µ2. ( ˙u1(0) = 5, ˙u2(0) =
u1(0) = u2(0) = 0, β = 0.1, γ = 1, µ1 = 0, α2 = 1).
• Figure 6: Dependence of the frequency response of the primary system on the NES damping coefficient µ2: (a) µ2 = 0.1, (b) µ2 = 0.3. (β =
0.12, γ = 1, µ1 = 0.01, α2 = 1).
• Figure 7: Dependence of the frequency response of the primary system on the mass ratio γ: (a) γ = 0.7, (b) γ = 1.2. (β = 0.12, µ1 = 0.01,
µ2 = 0.1, α2 = 1).
• Figure 8: Loudspeaker structure with motor assembly, and without motor assembly.
• Figure 9: LS1 without motor assembly: (a) picture, (b) surround detail, (c) force-displacement diagram with cycle amplitude of 1 mm at various velocity, (d) force-displacement diagram at velocity of 5 mm/min for various cycle amplitudes.
• Figure 10: LS2 without motor assembly: (a) picture, (b) surround detail, (b) force-displacement diagram with cycle amplitude of 1 mm at various velocity, (d) force-displacement diagram at velocity of 5 mm/min for various cycle amplitudes.
• Figure 11: LS3 without motor assembly: (a) picture, (b) surround detail, (c) force-displacement diagram with cycle amplitude of 6 mm at various velocity, (d) force-displacement diagram at velocity of 5 mm/min for various cycle amplitudes.
• Figure 12: Sketch of experimental set-up using the LS3 without motor assembly as NES.
• Figure 13: Experimental results: Frequency response without NES and with NES for different excitation levels (mnes = 0.017kg).
• Figure 14 : Experimental results: periodic regime under sinusoidal excitation at the frequency fext = 45.75 with input voltage (a) Vext =
0.8, (b) Vext = 8V,(c) Vext = 12V,(d) Vext = 20V and (mnes = 0.017
kg).
• Figure 15: Experimental results: Dependence of the frequency response on the NES mass (mnes = 0.012kg and mnes = 0.022kg): (a) Vext= 16