HAL Id: hal-01520572
https://hal.archives-ouvertes.fr/hal-01520572
Submitted on 10 May 2017
HAL is a multi-disciplinary open access
archive for the deposit and dissemination of sci-entific research documents, whether they are pub-lished or not. The documents may come from teaching and research institutions in France or abroad, or from public or private research centers.
L’archive ouverte pluridisciplinaire HAL, est destinée au dépôt et à la diffusion de documents scientifiques de niveau recherche, publiés ou non, émanant des établissements d’enseignement et de recherche français ou étrangers, des laboratoires publics ou privés.
Robust raspberry-like metallo-dielectric nanoclusters of
critical sizes as SERS substrates.
Aurelie Le Beulze, Sergio Gomez-Graña, Hélène Gehan, Stéphane Mornet,
Serge Ravaine, Miguel A. Correa-Duarte, Luca Guerrini, Ramon A.
Alvarez-Puebla, Etienne Duguet, Etienne Pertreux, et al.
To cite this version:
Aurelie Le Beulze, Sergio Gomez-Graña, Hélène Gehan, Stéphane Mornet, Serge Ravaine, et al.. Robust raspberry-like metallo-dielectric nanoclusters of critical sizes as SERS substrates.. Nanoscale, Royal Society of Chemistry, 2017, 9 (17), pp.5725-5736. �10.1039/C7NR00969K�. �hal-01520572�
Robust raspberry-like metallo-dielectric nanoclusters of critical sizes as
SERS substrates
A. Le Beulze,a S. Gomez-Graña,a H. Gehan,a S. Mornet,a S. Ravaine,b M. Correa-Duarte,c L. Guerrini,d R. A.
Alvarez-Puebla,de E. Duguet,*a E. Pertreux,f A. Crut,f P. Maioli,f F. Vallée,f N. Del Fatti,f O. Erseng and M.
Treguer-Delapierre*a
* Corresponding authors
a CNRS, Univ. Bordeaux, ICMCB, UPR 9048, 33600 Pessac, France
E-mail: treguer@icmcb-bordeaux.cnrs.fr, duguet@icmcb-bordeaux.cnrs.fr b CNRS, Univ. Bordeaux, CRPP, UPR 8641, 33600 Pessac, France
c Departamento de Química Física, Biomedical Research Center (CINBIO), and Institute of Biomedical Research of Ourense-Pontevedra-Vigo (IBI), Universidade de Vigo, Vigo, Spain
d Universitat Rovira i Virgili. C/Marcellí Domingo s/n, 43007 Tarragona, Spain e ICREA. Passeig Lluís Companys 23, 08010 Barcelona, Spain
f FemtoNanoOptics group, Univ Lyon, Université Claude Bernard Lyon 1, CNRS, Institut Lumière Matière, F-69622 Villeurbanne, France g Institut de Physique et Chimie des Matériaux de Strasbourg (IPCMS), UMR 7504 CNRS, Université de Strasbourg, 23 rue du Loess, 67034 Strasbourg Cedex 2, France
Abstract :
Raspberry-like nano-objects made of large plasmonic satellites (>10 nm) covering a central dielectric particle have many potential applications as photonic materials, superlenses and (bio-) sensors, but their synthesis remains challenging. Herein, we show how to build stable and robust raspberry-like nano-systems with close-packed satellites, by combining monodisperse silica particles (80 or 100 nm diameter) and oppositely charged noble metal nanoparticles (Au or Ag) with well-defined sizes (10–50 nm). The spectral characteristics of their associated plasmonic resonances (wavelength, linewidth, extinction cross-section) and the electromagnetic coupling between satellites were observed using the spatial modulation spectroscopy technique and interpreted through a numerical model. The composite nano-objects exhibit numerous hot spots at satellite junctions, resulting in excellent surface-enhanced Raman scattering (SERS) performance. The SERS efficiency of the raspberry-like clusters is highly dependent on their structure.
Introduction
The development of new nano-objects to attain new properties and functionalities is a major challenge for nanoscience and nanotechnology. Hybrid nanosystems that combine components made of different types of material in a single nanostructure, e.g. dielectric–dielectric, dielectric–metal, metal–semiconductor and metal– metal, offer a wide range of new and unexplored possibilities.1–6 In the case of dielectric–metal nanosystems,
objects with a raspberry-like architecture, i.e. plasmonic satellites covering a central dielectric particle, have attracted great interest due to the large range of possible applications such as optical metamaterials,7–10
bio-devices,11 sensors,12 catalytic materials13,14 and plasmonics.3,15,16 For most of these applications, it is important not
only to manipulate the satellites’ interactions, such as tuning the inter-particle separation, but also to get robust building units. Different synthetic strategies have been already proposed to design robust raspberry-like nanoarchitectures, including seed-mediated growth or self-assembly of pre-formed colloidal particles.8–10,15–20
Metallic nanoparticle adhesion onto the surface of the dielectric spherical core can be driven by a variety of forces such as electrostatic interactions,8,15,18,19 covalent bonding16,17,20 and bio-mediated attraction.9,21 In most reports,
the self-assembly methods were efficient for a certain range of particle sizes, specifically for a core/satellite diameter ratio close to or above 10. However, it remains a challenge to obtain and to irreversibly assemble in solution large plasmonic particles (>10 nm) onto relatively small dielectric core (i.e., with a core/satellite ratio of 5) while still preserving a high yield. The excessive weight of the large satellites systematically causes mechanical
instabilities in the raspberry-like architecture (i.e. satellite rearrangement events). Such composite colloidal nanostructures are of particular interest as building blocks for isotropic optical metamaterials and as efficient substrates in sensing applications.22–24 Plasmonic interactions between satellites induce an exaltation in the local
fields when molecules are located on the metallic surfaces. This outstanding Raman scattering enhancement makes these materials very promising SERS substrates for the development of ultrasensitive nanoscale sensors.25
With this motivation in mind, we studied and determined the conditions that enable the assembly of large plasmonic spheres (Agn and Aun, with diameters >10 nm) onto monodisperse dielectric silica spheres (∼100 nm) to
yield bulk quantities of uniform raspberry-like SiO2@Mn nanostructures. We took advantage of two types of
electrostatic attractions to drive the assembly of core and satellites particles. In the first strategy, the negatively charged metallic nanoparticles are bound to a SiO2 core surface functionalized with an organosilane
(N-[3-(trimethoxysilyl)-propyl]ethylenediamine (EDPS)). In the second assembly strategy, SiO2 cores are alternatively
wrapped within different layers of polyelectrolytes (poly(diallyldimethyl-ammonium chloride) (PDDA) and poly(sodium 4-styrenesulfonate) (PSS)) to promote the formation of an external PDDA shell with a compact collection of positive charges to anchor the negatively charged metallic particles. The strengths and weaknesses of both types of binding are discussed. The optical characteristics of the most robust SiO2@Mn colloidal particles were
investigated and compared with the results of a numerical model. They show unusually high SERS signals, which can be explained by the generation of hot spots in the nanoclusters.
Experimental section
Materials
Silver nitrate (AgNO3, 99.999%), sodium hydrosulfide (NaHS), potassium gold(III) chloride (KAuCl4, 99.99%), tetraethyl orthosilicate (TEOS; ≥90%), L-arginine (≥98%), L-ascorbic acid (AA, 99%), sodium citrate dihydrate (≥99%), glycerol (≥86%), acetic acid (99.8%), cyclohexane (>99.7%), N-[3-(trimethoxysilyl)propyl]ethylenediamine (EDPS; 97%), poly-(vinylpyrrolidone) (PVP; Mw ∼ 55 000), poly(diallyldimethylammonium chloride) (PDDA; Mw ∼ 200–350
000; 20 wt%), poly(sodium 4-styrenesulfonate) (PSS; Mw ∼ 70 000; 30 wt%), phosphate buffered saline pH7.4 (PBS), were purchased from Sigma-Aldrich. Ethylene glycol (EG, 99%), ammonium hydroxide (NH4OH, 28–30 wt%) were obtained from J. T. Baker. Absolute ethanol was purchased from Atlantic Labo.
Synthesis of negatively-charged silver nanospheres
Silver nanospheres were prepared according to an optimized version of the protocol by Xia and coworkers.26,27 In
two different vials, 16.9 mg of sodium hydrosulfide were dissolved in 10 mL of EG and 450 mg of PVP in 15 mL of EG. Both solutions were aged for 4 h under magnetic stirring. One hour and a half later, 60 mL of EG was introduced via a three-necked round bottomed flask equipped with a reflux condenser and the temperature was increased to 150 °C for 2 h 30 min. An Argon flux was introduced for the last 30 minutes in order to create an inert atmosphere. 35 μL of the NaHS solution and 15 mL of the PVP solution were introduced just before the quick addition of 5 mL of EG solution containing 120 mg of silver nitrate. After 9 min, the reaction was quenched by placing the round bottomed-beaker in an ice-bath and adding 50 mL of cold absolute ethanol. Finally, the silver nanoparticle dispersion was concentrated to ∼10 mL by using a Millipore stirred ultrafiltration cell with a regenerated cellulose membrane (100 kDa). Then the nanoparticles were washed 5 times via ultrafiltration cycles with a solution of PVP (3 g L−1) in absolute ethanol. Afterwards, the nanoparticles were transferred to water repeating 5 times the washing
step with ultrapure water. The final concentration of nanoparticles was 8 × 10¹⁶ L−1, as determined by Inductively
Coupled Plasma Optical Emission Spectrometry (ICP-OES).
Synthesis of negatively-charged gold nanospheres
Batches of gold nanoparticles of different diameters were prepared via a seeded-growth approach in an aqueous medium.28 10 nm seeds were firstly synthesized through the conventional Turkevitch's method.29 In a two-necked round bottomed flask equipped with a reflux condenser, 50 mL of aqueous potassium gold(III) chloride solution (0.83 mM) was added to 700 mL of ultrapure boiling water. After temperature stabilization, 75 mL of aqueous sodium citrate solution (5.2 mM) was quickly added while vigorously agitating. The solution turned progressively
from yellow to deep red and was aged for 20 min. The concentration of the gold nanoparticles in the dispersion was 1.9 × 10¹⁶ L−1, resulting in the full reduction of the gold salt to isotropic and monodisperse nanoparticles. Larger gold nanoparticles were obtained according to the following procedure:28 A certain amount of the 10 nm gold seed dispersion was diluted with 20 mL of deionized water in a three-necked flask. Then 10 mL of solution A containing KAuCl4 and 10 mL of the reducing solution B containing trisodium citrate and AA, were added simultaneously but separately to the medium at room temperature via two syringe pumps, while continuously stirring over 45 min. As soon as the addition was complete, the mixture was heated to 90 °C and maintained at this temperature for 1 h while stirring. Finally, the solution was cooled. The solution A was prepared by diluting a KAuCl4 stock solution (5.29 mM) to 10 mL. Solution B was prepared by diluting a mixture of an AA stock solution (56.8 mM) and a trisodium citrate stock-solution (34 mM) to 10 mL. Note that the relative volume ratios (Au : AA : citrate) of all three stock solutions were maintained for each growth (8 : 2 : 1). For example, 20 nm gold nanoparticles using the 10 nm gold seeds were synthesized by mixing 2 mL of 10 nm gold seeds ([AuNP10] = 2 × 10¹⁵ L−1), 18 mL of deionized water, 10 mL of a solution A obtained from 2.71 mL of the KAuCl4 stock solution, i.e. 14.3 μmol of Au3+ ions, and 10 mL of a solution B made of 677 μL of the AA stock solution and 339 μL of the trisodium citrate stock solution to 10 mL of deionized water. The physico-chemical features of the as-prepared batches of gold nanoparticles with diameters of 10, 20, 30, 40 and 50 nm are summarized in Table S1.† The concentration of gold nanoparticles was estimated by assuming that no secondary nucleation occurred.
Synthesis of silica spherical nanoparticles
Well-calibrated silica spheres were obtained according to a seeded-growth protocol previously reported.30,31
Synthesis of silica seeds. 345 mL of an aqueous solution of L-arginine (7.5 mM) and 22.5 mL of cyclohexane were introduced to a 500 mL round bottomed beaker equipped with a magnetic stirrer and the resulting biphasic liquid was heated to 60 °C. Then, 37.5 mL of TEOS were added to the top organic phase. The stirring speed was tuned in order to create an interface of constant area between both phases and was maintained during 24 h. Lastly, the cyclohexane was removed using rotary evaporation at 50 °C under partial vacuum. TEM showed a mean particle diameter of 28 ± 4 nm (TEM image not shown here). The concentration of silica seeds was determined by dry extract and found to be 3.5 × 10¹⁷ L−1.
Regrowth of silica nanoparticles of controlled diameter. 50 mL of ethanol, 5 mL of NH4OH (1 M), and 5 mL of the
aqueous suspension of silica seeds were mixed inside a 150 mL round-beaker. A pre-determined volume of TEOS diluted in 20 mL of absolute ethanol was added at a rate of 1 mL h−1 by an automatic syringe pump. This volume
was calculated as a function of the targeted final diameter according to the following equation:
where MTEOS = 208 g mol−1, ρTEOS = 0.83 g cm−3, MSiO2 = 60 g mol−1 and ρSiO2 = 2.20 g cm−3. Targeting silica nanoparticles
with diameters of 80 and 100 nm, 4.13 and 8.25 mL of TEOS were employed and final diameters of 89 ± 2 and 106 ± 3 nm were estimated using TEM, respectively. The final concentrations of silica particles were determined by the dry extract method and found to be 2.4 × 10¹⁶ and 3.1 × 10¹⁶ particles per L, respectively.
EDPS Surface functionalization of silica nanospheres
Under vigorous stirring, a pre-determined volume of EDPS, corresponding to an excess of 20 compared to the amount necessary for the full coverage of the silica particles, was quickly added to 20 mL of the suspension of the as-prepared silica nanoparticles and left to react at room temperature overnight. This volume was calculated according to the following equation:
where dEDPS = 4.9 μmol m−2, MEDPS = 222.36 g mol−1 and ρEDPS = 1.028 g cm−3.
A maturation stage was performed, which consisted of transferring the reacting medium to a 100 mL round bottomed beaker, adding 10 mL of glycerol, extracting successively the ethanol and water on a rotary evaporator at 40 °C and 70 °C, respectively, and dehydrating at 100 °C for 3 h under partial vacuum. After cooling, 70 mL of ethanol was added under mild stirring. The mixture was centrifuged at 15 000g for 20 min at 20 °C. The supernatant, containing glycerol, ethanol and EDPS oligomers was removed and the pellet was redispersed in ethanol by sonicating. This centrifugation/redispersion cycle was repeated 6 times. Then, 100 mL of water was added. To promote the redispersion of the modified silica beads and maintain the adhesion of the polysiloxane film on the nanoparticles surface, an acidification was performed by adding dropwise 1 M acetic acid, under vigorous stirring up to a constant pH value of 5. Finally, the residual ethanol was removed on the rotary evaporator at 40 °C. The suspension was redispersed in 100 mL of water and the concentration of the modified silica beads was determined by dry extract and found to be 2.2 × 10¹⁶ L−1.
Layer-by-layer (LbL) adsorption on silica nanospheres
The LbL technique was applied according to a previously reported protocol.32 Firstly, the silica nanoparticles were
washed 3 times by centrifugation at 9000g for 10 min, the pellet was redispersed in ultrapure water and in the last washing step a solution of PBS (0.01 M, pH 7.4) was used to redisperse the silica nanoparticles. Solutions of PDDA (2 mg mL−1) and PSS (3 mg mL−1) were prepared in PBS (0.01 M). 10 mL of the silica nanoparticle dispersion was
added to 20 mL of the PDDA solution. The adsorption was allowed to proceed for 30 min under stirring with a roller mixer. The excess of PDDA was then eliminated by centrifugation at 6000g for 10 min and the particles were redispersed in 10 mL of PBS. After three washing cycles, the colloidal suspension was injected into 20 mL of PSS solution. The adsorption procedure was similar to the one used for the PDDA layer. Excess PSS was eliminated by centrifugation at 6000g for 10 min and the particles were redispersed into 10 mL of PBS. After three washing cycles, the colloidal suspension was added to 20 mL of PDDA solution. The last layer of PDDA was assembled on the silica particles and the last washing cycle was performed in water. The final concentration of silica particles was determined by dry extraction and found to be 1.25 × 10¹⁶ L−1.
Synthesis of raspberry-like nanoclusters
Typically, in an Eppendorf tube of 2 mL, 1 mL of a nanoparticles suspension (5.0 × 10¹⁶ L−1) was added dropwise to
a dilute suspension of either EDPS-modified silica beads (5.16 × 10¹⁴ L−1) or polyelectrolyte-modified silica beads
(1.5 × 10¹⁴ L−1). The mixture was stirred overnight at room temperature and protected from light exposure. Excess
metallic nanoparticles were eliminated through centrifugation at 1500g for 15 min. The nanoclusters were redispersed in 0.5 mL of water (final clusters concentration ca. 6 × 10¹³ L−1). A thin silica shell was formed by adding
4.94 mL of ethanol, 60 μL of ammonium hydroxide and 2 μL of TEOS to the solution. The reaction was kept overnight and then centrifuged to remove the excess of free silica nuclei. The silica coated raspberry-like nanoclusters were redispersed in water.
Characterization techniques and optical experiments
Microscopy characterization. Transmission Electron Microscopy (TEM) was performed using a Philips CM20
microscope operating at 75 kV and on a Hitachi H7650 microscope operating at 80 kV. High-resolution TEM (HR-TEM) experiments were performed with a JEOL 2200FS and a JEOL 2100F microscope operating at 200 kV. Samples were prepared by depositing one drop of each colloidal dispersion on a carbon-coated copper grid. High-resolution
scanning electron microscopy (HR-SEM) was performed on a JSM 6700F microscope. A drop of the colloidal dispersion was deposited on a dried silicon wafer and left to evaporate.
Elemental analysis and surface characterization. Inductively Coupled Plasma Optical Emission Spectrometry
(ICP-OES) was used to determine the metal nanoparticle concentration, and performed on a Varian 720-ES spectrometer. Samples were prepared in plastic Falcon tubes, where a known volume of colloidal dispersions (>0.5 mg L−1) was attacked by aqua regia. All experiments were repeated 5 times. ζ-Potential measurements were
performed on a Zetasizer 3000HS from Malvern Instruments. The exploitation device PCS v1.41 from Malvern was used to calculate the ζ-potential from the measured electrophoretic mobility (με in μm s−1/V cm−1) through the
following relationship: ζ = 12.8με. The samples were prepared as follows: a volume of 80 mL of particle dispersion
(pH ≈ 7) was divided into two beakers. In the first beaker, a few drops of NaOH 1 M (Sigma-Aldrich) were added to reach high pH values and samples of 8 mL were collected every 0.7 unity of pH variation. In the second beaker, the same protocol was performed to prepare acidic samples by adding a few drops of HNO3 1 M (Sharlau). The samples
were injected into the zetameter at least 1 h after sample preparation to ensure pH stabilization. Finally, the pH of each sample was once again measured after analysis.
Optical characterization of colloidal solutions. The absorption spectra were recorded in the range of 300–1300 nm
with a UV-3600 Shimadzu UV-Vis-NIR spectrophotometer by using a 1 cm optical path length plastic or quartz cells. Diffuse reflectance infrared Fourier transform (DRIFT) spectroscopy was performed on a Bruker IFS Equinox 55 spectrometer equipped with a Selector Grase reflection cell by Specac.
Single nano-object optical spectroscopy. The extinction cross-sections of individual raspberry-like clusters were
quantitatively measured using spatial modulation spectroscopy (SMS).33,34 This technique is based on the periodic
displacement of a nano-object in the focal spot of a tightly focused light beam, which induces a modulation of the transmitted light power proportional to the extinction cross-section. To perform investigations on single clusters, colloidal solutions were spin-coated with a <1 μm−2 nano-object density on TEM grids with 50 × 50 μm2 windows
covered by a thin silica membrane, permitting their optical separation and TEM observation. The tunable source required for extinction measurements over a broad spectral range was provided by the association of a Ti:Sapphire oscillator with an optical parametric oscillator working in the visible and a BBO crystal performing frequency doubling, enabling light generation ranging from the visible to the near-infrared. Beam focusing close to the diffraction limit was achieved by a microscope objective (0.75 numerical aperture NA). Samples position was modulated at a frequency f ≈ 1.5 kHz and the transmitted light power detected by a photodiode, its 2f component being extracted by a lock-in amplifier. Light polarization was controlled using the combination of a quarter-wave plate and a polarizer.
SERS analysis. Experiments were performed on a micro-Renishaw InVia Reflex system equipped with a
macro-sampler accessory using 532 nm and 633 nm excitation laser lines. The spectrograph uses high-resolution gratings (2400 or 1200 grooves per cm for the visible or NIR, respectively) with additional band-pass filter optics, a confocal microscope and a 2D-CCD camera. The laser was focused on the sample solution by a long-working distance objective (0.5 NA, 30 mm working distance). For SERS studies, 10 μL of a 0.1 mM ethanolic solution of thiophenol (TP) was added to 1 mL of the colloidal dispersion. The samples were gently shaken for 30 min before the acquisition of the SERS spectra. Samples were studied by illumination with the three different laser lines during 10 s with power impinging the sample of 46, 16 and 300 mW for the green, red and infrared lines, respectively.
Results and discussion
Synthesis of building-block particles
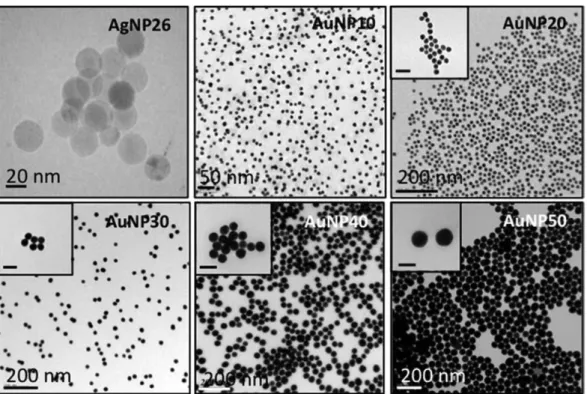
Spherical silver colloidal nanoparticles (AgNP26) with narrow size distribution were synthesized following the polyol based synthetic procedure described by Massé and coworkers.27 UV-visible absorption spectroscopy and TEM images (Fig. 1 and optical properties section) show high size-monodispersity and a mean nanoparticle diameter of 26 ± 5 nm. ζ-Potential measurements show that the nanoparticle surface is negatively charged with ζ values from −30 mV to −50 mV in the pH range of 4 to 8.
Gold nanoparticles of various diameters were prepared via a seeded growth approach adapted from the protocol by Ziegler et al.28 10 nm seeds were first produced through the conventional Turkevitch's method,29 which consists
of chloroauric acid gold precursor reduction by sodium citrate, which also serves as a stabilizing agent. The as-prepared gold nanoparticles are spherical in shape with a mean diameter of 10 ± 1 nm and a plasmon band centered around 520 nm, characteristic of their dipolar surface plasmon resonance (Fig. 1 and optical properties section). Four extra batches (AuNP20, AuNP30, AuNP40, AuNP50) with increasing gold nanoparticle size were obtained by using smaller particles as seeds, ascorbic acid as a mild reducing agent and citrate ions as the stabilizing agents.28
Synthesis, experimental conditions and physico-chemical features of the prepared gold nanoparticles are summarized in Table S1.† TEM analysis reveals that the particles are spherical and low faceted (Fig. 1), while the presence of adsorbed citrate and ascorbate ions on the surface on the gold surface is well-known to induce an overall negatively charge to the nanoparticles.
Well-calibrated silica particles (PDI < 1.005) were synthetized according to a recently optimized protocol30 that
consists of two steps: (i) the synthesis of silica seeds via Hartlen's technique29 and (ii) a seeded-growth through a
modified Stöber's process. First, tiny silica nanoparticles were synthesized through the hydrolysis and condensation of TEOS in a biphasic water/cyclohexane medium within the presence of L-arginine as a basic catalyst and buffer. These seeds appeared relatively spherical with a mean diameter of 28 ± 4 nm. The subsequent seeded-growth step was performed in a hydro-alcoholic medium and catalyzed by ammonia to yield different batches of larger particles with diameters of 89 ± 2 nm and 106 ± 3 nm (Fig. 2). ζ-Potential measurements report negative values for pH higher than 3 because of the isoelectric point (IEP) of the silica nanoparticles that occurs at pH 2.5 (Fig. 2a). After the synthesis of the different building units, we proceeded to their assembly by exploring two different methods for the electrostatic adhesion of the negatively charged Ag and Au NPs onto the silica-core particles. In the first strategy, silica surfaces were chemically modified with N-[3-(trimethoxysilyl)-propyl]ethylenediamine (EDPS) to promote the attachment of the satellites whereas in the second approach a densely positively charged polymeric shell was deposited onto the dielectric core via the LbL technique. We will refer to the corresponding raspberry-like assemblies as the “first generation” and “second generation” clusters, respectively.
One of the most common approaches to covalently modify the surface of silica particles in an aqueous medium relies on the use of functional alkoxysilane molecules (RO)3Si–(CH2)3–X where X is a reactive group. Because of the
few layers of co-condensation onto the silica surface, functional alkoxysilanes lead to the formation of a polysiloxane film exhibiting a rather high surface density of X. The reactive group X was selected among amino derivatives in order to have positively charged functionalities at neutral pH. More specifically, we chose ethylenediamine as X to simultaneously have primary and secondary amine groups on the silica surface. Importantly, amino groups are also known to have a good affinity for both gold and silver surfaces.16 The grafting
stage was performed immediately at the end of silica bead growth in the Stöber medium using EDPS in large excess.32 This step was followed by a dehydration stage for completing the polysiloxane film formation.35 No change
in size was observed by TEM. The comparison of infrared spectra (DRIFT) before and after EDPS functionalization shows the appearance of characteristic bands such as νasym(CHx) at 2983 cm−1 and ν(NCHx) at 2950 cm−1 (see the ESI,
Fig. S1 and Table S2†). As expected, the EDPS grafting on the silica nanoparticles modifies their physicochemical properties, inducing a marked increase of the ζ-potential up to 50 mV at pH 7 and a drastic shift of the IEP from pH 2.5 to pH 8.1 (Fig. 2a and b). Initial assembly experiments were performed using 89 nm EDPS-modified silica nanoparticle and 26 nm silver particle building units.
Preliminary calculations were performed to determine the maximum number of 26 nm silver nanospheres that can be grafted onto a silica core. Using a numerical code based on mathematical investigation of the sphere packing problem36 the maximum number of satellites is found to be 64 for 89 nm diameter silica core and 85 for 106 nm
cores. These numbers should however be seen as upper bounds as repulsive electrostatic forces prevent negatively charged satellites to sit in close contact with each other.
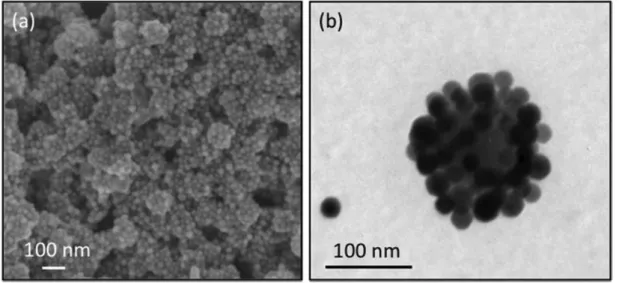
A preliminary series of cluster synthesis was performed by changing the ratio between the numbers of silver and silica nanoparticles (Fig. 3a). We observed that, for ratios lower than 40, a flocculation phenomenon occurs which may be ascribed to the simultaneous interaction of silver nanoparticles with several silica spheres leading, eventually, to the formation of multi-core clusters. Thus, the excess of silver nanoparticles was increased above this critical threshold, providing stable dispersions. The assembled clusters were characterized by TEM, before (Fig. 3b) and after PVP adsorption and dispersion/centrifugation washing cycles (Fig. 3c). TEM images show the effective
attraction between the silica particles and a large number of silver nanoparticles after the assembly step. Importantly, the centrifugation steps removed unbound silver particles, but also decreased the overall satellite surface density. Nonetheless, the arrangement of the remaining silver particles reveals a daisy-like disposition on the silica surface (Fig. 3c). This observation suggests the occurrence of a satellite rearrangement of the AgNPs under the constraint of capillary forces during TEM grid preparation, as previously observed in similar conditions.37 To rule
out a spontaneous daisy-like arrangement of the silver nanoparticles on the silica core during the drying process, we performed a control experiment by mixing silver colloids and pristine silica particles (both having negatively charged surfaces). No specific arrangement was observed. This clearly indicates that the organization of the building units into the raspberry-like geometry is selectively driven by electrostatic interactions via the controlled tuning of the surface chemical properties.
After the washing cycles, stabilization was achieved by encapsulating the nano-assemblies inside a 10 nm silica shell via the conventional Stöber method. The silica encapsulation step locks the relatively homogeneous satellite distribution around the silica core, as shown in representative TEM images (Fig. 3d and e). However, it is worth noting the presence of very small silver nanoparticles of a few nanometers in size within the silica layer. Their formation is likely the result of the aerial oxidation of the initial silver particles driven by the ammonia used as a catalyst for the silica growth.
Several unsuccessful efforts were performed to improve the surface density of the satellites in the outer shell of the assemblies by changing a large set of experimental conditions (pH, stirring speed, core-to-satellites addition rate, etc.). For these reasons, we explored alternative routes to obtain more robust and uniform raspberry-like structures with a larger number of plasmonic satellites per cluster, by improving the electrostatic adhesion between the different building blocks. To this end, EDPS surface functionalization was replaced by deposition of layers of polyelectrolytes of opposite charge via a LbL assembly technique.
Second generation raspberry-like nanoclusters based on polyelectrolyte-modified silica cores
In this second approach, silica cores were first wrapped with positively-charged polydiallyldimethyl-ammonium chloride (PDDA) followed by the negatively-charged poly(sodium 4-styrenesulfonate) (PSS) and, finally, with a further layer of PDDA polycation to yield a compact external shell of highly dense positive charges.15,38 Increasing
the surface positive charge of the core is of pivotal importance to improve the adhesion of the metallic satellites. Moreover, the use of such long and flexible macromolecules is also expected to extend the contact area between satellites and core by the soft brush effect determined by the multilayer polymeric deposition.
The polyelectrolyte adsorption was performed on both 89 nm and 106 nm silica particles in PBS. TEM images show that, after the polyelectrolyte adsorption, silica particles retained their shape with no aggregation. The polymeric coating is regular with a thickness of about 3 nm, in agreement with previously reported values39,40 (see the ESI, Fig.
S2a–c†). More importantly for our purpose, the ζ-potential values measured at pH 8 before and after each deposition step are −55.6 mV (for bare SiO2 particles), +38.0 mV (for SiO2@PDDA), −46.3 mV (for SiO2@PDDA@PSS)
and finally +50.4 mV (for SiO2@PDDA@PSS@PDDA) (see the ESI, Fig. S2†). The IEP shifted from pH 2.5 to pH 10.5,
i.e. two pH units higher than for EDPS-modified silica particles (Fig. 2c).
Firstly, 26 nm silver nanoparticles were assembled onto the silica cores to generate the corresponding SiO2@AgNP26 clusters. The individual building units were mixed in aqueous solutions carefully adjusted to pH 6 in
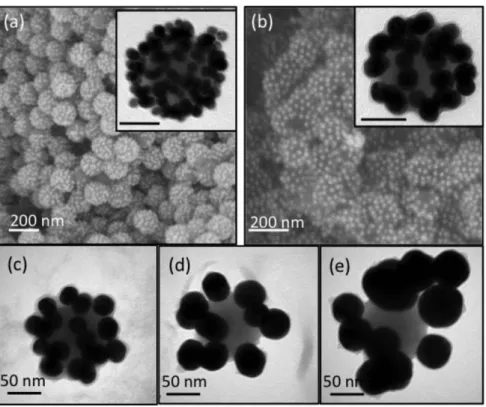
order to maximize both the density of the positive charges onto silica and negative charges on silver nanoparticles. A large excess of silver satellites was used to guarantee the maximum surface coverage. Specifically, the particles were mixed in a 150 : 1 and 170 : 1 satellite-to-core ratio in the case of 89 nm and 106 nm silica particles, respectively. Fig. 4 shows representative TEM images of the so-formed clusters, displaying a well-defined raspberry-like morphology with a close packing of satellites whose density is higher than that observed for EDPS-modified silica particles.
From these TEM images, we estimated the average satellites-to-core number ratio to be equal to ∼25 and ∼60 for 89 nm and 106 nm silica particles, respectively (i.e. coverage yield of ∼40% and ∼70%, respectively). Additionally, in the case of the second generation clusters no falling-in of the silver particles is observed upon silica-coating and/or their deposition on a TEM grid does not lead to a rearrangement of the satellites around the dielectric core.
These results clearly indicate that the LbL method generates more stable clusters. The UV-vis absorption spectra of the silver colloids and their corresponding clusters are displayed in Fig. 5. When assembled onto the silica core, the plasmonic interactions between satellites generate a new red-shifted contribution in the extinction spectra centered at ca. 490 nm (Fig. 5b). No significant increase of infrared absorbance is observed in the spectrum, which reflects the absence of agglomerates in the colloidal suspension. The peak at 405 nm is caused by silver nanospheres that do not cover the dielectric sphere but remain in the solution because of the excess of Agn nanospheres in the
fabrication process.
Removal of the excess of unbound Agn nanoparticles could be performed after depositing another layer of PDDA
around the nanoclusters in order to provide them with sufficient stability and to avoid the unwanted formation of aggregates during the centrifugation/re-dispersion cycles. Adding more silver particle layers yields a red-shift in the plasmon resonance band of the SiO2@Agn nanoclusters (Fig. 5c). The red-shift is about 10 nm per Agn layer added.
The shift is due to the electromagnetic coupling between neighboring silver nanoparticles inside and in between the layers.
Extension to raspberry-like gold/silica nanoclusters
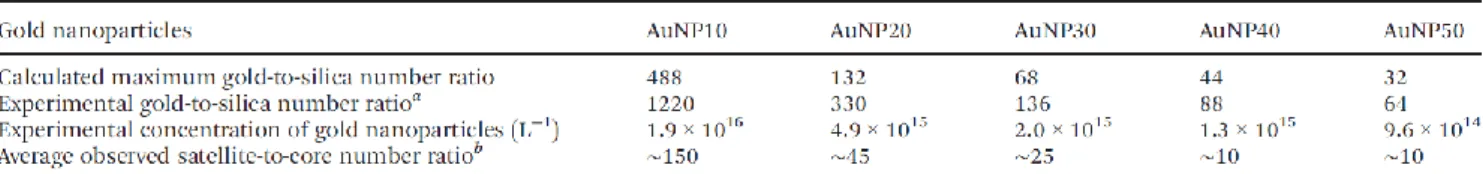
LbL-based fabrication of raspberry-like clusters was also extended to citrate-capped gold colloids as satellites. Gold nanoparticles were first washed to remove excess citrate and ascorbate ions, then mixed in large excess with polyelectrolyte-coated 106 nm silica beads dispersion. The final concentration of the silica core was kept fixed at ∼7.7 × 10¹² L−1 (which can be considered to a first approximation to be equal to the final concentration of clusters).
Fig. 6 illustrates representative images of clusters with gold nanoparticles of different sizes. SiO2@AuNP10,
SiO2@AuNP20 and SiO2@AuNP30 assemblies show good size uniformity (Fig. 6a–c) and defined geometry, with an
average satellite-to-core value of ∼150, ∼45 and ∼25 respectively. This value drops further to ∼10 for both 40 nm and 50 nm AuNPs. It is worth noting that the TEM-determined numbers of satellites are significantly lower than those calculated from geometrical models for monolayer coatings (Table 1). Moreover, when the satellite diameter is enlarged above 40 nm, a clear satellite rearrangement phenomenon is observed (Fig. 6d and e, for SiO2@AuNP40
and SiO2@AuNP50, respectively).
Thus, we conclude that the diameter ratio between the satellites (both Ag and Au) and the silica central sphere plays a key role in determining the architecture and robustness of the cluster. In particular, when this ratio becomes too large, the coating efficiency drops and the excessive weight of the satellite causes systematical mechanical instabilities of the clusters (i.e. rearrangement events). Regardless, the experimental results demonstrate that the fabrication of raspberry-like structures with the LbL-based method provides clusters with higher stability and satellite-surface coverage. The main limitation of this approach is that the satellites are randomly distributed on the surface of the dielectric core, generating a distribution in the intersatellites gaps.
Optical properties of raspberry-like nanoclusters
Fig. 7 presents the absorbance spectra of the solutions of gold colloids with diameters ranging from 10 to 50 nm and of the raspberry-like clusters fabricated with them. The absorbance of gold nanoparticles (Fig. 7a) presents a peak near 520 nm related to their dipolar surface plasmon resonance, slightly red-shifting with increasing diameter as previously observed.41 The broadest resonance is observed for 10 nm particles diameters, due to the effect of
quantum confinement which induces a broadening inversely proportional to nanoparticle size.42,43
The set of spectra for raspberry-like clusters show very different absorption profiles (Fig. 7b), involving a large absorption in the red part of the spectrum and, in some cases, multiple resonances. Their interpretation is, however, difficult due to the spectral overlap of the contributions from clusters, residual spheres, and aggregates. The presence of aggregates in some of the solutions, such as in SiO2@AuNP30, is suggested by the large signal
measured at high wavelengths.
Interpretation issues can be avoided by performing spectroscopic measurements at the single-cluster level, using spatial modulation spectroscopy (SMS). This technique relies upon modulating the position of a nano-object inside the focal spot of a tightly focused light beam, which results in periodical variations of the transmitted light power.33
dispersion in cluster morphological properties (e.g., number and spatial distribution of satellites), obtaining quantitative extinction spectra of single clusters and correlating them on a one-to-one basis with their morphology determined through electron microscopy.34,44–46 The measurements were performed on the second generation
clusters as they are the most robust.
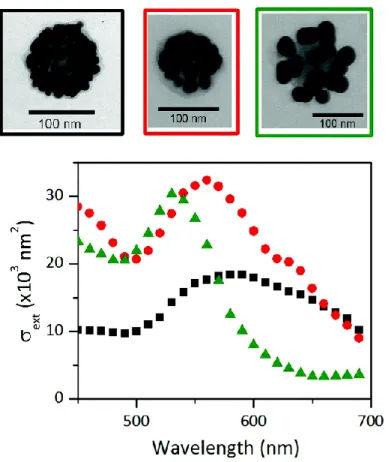
The extinction spectra measured on three individual SiO2@AuNP10, SiO2@AuNP20 and SiO2@AuNP30 clusters,
deposited on a thin silica substrate are presented in Fig. 8 (similar spectra were obtained on different single nanoclusters). These spectra, obtained with linearly polarized illumination, are weakly sensitive to a rotation of the polarization direction, in agreement with the isotropic properties expected for a large number of satellites. The two former spectra display a profile similar to that of the ensemble of measurements (Fig. 7b). However, a decrease in the resonance width was observed. Ensemble measurements often have broader resonance widths due to an inhomogeneous broadening contribution.42 Conversely, the spectrum measured on the SiO
2@AuNP30 cluster
strongly differs from the ensemble measurement as it does not show a large tail in the red domain, reinforcing the hypothesis that this feature is induced by a partial aggregation in the initial solution.
Single-cluster measurements show that electromagnetic coupling effects do play a larger role for clusters with smaller satellite sizes, which display red-shifted (resonance positions being 530, 560 and 590 nm for 30, 20 and 10 nm gold nanoparticle diameters, respectively) and significantly broadened resonances. This effect, however, partly results from quantum confinement-induced SPR broadening for small nanoparticles.42 It is difficult to quantify due
to the asymmetric resonance shapes induced by the overlap of the continuum of interband transitions. The larger amplitude of coupling effects for small satellites can be correlated with a smaller ratio between the size of the gap between adjacent satellites and their diameter Dsat. The amplitude of electromagnetic coupling effects47 is
significant only when /Dsat < 1. Deduction of /Dsat from statistics on 2D TEM images (Table 1, also see the images
of optically measured clusters in Fig. 8) yields /Dsat ≈ 1 for SiO2@AuNP30 clusters and /Dsat ≈ 0.5 for SiO2@AuNP10
and SiO2@AuNP20, respectively explaining the similarity and large modification of their extinction spectra as
compared to those of isolated gold nanospheres.
Finite-element simulations were performed to quantify the effects of inter-satellite electromagnetic coupling on the optical response of raspberry-like clusters. These simulations considered model clusters with N = 1, 6, 12 and 20 gold satellites with a 50 nm diameter, regularly disposed on a 100 nm diameter silica core (Fig. 9). Johnson and Christy's data48 were used for the gold dielectric function, while a uniform refractive index of 1.3 was used for the
cluster environment, as this value typically leads to a good reproduction of resonance positions of chemically synthesized nano-objects deposited on silica substrates.44
These simulations do confirm that the main effects of increasing the satellite density are a red-shift and broadening of the surface plasmon resonances (Fig. 9). They also demonstrate that coupling effects drastically depend on the satellite density. For instance, the extinction spectrum of a satellite in a N = 6 cluster (corresponding to /Dsat = 1.1)
remains close to the one predicted in the absence of inter-satellite interactions (N = 1), in agreement with measurements on SiO2@AuNP30 clusters. Conversely, large variations are obtained for clusters with 12 satellites
(for which /Dsat = 0.6). This shows that small variations of inter-satellite spacing within the range corresponding to
the nano-objects described in the present work ( /Dsat = 0.5–1) can induce a large modification in the optical
response of the cluster. The appearance of multiple resonances in the spectrum is predicted for N = 20, which corresponds to satellites in quasi-contact ( /Dsat = 0.1), a regime not explored in our experiments involving larger
average /Dsat values. Note that a more detailed comparison of measured spectra with simulations is difficult, as it
would require taking into account the non-uniform satellite distribution around the silica core, as well as the deviation of their shape from a perfectly spherical one.
SERS evaluation of raspberry-like nanoclusters
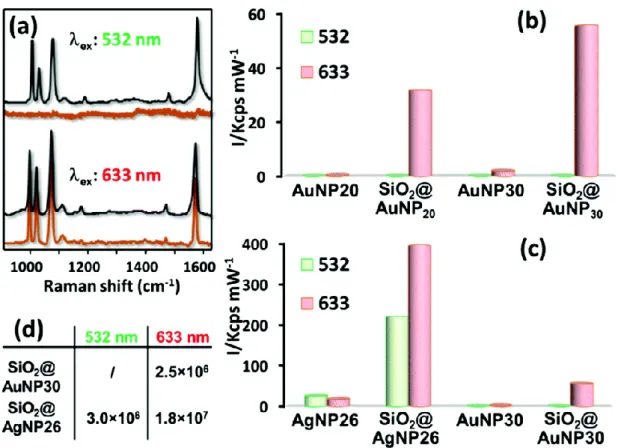
The SERS efficiency of the most robust raspberry-like clusters was tested in suspension using thiophenol (TP) as a Raman probe (final concentration = 1 mM). TP is well-known to firmly bind both silver and gold surfaces via the formation of a strong sulfur bond, providing intense SERS spectra with no resonant contributions under the investigated excitation wavelengths.49 The results were compared with those observed with the corresponding
monodispersed colloids. Fig. 10a illustrates representative SERS spectra of TP in the 900–1650 cm−1 spectral range
and 1022 cm−1 appear, both assigned to in-plane ring breathing vibrations; at ∼1074 cm−1, ascribed to an in-plane
ring breathing mode coupled with ν(C−S); and at ∼1574 cm−1.50,51 For a quantitative comparison of the different
SERS activities, the peak height of the TP band at ∼999 cm−1 was plotted in Fig. 10b and c for all investigated
excitation wavelengths. The SERS intensities were normalized to 1 mW laser power at the sample and 1 s exposure time. As can be clearly observed, the SERS efficiency of the isolated metal nanoparticle colloids dramatically increases when they self-assemble on the silica cores, as a result of the hot spot formation at the satellite junctions. In fact, although significant electromagnetic enhancements can be generated from isolated spherical nanostructures, the plasmonic coupling of highly interacting nanoparticles yields very large electromagnetic fields in the interparticle gaps that can exceed by many orders of magnitude those of individual metallic units.51
The experimental data indicate a dependence of the final SERS activity on the specific raspberry-like cluster structure. Specifically, Fig. 10b shows how the SERS intensity is consistently larger for the raspberry clusters formed with the larger particles. Although, a priori, this result is surprising since an increase in satellite size corresponds a decrease in the number of hot spots per silica core (i.e. a smaller number of plasmonic nanoparticles can be loaded onto a single clusters, see Table 1),52 these results are in good agreement with those obtained for gold nanoparticle
supercrystals53 and polystyrene microbeads coated with Au and AgNPs of different size.54 They are also in
agreement with the fact that larger satellites support more red-shifted plasmonic resonances with higher resonance quality.51
However, in the context of the present study, the higher SERS efficiency measured in solutions of SiO2@AuNP30
clusters may also be partly induced by the inter-cluster interactions suggested by the comparison of ensemble and single-cluster optical measurements. Indeed, as discussed above, only the former display the large extinction in the red domain characteristic of plasmonic interaction effects. Conversely, the high SERS efficiency of SiO2@AuNP20
clusters is expected to be a consequence of intrinsic effects, i.e. electromagnetic field enhancements at the single particle level, as confirmed by the similarity of ensemble and individual extinction spectra for these sizes.
As expected, the use of different metallic materials (Ag vs. Au) also drastically affects the SERS efficiency, as is emphasized in Fig. 10c where the signal intensities obtained for silver and gold raspberries of similar size are compared. No distinguishable SERS signals were registered for TP adsorbed onto both gold colloids and nanoclusters upon excitation with the green laser. Moreover, silver provides a considerably larger SERS enhancement due to its improved optical efficiency.55 These results are fully consistent with the ability of silver to
be efficiently excited across the entire spectral window while gold only offers appreciable enhancements from the red region onward. In fact, a strong damping of the localized surface plasmon resonance of gold nanoparticles occurs below ca. 600 nm due to its large absorption.37 However, it is worth noting that the extent of the higher SERS
activity of silver-based assemblies, as deduced from the experimental data, can be also affected by other factors such as a different satellite distribution around the silica core as compared to gold clusters.
Generation of hot spots is also indirectly revealed by the excitation wavelength dependence of the relative SERS efficiencies. For silver-based nanostructures (Fig. 10c), the intensity ratio SiO2@AgNP26 vs. AgNP26 (IR) increases
with longer excitation wavelengths (IR, 532nm ∼ 9 that is much smaller than IR, 633nm ∼ 24). This can be explained by the
generation of interparticle gap-associated resonances, which are the most important for SERS. These interparticle gap-associated resonances are red-shifted with respect to the localized surface plasmon resonances of individual Ag nanoparticles, centered in the UV range of the spectra.50 For gold-based clusters (SiO
2@AuNP30 vs. AuNP30), a
similar value IR,633nm ∼ 19 is obtained for 633 nm wavelength. The SERS enhancement factors for SiO2@AuNP30 and
SiO2@AgNP26 substrates were calculated through direct comparison with the normal Raman spectra of pure TP at
the different excitation wavelengths. The corresponding values are reported in Fig. 10d (see ESI† section for all details about the calculation).
Conclusions
It was possible to obtain stable and robust raspberry-like nanoclusters, made of large plasmonic satellites, in an easy and reproducible protocol. To produce raspberry-like nanoclusters, we took advantage of the well-studied macromolecular and colloidal chemistry of the LbL approach. The optical characteristics of their plasmonic resonances (wavelength, width, extinction cross-section) were investigated at the single particle level using the
spatial modulation spectroscopy technique. The measured optical responses of the nanoclusters allowed us to show the large impact of the size and density of the satellites on the spectral position and extinction of the raspberry-like clusters. We anticipate the use of these stable plasmonic nanoparticles as a new type of SERS substrates that offer new possibilities for the ultrasensitive screening of analytical targets, such as those relevant to medical and environmental sciences.
Acknowledgements
TEM, HR-TEM and HR-SEM experiments were performed at the Plateforme de Caractérisation des Matériaux and Bordeaux Imaging Center of the University of Bordeaux. This work was supported by the Conseil Régional d'Aquitaine, the European FP7 project MetaChem under grant #228762, the ANR Project UNIT3D (under the contract ANR-BLAN-SIMI10-LS-100617-15-01), and the LABEX one (under the contract ANR-10-LABX-42) in the framework of IdEx Bordeaux (ANR-10-IDEX-03-02). Prof. Christine Bachoc at the Institut de Mathématiques de Bordeaux is sincerely acknowledged for helpful discussions. M. C.-D. acknowledge the Spanish Ministerio de Economia y Competividad (CTM2014-58481-R), Fundación Ramón Areces and Fundación Tatiana Pérez de Guzmán el Bueno. L. G. and R. A. P. acknowledge the European Research Council (PrioSERS FP7/2014 623527), the Ministerio de Economia y Competitividad (CTQ2014-59808-R) and the Generalitat de Catalunya (2014SGR480 and AGAUR-2014-052).
Notes and references
1. R. Costi, A. E. Saounders and U. Banin, Angew. Chem., Int. Ed., 2010, 49, 4878–4897. 2. Y. Yu, Q. Zhang, Q. Yao, J. Xie and J. Y. Lee, Acc. Chem. Res., 2014, 47, 3530–3540.
3. J. M. Romo-Herrera, R. A. Alvarez-Puebla and L. M. Liz-Marzán, Nanoscale, 2011, 3, 1304–1315. 4. T. Nguyen, C. Dinh and T. Do, Chem. Commun., 2015, 51, 624–635.
5. L. Carbone and P. D. Cozzoli, Nano Today, 2010, 5, 449–493.
6. U. Banin, Y. Ben Shahar and K. Vinokurov, Chem. Mater., 2014, 26, 97–110. 7. A. Vallecchi, M. Albani and F. Capolino, Opt. Express, 2011, 19, 2754–2772.
8. S. Mühlig, A. Cunningham, S. Scheeler, C. Pacholski, T. Bürgi, C. Rockstuhl and F. Lederer, ACS Nano, 2011, 5, 6586–6592. 9. S. N. Sheikholeslami, H. Alaeian, A. L. Koh and J. A. Dionne, Nano Lett., 2013, 13, 4137–4141.
10. Z. Qian, S. P. Hastings, C. Li, B. Edward, C. K. Mcginn, N. Engheta, Z. Fakhraai and S. Park, ACS Nano, 2015, 24, 1263–1270. 11. K. Chatterjee, S. Sarkar, K. Jagajjanani Rao and S. Paria, Adv. Colloid Interface Sci., 2014, 209, 8–39.
12. M. Inuta, R. Arakawa and H. Kawasaki, Analyst, 2011, 136, 1167–1176.
13. W. Xie, C. Herrmann, K. Kömpe, M. Haase and S. Schlücker, J. Am. Chem. Soc., 2011, 133, 19302–19305. 14. W. Xie, B. Walkenfort and S. Schlücker, J. Am. Chem. Soc., 2012, 135, 1657–1660.
15. V. Salgueiriño-Maceira, F. Caruso and L. M. Liz-Marzán, J. Phys. Chem. B, 2003, 107, 10990–10994. 16. S. L. Westcott, S. J. Oldenburg, T. R. Lee and N. J. Halas, Langmuir, 1998, 14, 5396–5401.
17. J. Xue, C. Wang and Z. Ma, Mater. Chem. Phys., 2007, 105, 419–425.
18. M. Karg, I. Pastoriza-Santos, J. Perez-Juste, T. Hellweg and L. Liz-Marzan, Small, 2007, 3, 1222–1229. 19. Y. Han, S. Sukhishvili, H. Du, J. Cefaloni and B. Smolinski, J. Nanosci. Nanotechnol., 2008, 8(11), 5791–5800. 20. R. Ashayer, S. H. Mannan and S. Sajjadi, Colloids Surf., 2008, 329, 134–141.
21. R. Höller, M. Dulle, S. Thomä, M. Mayer, A. Steiner, S. Förster, A. Fery, C. Kuttner and M. Chanana, ACS Nano, 2016, 10, 5740– 5750.
22. U. Fano, Phys. Rev., 1961, 124, 1866–1878.
23. J. Ye, F. Wen, H. Sobhani, J. B. Lassiter, P. V. Dorpe, P. Nordlander and N. J. Halas, Nano Lett., 2012, 12, 1660–1667.
24. S. Gomez-Graña, A. Le Beulze, M. Treguer-Delapierre, S. Mornet, E. Grana, E. Cloutet, G. Hadziioannou, J. Leng, J. Salmon, V. G. Kravets, A. Grigorenko, N. Peyyety, V. Ponsinet, P. Richetti, A. Baron, D. Torrent and P. Barois, Mater. Horiz., 2016, 3(6), 596–601. 25. A. J. Pasquale, B. M. Reinhard and L. Dal Negro, ACS Nano, 2011, 5, 6578–6585.
26. Q. Zhang, C. Cobley, L. Au, M. Mckiernan, A. Schwartz, L. P. Wen, J. Chen and Y. Xia, ACS Appl. Mater. Interfaces, 2009, 1, 2044– 2048.
27. P. Massé, S. Mornet, E. Duguet, M. Tréguer-Delapierre, S. Ravaine, A. Iazzolino, J. B. Salmon and J. Leng, Langmuir, 2013, 29, 1790–1795.
28. C. Ziegler and A. Eychmüller, J. Phys. Chem. C, 2011, 115, 4502–4506.
29. J. Turkevich, P. C. Stevenson and J. Hillier, Discuss. Faraday Soc., 1951, 11, 55–75.
30. A. Désert, I. Chaduc, S. Fouilloux, J.-C. Taveau, O. Lambert, M. Lansalot, E. Bourgeat-Lami, A. Thill, O. Spalla, S. Ravaine and E. Duguet, Polym. Chem., 2012, 3, 1130–1132.
31. K. D. Hartlen, A. P. T. Athanasopoulos and V. Kitaev, Langmuir, 2008, 24, 1714–1720. 32. X. Liu and J. He, J. Colloid Interface Sci., 2007, 314, 341–345.
33. A. Arbouet, D. Christofilos, N. Del Fatti, F. Vallée, J. Huntzinger, L. Arnaud, P. Billaud and M. Broyer, Phys. Rev. Lett., 2004, 93, 127401.
34. A. Crut, P. Maioli, N. Del Fatti and F. Vallée, Chem. Soc. Rev., 2014, 43, 3921–3956.
35. N. Reinhardt, L. Adumeau, O. Lambert, S. Ravaine and S. Mornet, J. Phys. Chem. B, 2015, 119(21), 6401–6411. 36. J. H. Conway and N. J. A. Sloane, Sphere Packing, Lattices and Groups, 1998.
37. A. Perro, D. Nguyen, S. Ravaine, E. Bourgeat-Lami, O. Lambert, J. C. Taveau and E. Duguet, J. Mater. Chem., 2009, 19, 4225–4230. 38. M. Spasova, V. Salgueirino-Maceira, A. Schlachter, M. Hilgendorff, M. Giersig, L. M. Liz-Marzan and M. Farle, J. Mater. Chem.,
2005, 15, 2095–2098.
39. H. Ai, M. Fang, S. A. Jones and Y. M. Lvov, Biomacromolecules, 2002, 3, 560–564. 40. P. Schuetz and F. Caruso, Adv. Funct. Mater., 2003, 13, 929–937.
41. S. Link and M. A. El-sayed, J. Phys. Chem. B, 1999, 103, 8410–8426.
42. H. Baida, P. Billaud, S. Marhaba, D. Christofilos, E. Cottancin, A. Crut, J. Lermé, P. Maioli, M. Pellarin, M. Broyer, N. Del Fatti, F. Vallée, A. Sánchez-Iglesias, I. Pastoriza-Santos and L. M. Liz-Marzán, Nano Lett., 2009, 9, 3463–3469.
43. V. Juvé, M. F. Cardinal, A. Lombardi, A. Crut, P. Maioli, J. Pérez-Juste, L. M. Liz-Marzán, N. Del Fatti and F. Vallée, Nano Lett., 2013, 13, 2234–2240.
44. A. Lombardi, M. Loumaigne, A. Crut, P. Maioli, N. Del Fatti, F. Vallée, M. Spuch-Calvar, J. Burgin, J. Majimel and M. Tréguer-Delapierre, Langmuir, 2012, 28, 9027–9033.
45. Y. R. Davletshin, A. Lombardi, M. F. Cardinal, V. Juvé, A. Crut, P. Maioli, L. M. Liz-Marzán, F. Vallée, N. Del Fatti and J. C. Kumaradas, ACS Nano, 2012, 6, 8183–8193.
46. E. Pertreux, A. Lombardi, I. Florea, M. Spuch-Calvar, S. Gómez-Graña, D. Ihiawakrim, C. Hirlimann, O. Ersen, J. Majimel, M. Tréguer-Delapierre, M. Hettich, P. Maioli, A. Crut, F. Vallée and N. Del Fatti, Adv. Opt. Mater., 2015, 4(4), 567–577. 47. P. K. Jain and M. A. El-sayed, Chem. Phys. Lett., 2010, 487, 153–164.
48. P. B. Johnson and R. W. Christy, Phys. Rev. B: Solid State, 1972, 6, 4370–4379. 49. R. A. Álvarez-Puebla, J. Phys. Chem. Lett., 2012, 3, 857–866.
50. H. Y. Jung, Y. K. Park, S. Park and S. K. Kim, Anal. Chim. Acta, 2007, 602, 236–243.
51. E. C. Le Ru and P. G. Etchegoin, Principles of Surface-Enhanced Raman Spectroscopy, 2009.
52. N. Pazos-Perez, C. S. Wagner, J. M. Romo-Herrera, L. M. Liz-Marzán, F. J. García de Abajo, A. Wittemann, A. Fery and R. A. Alvarez-Puebla, Angew. Chem., Int. Ed., 2012, 51, 12688–12693.
53. N. Pazos-Perez, F. J. Garcia de Abajo, A. Fery and R. A. Alvarez-Puebla, Langmuir, 2012, 28, 8909–8914.
54. B. Mir-Simon, J. Morla-Folch, P. Gisbert-Quilis, N. Pazos-Perez, H. Xie, N. Bastùs, V. Puntes, R. Alvarez-Puebla and L. Guerrini, J. Opt., 2015, 17(11), 114012–114015.
Fig. 1 Typical TEM images of silver nanoparticles AgNP26 and gold nanoparticles AuNP with various diameter
from 10 to 50 nm (scale bars: 50 nm in inserts).
Fig. 2 Isothermal variation of the ζ-potential of 106 nm silica nanoparticles as a function of pH before (a) and
after surface modification with (b) EDPS and (c) polyelectrolytes. (d) Typical TEM image of 106 nm silica nanoparticles (scale bar: 100 nm).
Fig. 3 (a) Images of Eppendorf tubes where the assembly between 26 nm silver particles and 89 nm
EDPS-modified silica particles was performed for different silver-to-silica number ratios, at pH 7 and a constant concentration of silica of 3.1 × 10¹⁴ L−1. Typical TEM picture of particles (b) obtained for a silver-to-silica number
ratio of 160, (c) after addition of PVP and washing, (d, e) after encapsulation in silica shell (scale bars: 100 nm).
Fig. 4 (a) HR-SEM and (b) TEM images of clusters obtained from 26 nm PVP-coated silver and 106 nm
Fig. 5 UV-Visible absorption spectra of aqueous dispersions of (a) PVP-coated AgNP26 particles, (b) clusters made
of 106 nm polyelectrolyte-coated silica and PVP-coated AgNP26 particles and (c) after deposition of a second layer of AgNP26.
Fig. 6 TEM and SEM images of the silica-coated clusters obtained from 106 nm polyelectrolyte-modified silica
particles and (a) AuNP10, (b) AuNP20, (c) AuNP30, (d) AuNP40 and (e) AuNP50 nanoparticles according to the experimental conditions described in Table 1 (insert scale bar: 50 nm).
Fig. 7 UV-Visible absorption spectra of aqueous dispersions of (a) citrate-coated gold nanoparticles and (b)
clusters made of 106 nm polyelectrolyte-coated silica and negatively charged gold particles. The curbs correspond to 10 (black), 20 (red), 30 (green), 40 (pink) and 50 nm (yellow) gold particle diameters.
Fig. 8 Absolute extinction spectra of individual SiO2@AuNP10 (black squares), SiO2@AuNP20 (red circles) and
SiO2@AuNP30 (green triangles) clusters measured by SMS. The TEM images of these three clusters are shown
above.
Fig. 9 Computed extinction spectra of SiO2@Au clusters with N = 1, 6, 12 and 20 satellites. Computations were
performed for 100/50 nm core/satellite diameters and regular satellite spacing (see images above), assuming a homogeneous environment having a refractive index of 1.3.
Fig. 10 (a) Representative SERS spectra of thiophenol (TP) on the raspberries-like cluster suspensions at various
excitation wavelengths (532 and 633 nm) (gray: SiO2@AgNP26; orange red: SiO2@AuNP30). The spectra were
rescaled for the sake of comparison. (b) and (c) Comparison of the SERS intensities of the TP band at 999 cm−1 for SERS spectra acquired at different excitation wavelengths on negatively charged colloids (AgNP26, AuNP20 and AuNP30) and their corresponding raspberry-like nanoclusters, based on polyelectrolyte-modified silica cores. SERS measurements were performed on the colloidal solutions and the corresponding SERS intensities were normalized to 1 s exposure time and 1 mW of laser power. The clusters concentration in the samples remained constant at ca. 6 × 10¹³ L−1. (d) Estimated SERS enhancement factors for SiO2@AuNP30 and SiO2@AgNP26 at