HAL Id: hal-02159778
https://hal.archives-ouvertes.fr/hal-02159778
Submitted on 19 Jun 2019
HAL is a multi-disciplinary open access archive for the deposit and dissemination of sci-entific research documents, whether they are pub-lished or not. The documents may come from teaching and research institutions in France or
L’archive ouverte pluridisciplinaire HAL, est destinée au dépôt et à la diffusion de documents scientifiques de niveau recherche, publiés ou non, émanant des établissements d’enseignement et de recherche français ou étrangers, des laboratoires
Integrated microfluidic device for the separation,
decomposition and detection of low molecular weight
S-nitrosothiols
Gerson Duarte-Junior, Abdulghani Ismail, Sophie Griveau, Fanny d’Orlyé, José Alberto Fracassi da Silva, Wendell Coltro, Fethi Bedioui, Anne Varenne
To cite this version:
Gerson Duarte-Junior, Abdulghani Ismail, Sophie Griveau, Fanny d’Orlyé, José Alberto Fracassi da Silva, et al.. Integrated microfluidic device for the separation, decomposition and detection of low molecular weight S-nitrosothiols. Analyst, Royal Society of Chemistry, 2019, 144 (1), pp.180-185. �10.1039/c8an00757h�. �hal-02159778�
Integrated microfluidic device for the separation,
1
decomposition and detection of low molecular weight
2
S-nitrosothiols
3 4
Gerson F. Duarte-Junior
a,b, Abdulghani Ismail
a,Sophie Griveau
a, Fanny
5
d'Orlyé
a, José Alberto Fracassi da Silva
e, Wendell K. T. Coltro
b, Fethi
6
Bedioui
a, Anne Varenne
a*7 8
a
Chimie ParisTech, PSL Research University, INSERM 1022, CNRS 8258 ,
9
Paris Descartes, Unité de Technologies Chimiques et Biologiques pour la
10
Santé, 75005 Paris, France
11
b
Instituto de Química, Universidade Federal de Goiás, Campus
12
Samambaia, Goiânia, GO, 74690-900, Brazil
13
c
Instituto de Química, Universidade Estadual de Campinas, UNICAMP,
14
Campinas, SP, 13083-970, Brazil
15 16
*Corresponding Author. (anne.varenne@chimieparistech.psl.eu)
Abstract
18
S-nitrosothiols (RSNOs) are considered as biological circulating stocks of
19
nitric oxide (NO) that have many roles in-vivo. The variation of RSNOs
20
proportion occurs in several diseases, which makes them potent
21
biomarkers. The identification and quantitation of each RSNO is therefore
22
important for biomedical studies. For now, miniaturized devices have been
23
used to detect RSNOs, based on their total quantitation without a preceding
24
separation step. This study reports on an original and integrated
25
microdevice allowing for the successive separation of low molecular weight
26
RSNOs, their decomposition under metal catalysis, and the quantitation by
27
amperometric detection of the produced nitrite, leading to their quantitation
28
in a single run. For this purpose, a commercial SU-8/Pyrex microfluidic
29
system was coupled to a portable and wireless potentiostat. Different
30
operating and running parameters were optimized to achieve the best
31
analytical performance allowing for LODs of 20 M. The simultaneous
32
separation of S-nitrosoglutathione and S-nitrosocysteine was successfully
33
obtained within 75 s.
34
Introduction
37
S-Nitrosothiols (RSNOs) are nitric oxide (NO) carrier molecules that play
38
important roles in several physiological functions (vasodilatation and
39
relaxation1, 2, antiplatelet aggregation3, 4, antimicrobial5, regulation and
40
signaling protein function6…) and pathological events (neurodegenerative
41
diseases such as Parkinson and Alzheimer7, apoptosis8, chronic obstructive
42
pulmonary disease9, preeclampsia10, diabetes11…). RSNOs can be divided
43
into low molecular weight (LMW) and high molecular weight (HMW)
44
RSNOs. Although there is no defined border in terms of molecular mass, it
45
is common to use the term “low molecular weight” for peptides and
46
aminoacid nitrosothiols (such as nitrosoglutathione (GSNO) and
S-47
nitrosocysteine (CySNO)) and “high molecular weight” for s-nitrosylated
48
proteins (such as S-nitrosoalbumin (AlbSNO) and S-nitrosohemoglobin
49
(HbSNO)). RSNOs store, transport and release NO. They can also
inter-50
exchange NO through transnitrosation reaction13. The variation of RSNOs
51
concentration has been shown to occur in many diseases12. For all these
52
reasons, the development of powerful methodologies for the simultaneous
53
quantitation of all RSNOs in a biological sample is crucial.
54
Numerous methods have been developed for RSNOs analysis, based on
separation of RSNOs from other species by capillary electrophoresis (CE)
57
or liquid chromatography followed by mass spectrometric or
58
spectrophotometric detection14. For example, the simultaneous separation
59
of S-nitrosoglutathione (GSNO) and S-nitrosocysteine (CySNO) was
60
performed by our group using conventional CE equipped with capacitively
61
coupled contactless conductivity detection but in a conventional system15.
62
In another work, the simultaneous separation of GSNO, GSH, glutathione
63
sulfonic and sulfinic acid by CE coupled to mass spectrometry was
64
obtained14. Most standard methods developed for RSNOs quantitation
65
reported in the literature remain indirect. They are based on the detection of
66
their decomposition products16, through homolytic or heterolytic cleavage of
67
S-NO bond generating NO or NO+ leading finally to NO2-. These 68
decomposition products are then detected by spectrophotometry,
69
fluorimetry, electrochemistry or chemiluminescence 16, 17. Various reagents
70
have been used to decompose RSNOs, such as metal cations18 (Hg2+,
71
Cu+), light19 and heat20, leading to different decomposition products: NO is
72
generated18 if Cu+, light or heat are employed, whereas nitrite is directly
73
generated18, 21 when Hg2+ or Ag+ are used.
74
Nowadays, miniaturization in chemical analysis has become a powerful tool
75
contributing to reduce the samples/reagents amount, analysis time and
waste generation. Such an approach can be beneficial for the quantitation
77
of RSNOs. Indeed, our group has recently reported on the colorimetric
78
analysis of RSNOs in a microfluidic paper-based anaytical device22. This
79
system allowed to perform analysis of total RSNOs in plasma samples
80
without any separation step. Other approaches were proposed by Hunter et
81
al. for NO23 and total RSNO detection24 (after light decomposition) using a
82
single PDMS microfluidic channel with amperometric detection. In all cases
83
no separation of RSNOs occurred before detection in these miniaturized
84
devices. Also, Gunasekara et al25 used microchip capillary electrophoresis
85
(MCE) with amperometric detection to separate a NO donor
86
(DEA-NONOate or Proli-NONOate) from NO and nitrite in less than one
87
minute. Tu et al.26 used MCE with fluorescence detection to separate and
88
detect NO, reduced glutathione (GSH) and cysteine (Cys). Herein we report
89
the design and optimization of a single-run MCE analytical strategy allowing
90
for the first time the simultaneous quantitation of two low molecular weight
91
RSNOs (S-nitrosoglutathione and S-nitrosocysteine), thanks to the
92
integration of successive electrokinetic separation, RSNO decomposition by
93
Hg2+ to nitrite and nitrite quantitation by amperometry.
Experimental
95
Chemicals
96
All reagents were of analytical grade and used as received. L-arginine
97
(ARG), 2-(N-morpholino) ethanesulfonic acid (MES), acetic acid (HAc),
L-98
histidine (His), sodium tetraborate, Sodium Nitrite, N-acetyl-p-aminophenol
99
(Paracetamol), Mercury(II) Chloride, EDTA, hydrochloric acid, sodium
100
phosphate monobasic, sodium phosphate dibasic, L-cysteine (Cys) and
101
reduced glutathione (GSH), were purchased from Sigma Aldrich (St. Louis,
102
MO, USA). All aqueous solutions were made using ultra-pure water with a
103
resistivity of 18.2 MΩ.cm from a Pure Lab Flex system (ELGA Labwater,
104
France).
105
Synthesis of S-nitrosothiols
106
GSNO was synthesized as described elsewhere27. Briefly, an equimolar
107
amount of nitrite was added to the equimolar amount of GSH and HCl. The
108
resulting pure solid was rinsed once with 80% acetone, twice with 100%
109
acetone and three times with diethyl ether and then stocked in the dark at
110
20 °C.
111
S-Nitrosocysteine (CySNO) was daily synthesized using the method
112
described by Peterson and coworkers 28. Briefly, solutions of 5 mM CysNO
were prepared by reacting cysteine with an equimolar concentration of
114
nitrite in acidic medium (0.1 M HCl) in a dark flask to avoid light
115
decomposition. After 5 min, more than 90% of cysteine was converted into
116
CysNO. The solution was neutralized by 0.1 M PBS buffer (pH 7.4)
117
containing 0.5 mM EDTA to prevent decomposition by trace metal cation
118
contaminants.
119
Final concentrations of RSNOs were determined spectrophotometrically in
120
aqueous solution at 335 nm (ε = 586 and 503 M−1 cm−1 for GSNO and
121
CysNO, respectively)29.
122
Instrumentation
123
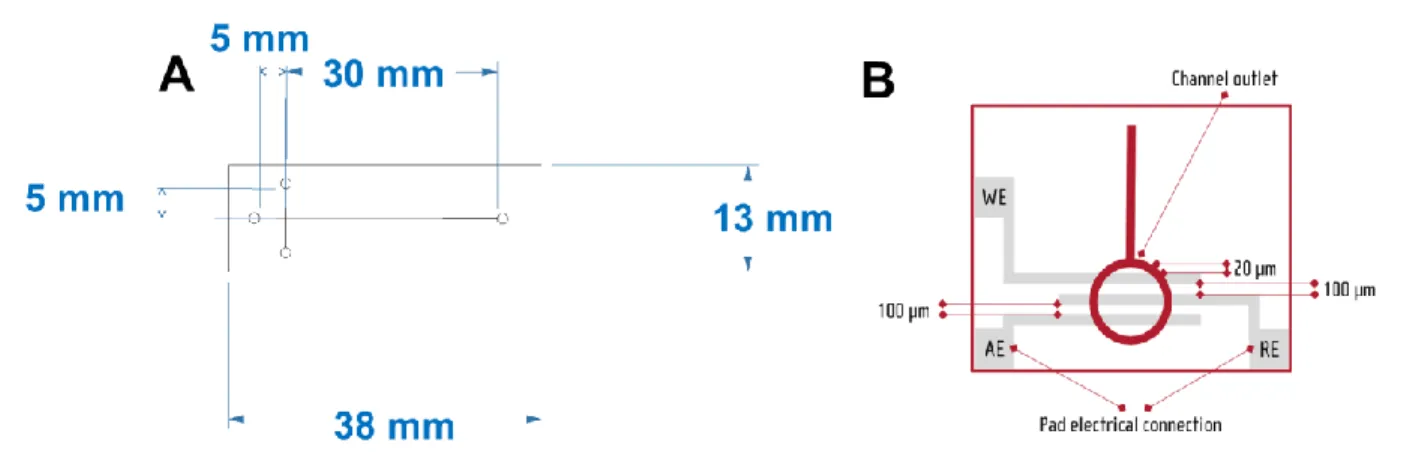
Electrophoretic experiments were performed using a SU-8/Pyrex
124
microchips with integrated micro band platinum electrodes at the outlet end
125
of the separation channel from Micrux Technologies (Oviedo, Spain)
(MCE-126
SU8-Pt001T) (Figure 1). Only working (WE) and reference (RE) electrodes
127
were used, with widths of 50 μm and 250 μm, respectively. The separation
128
and injection channel length were 35 mm and 10 mm, respectively. The
129
microchannels width and depth were 50 μm and 20 μm, respectively. A
130
microfluidic platform (Oviedo, Spain) (MCE-HOLDER-DC02) was used to
131
interface the microchip with the amperometric detector and the high voltage
source. The high voltage source was a programmable HVS443000V
8-133
channels high-voltage supply (LabSmith Inc., CA, USA) controlled by
134
Sequence software v.1.165. Amperometric detection was performed by a
135
modified model 9051, 2-channel, wireless, portable and electrically isolated
136
potentiostat (Pinnacle Technology, Lawrence, KS. USA) operating in a
137
two-electrode format at a 5 Hz sampling rate (gain=5 000 000 V/A,
138
resolution= 30 fA). This potentiostat is isolated which eliminates
139
interferences from the high voltage power supply system used for the
140
separation. This potentiostat was controlled by Sirenia Acquisition Software
141
v.1.7.6. The WE and RE were connected to the corresponding electrodes
142
using the commercial chip holder.
143
144
Figure 1 - Schematic presentation of A) dimensions and B) design of Micrux MCE-SU8-Pt001T chip.
145
Adabpted from 30
146 147
C4D detection was performed using a commercial detector model ER815
148
acquired from eDAQ Pty (Denistone East, Australia). A microfluidic
platform EDAQ ET121 containing external electrodes was used to interface
150
a commercial PMMA microchip (model 02-0750-0082-01, ChipShop, Jena,
151
Netherlands) with the detection system. This microchip layout comprised
152
separation and injection channels (50 μm wide/deep) with 87 and 10 mm
153
long, respectively.
154
Electrophoresis and Decomposition procedure
155
Prior to analysis, microchannels were conditioned with 0.1 M NaOH,
156
deionized water and running buffer. Samples of RSNOs and paracetamol
157
(1 mM each) were electrokinetically injected by gated mode31 by applying
158
potentials of 800 V and 1000 V to sample and buffer reservoirs,
159
respectively, while both waste reservoirs were grounded for the loading
160
step. The injection was performed by floating the potential at the buffer
161
reservoir for 3 s, giving the start of the separation step. The same
162
procedure but under reversed polarity was performed for nitrite (1 mM)
163
quantitation. For the decomposition step, HgCl2 (10 mM) was added in the 164
detection reservoir. Before RSNOs reach the buffer waste reservoir the
165
polarity was inverted allowing detection of nitrite generated from
166
decomposition. For amperometric detection of nitrite and paracetamol,
167
potentials from 0.7 to 1.2 V vs. Pt were applied. Analysis using C4D
detection was performed applying a sinusidal signal of 600 kHz and
170
90 Vpeak-to-peak. 171
Results and discussion
172
Herein a method for successive separation, decomposition, and detection
173
of RSNOs is proposed by integrating all the three steps in a microfluidic
174
device. In order to achieve this goal, the decomposition should be (i) much
175
faster than the separation process (otherwise the peaks originating from
176
different RSNOs will overlap) (ii) quantitable and (iii) the decomposition
177
product should be stable through the analysis time and operating
178
conditions. It is well known that the decomposition product of RSNOs
179
depends on the decomposition agent. As indicated above, the use of Cu+ or
180
light leads to homolytic cleavage and to the formation of NO, while the use
181
of Hg2+ leads to heterolytic cleavage and to the production of NO+ that
182
transforms immediately to NO2-. Decomposition of RSNOs by light is slow 183
(tenth of minutes are needed to decompose the sample15) and only partial
184
decomposition of RSNOs have be obtained by Hunter et al24 in a
185
microfluidic device using 530 nm LED. Cu+ decomposition is faster than
186
light decomposition but still insufficient (>2 min32) in comparison with the
187
separation time scale. Moreover Cu+ is poorly soluble and stable in aquous
188
solution and it is usually produced by reduction of Cu2+ with reducing agent
189
such as GSH. Decomposition using Cu2+ is affected by the variation of GSH
using mercuric (II) is instantaneous leading to NO2 -
which is stable and
192
electroacive33. Consequently, Hg2+ was chosen as the decomposition
193
agent.
194
BGE plays an important role in the migration and electrochemical detection
195
steps in micro chip electrophoresis (MCE) 34, 35. As the objective was the
196
detection of nitrite generated from RSNO decomposition, the BGE
197
optimization was focused on nitrite signal/noise (S/N) ratio during detection.
198
Several BGEs usually used for biological samples during MCE were tested
199
: 20 mM MES / His (pH 6.0), 20 mM MES / Arg (pH 7.5), 20 mM Arg /
200
Acetic Acid (pH 5.8). Nitrite (1 mM) was injected in the gated mode (see
201
experimental section), separated and detected by amperometry using these
202
various BGEs. For each BGE, the detection potential applied between WE
203
and RE was varied from +0.5 V to +1.5 V keeping constant same
204
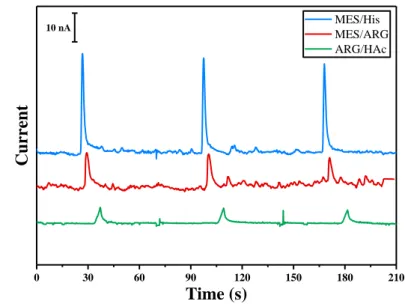
electrophoretic injection and separation conditions. The optimal potential for
205
nitrite detection in all BGE was 0.7 V. Figure 2 shows electropherograms
206
for the separation of nittire in various BGE. 20 mM MES/His (pH. 6.0)
207
provided the highest amperometric detection signal. However, it was not
208
selected for this design as Hg2+, that will be used as the decomposition
209
reagent for RSNO, reacts with histidine to form a precipitate. Although
210
MES/Arg leads to the highest signal intensity, it however results in the
lowest signal to noise ratio. Therefore, the selected BGE, leading to the
212
highest S/N ratio without interference with other molecules in the solution,
213
was 20 mM Arg adjusted to pH 5.8 with HAc.
214
215
Figure 2 – Electrophoretic separation of 1 mM nitrite in SU-8/Pyrex microchip. BGE: MES (20 mM)/His
216
(20 mM) pH 6.0 in blue, MES (20 mM)/ Arg (20 mM) pH 7.5 in red, Arg (20 mM) pH 5.8 adjusted with
217
Acetic Acid in green. Gated injection V1=-800V, V2= -1000V, injection time 3s, successive injections: 70s,
218
detection 0.7 V vs Pt.
219 220
For an optimized on-chip integration of the three steps involved in RSNOs
221
characterization (separation, decomposition and detection) in the microchip,
222
the apparent mobilities of each of the compounds (different RSNOs, nitrite,
223
mercury) were determined. The overall procedure was first optimized for
224
GSNO, as it is the most abundant low molecular weight RSNO. Control
225
experiments by direct addition of nitrite into the BW reservoir, with or
226 0 30 60 90 120 150 180 210 MES/His MES/ARG ARG/HAc Current Time (s) 10 nA
signal, proving the efficiency of the electrochemical detection step. A
228
neutral electroactive marker (paracetamol) allowed determining the
229
electroosmotic mobility as 1.85 ± 0.07 x10⁻⁴ cm2.V-1.s-1 and GSNO
230
electrophoretic mobility was determined as -0.64 ± 0.06 x10⁻⁴ cm2.V-1.s-1 ,
231
employing a C4D detector, as GSNO is not electroactive (results not
232
shown).
233
Under these experimental conditions, GSNO migrates towards the detector
234
under a positive polarity. The device was primarily developed as follows:
235
GSNO was electrokinetically injected from the sample reservoir (S) in the
236
gated mode in positive polarity (see experimental section). Hg2+ was
237
introduced in the waste reservoir (connected to the cathode) where it
238
should decompose GSNO into nitrite upon reaching the buffer waste
239
reservoir (BW). However, no amperometric signal was observed (results not
240
shown). One hypothesis is based on the fact that Hg2+ undergoes diffusion
241
from the BW within the separation channel, inducing the GSNO
242
decomposition within the separation channel. As nitrite electrophoretic
243
mobility under these experimental conditions (-4.25x10⁻⁴ cm2.V-1.s-1) is
244
higher in absolute value than the electroosmotic mobility, nitrite moves back
245
to the sample reservoir (S) instead of the BW reservoir where it should be
246
detected.
A new design was then developed, including an additional step allowing for
248
voltage inversion just before GSNO decomposition (Figure 3A). In this new
249
design, the loading, injection and separation steps were performed under
250
positive polarity (step I, II and III, respectively), Hg2+ is added before GSNO
251
reaches the channel end in step III, and polarity is inverted (step IV). This
252
inversion of polarity leads to the migration of Hg2+ and GSNO to the sample
253
reservoir (S). As Hg2+ migrates faster than GSNO, the migration zone of
254
Hg2+ enters that of GSNO, allowing for GSNO decomposition. The
255
produced nitrite migrates towards the BW reservoir and is detected (see
256
detail in step IV, Figure 3A). A typical electropherogram obtained
257
characterizing all the analytical steps is presented in Figure. 3B. Control
258
experiments (without Hg2+ or without GSNO) did not show any signal (data
259
not shown).
260
261
Figure 3 - (A) Scheme of the main steps for RSNOs quantitation. Loading step (I): Voltages of 800 and
262
1000 V are applied during 45 s to the sample (S) and buffer (B) reservoirs, respectively, grounding both
263
waste reservoirs (SW and BW). Injection step (II): samples are injected into separation channel by
264
floating the voltage applied to B reservoir during 3 s. Migration step (III): The potentials were then
step the potential polarity is inverted which leads to the migration of Hg2+ into the separation channel
268
faster than RSNO leading to RSNO decomposition. This is followed by nascent nitrite (in green) opposite
269
migration towards the electrodes and detection by applying a potential of 1.2 V vs Pt. (B) Typical
270
electropherogram obtained for GSNO (1 mmol/L) analysis characterising all the steps of the process.
271 272
Therefore, the overall integrated protocol includes (1) a separation of the
273
RSNOs under positive polarity, (2) an inversion of the separation polarity,
274
(3) a decomposition of RSNO thanks to the on-line crossing and mixing of
275
RSNO and Hg2+ zones, respectively, due to different migration velocities,
276
(4) the migration of the produced nitrite to the detector. So as to further
277
optimize the experimental conditions to improve the limit of detection for
278
nitrite, three parameters were studied; the BGE ionic strength (from 10 to
279
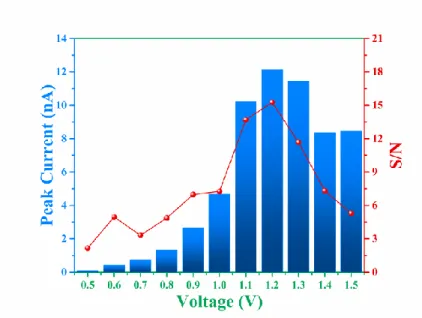
50 mM), the detection voltage (from 0.5 to 1.5 V vs Pt) and the time of
280
polarity inversion. Considering the two first parameters, best signal
281
intensities and S/N ratios for nitrite detection were obtained for a detection
282
potential of 1.2 V (Figure 4).
284
Figure 4 - Histogram of peak current (in nA) and signal-to-noise ratio (S/N) of nitrite (1 mM) injection in
285
SU-8/Pyrex microchip obtained by variation of the detection potential from 0.5 to 1.5 V vs Pt. BGE: 20 mM
286
arginine solution adjusted at pH 5.6 with acetic acid.
287 288
The time of polarity inversion is a crucial parameter as it should allow for
289
the best separation of the RSNOs, their total decomposition and their
290
optimal detection. For each studied compound, the electroosmotic and
291
apparent mobilities must therefore be determined. For RSNOs of positive
292
apparent mobility, the time of inversion should be chosen between the
293
migration time of the neutral marker and the one of the RNSOs. This
294
parameter was optimized for GSNO and CysNO. CysNO, another important
295
nitrosothiol, as it is smaller than GSNO and with similar charge at this pH,
296
presents a higher apparent mobility than GSNO. The best signal intensities
297
were obtained for an inversion time of 90 s and 75 s, for GSNO and CysNO
procedure for all types of RSNO. In these experimental conditions, the
300
analytical performances of this methodology were determined for GSNO.
301
The linearity was verified in the 100-700 µM concentration range (y=0.0485
302
x – 5.0485, R2
=0.9936) with a LOD of 20 µM
303
304
Figure 5 - Electropherograms for detection of 1 mM GSNO (Black) and 1 mM CySNO (Red and Blue) to
305
determine the time of polarity inversion. In black and red 90 s was used for inversion while in blue 75 s.
306
BGE: 20 mM arginine solution adjusted at pH 5.6 with acetic acid.
307 308
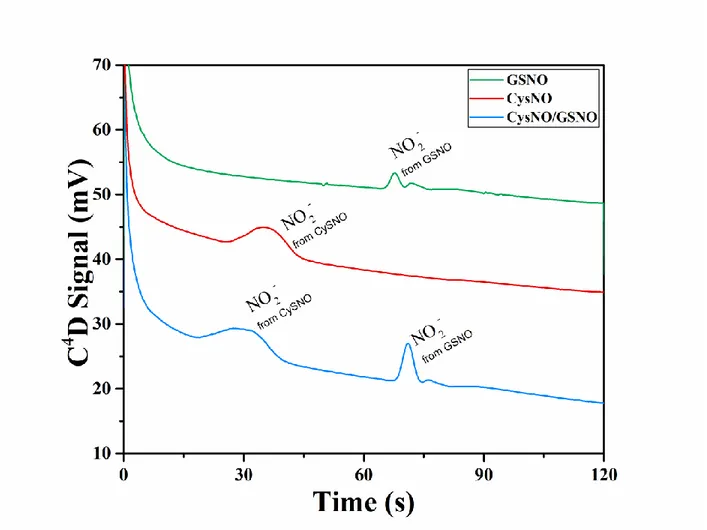
The final objective of such a micro-total analysis system is to allow for the
309
simultaneous quantitation of various RSNOs. Therefore three main
310
challenges have to be adressed : (i) the efficient separation of the different
311
RSNOs, (ii) the choice of a unique time of polarity inversion in the process,
312
and (iii) the efficient detection of the sucessive nitrite zones produced from
313
each RSNOs decomposition.
The simultaneous separation of GSNO and CysNO was performed so as to
315
prove the versatility of the sytem. For this purpose, GSNO and CysNO were
316
first separated and detected individually. The crucial parameter being the
317
inversion time, different values were applied from 75 to 90 s. In a second
318
step, an equimolar mixture of CySNO and GSNO (1 mM each) was
319
separated and detected. Figure 6 presents the resulting electropherograms
320
for an optimized inversion time of 75 s that corresponds to the migration
321
time of CysNO. As expected the signal arising from GSNO appears after
322
the one of CysNO, as CysNO has a higher apparent mobility. These results
323
indicate a powerfull simultaneous separation and indirect detection of
324
GSNO and CysNO. The similar intensities for GSNO and CySNO, injected
325
at the same concentration indicate that decomposition efficiency is similar
326
in both cases. This method is therefore applicable for the quantitation of
327
pharmaceutical RSNOs, future drug candidates. Some work is in progress
328
for decreasing the LODs to reach biological concentrations (less than 16
329
µM22).
330
332
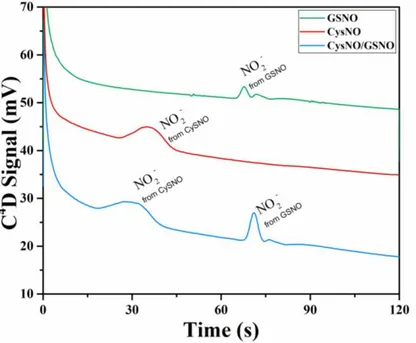
Figure 6 - Electropherograms corresponding to the electrophoretic profile of CySNO (1 mM), GSNO (1
333
mM) and mixture GSNO (1 mM) / CySNO (1 mM) in blue, red and black, respectively. Experiments were
334
performed in Su-8/pyrex microchip with gated injection. Procedure : (1) 3s injection, (12) application of
335
V1=800V, V2=1000V , during 3 minutes (not visible on the graph as it occurs before running the
336
electropherogram), (3) addition of Hg2+ at t=0s of the electropherogram, and inversion of polarity
V1=-337
800V, V2= -1000V for t=100s. Detection 1V vs Pt. BGE: ARG 20 mM adjusted to pH 5.8 with HAc
Conclusions
339
An original method to simultaneously quantify two low molecular RSNOs in
340
a mixture using MCE was developed. A commercial microchip of
SU-341
8/Pyrex microchip and a wireless isolated potentiostat were used. After the
342
electrokinetic separation step, an inversion of electrokinetic polarity was
343
necessary to mix the RSNOs with the decomposition agent within the
344
separation channel and detect the produced nitrite by amperometric
345
detection at the buffer waste reservoir. Optimization of BGE composition
346
and detection potential were performed in order to obtain the best signal
347
intensity and S/N ratio. The LODs were 20 µM for GSNO and CysNO. This
348
methodology can be applied for the quantitation of pharmaceutical RSNOs,
349
future drug candidates. Using a more environmental friendly decomposition
350
reagent such as immobilized gold nanoparticles is envisaged. The method
351
developed herein has shown to be versatile, opening the way to the
352
quantitation of complex mixtures of RSNOs.
353
354
Conflicts of interest
355
The author declares no conflicts of interest.
Financial support from “Coordenação de Aperfeiçoamento de Pessoal de
358
Nível Superior (CAPES)” and “French Committee for the Evaluation of
359
Academic and Scientific Cooperation with Brazil (COFECUB)” (grant n°
360
802-14) is acknowledged.
361
References
362
1. B. T. Mellion, L. J. Ignarro, C. B. Myers, E. H. Ohlstein, B. A. Ballot, A. L. Hyman 363
and P. J. Kadowitz, Mol. Pharmacol., 1983, 23, 653-664. 364
2. J. S. Stamler, D. I. Simon, J. A. Osborne, M. E. Mullins, O. Jaraki, T. Michel, D. J. 365
Singel and J. Loscalzo, Proc. Natl. Acad. Sci. U.S.A., 1992, 89, 444-448. 366
3. E. J. Langford, A. S. Brown, R. J. Wainwright, A. J. Debelder, M. R. Thomas, R. 367
E. A. Smith, M. W. Radomski, J. F. Martin and S. Moncada, Lancet, 1994, 344, 368
1458-1460. 369
4. M. W. Radomski, D. D. Rees, A. Dutra and S. Moncada, Br. J. Pharmacol., 1992, 370
107, 745-749.
371
5. G. F. P. de Souza, J. K. U. Yokoyama-Yasunaka, A. B. Seabra, D. C. Miguel, M. 372
G. de Oliveira and S. R. B. Uliana, Nitric Oxide-Biol. Chem., 2006, 15, 209-216. 373
6. C. G. Kevil and R. P. Patel, Curr. Opin. Investig. Drugs, 2010, 11, 1127-1134. 374
7. M. Ito, Annu. Rev. Neurosci., 1989, 12, 85-102. 375
8. A. R. Butler and P. Rhodes, Anal. Biochem., 1997, 249, 1-9. 376
9. K. M. Beeh, J. Beier, N. Koppenhoefer and R. Buhl, Chest, 2004, 126, 1116-377
1122. 378
10. V. A. Tyurin, S. X. Liu, Y. Y. Tyurina, N. B. Sussman, C. A. Hubel, J. M. Roberts, 379
R. Taylor and V. E. Kagan, Circ. Res., 2001, 88, 1210-1215. 380
11. A. B. Milsom, C. J. H. Jones, J. Goodfellow, M. P. Frenneaux, J. R. Peters and P. 381
E. James, Diabetologia, 2002, 45, 1515-1522. 382
12. M. W. Foster, T. J. McMahon and J. S. Stamler, Trends Mol. Med., 2003, 9, 160. 383
13. B. C. Smith and M. A. Marletta, Curr. Opin. Chem. Biol., 2012, 16, 498-506. 384
14. A. Ismail, F. d’Orlyé, S. Griveau, J. A. F. Da Silva, F. Bedioui and A. Varenne, 385
Anal. bioanal. chem., 2015, 407, 6221-6226.
386
15. A. Ismail, F. d'Orlye, S. Griveau, F. Bedioui, A. Varenne and J. A. F. da Silva, 387
Electrophoresis, 2015, 36, 1982-1988.
388
16. S. Griveau and F. Bedioui, Analyst, 2013, 138, 5173-5181. 389
17. D. Giustarini, A. Milzani, I. Dalle-Donne and R. Rossi, J. Chromatogr. B, 2007, 390
851, 124-139.
391
18. D. L. H. Williams, Acc. Chem. Res., 1999, 32, 869-876. 392
19. M. M. Veleeparampil, U. K. Aravind and C. T. Aravindakumar, adv. phys. chem., 393
2009, 2009. 394
20. M. G. de Oliveira, S. M. Shishido, A. B. Seabra and N. H. Morgon, J. Phys. 395
Chem. A, 2002, 106, 8963-8970.
21. H. R. Swift and D. L. H. Williams, J. Chem. Soc., Perkin Trans. 2, 1997, 1933-397
1935. 398
22. A. Ismail, M. O. Araujo, C. L. S. Chagas, S. Griveau, F. D'Orlye, A. Varenne, F. 399
Bedioui and W. K. T. Coltro, Analyst, 2016, 141, 6314-6320. 400
23. R. A. Hunter, B. J. Privett, W. H. Henley, E. R. Breed, Z. Liang, R. Mittal, B. P. 401
Yoseph, J. E. McDunn, E. M. Burd, C. M. Coopersmith, J. M. Ramsey and M. H. 402
Schoenfisch, Anal. Chem., 2013, 85, 6066-6072. 403
24. R. A. Hunter and M. H. Schoenfisch, Anal. Chem., 2015, 87, 3171-3176. 404
25. D. B. Gunasekara, M. K. Hulvey, S. M. Lunte and J. A. F. da Silva, Anal. Bioanal. 405
Chem., 2012, 403, 2377-2384.
406
26. F. Q. Tu, L. Y. Zhang, X. F. Guo, Z. X. Zhang, H. Wang and H. S. Zhang, J. 407
Chromatogr. A, 2014, 1359, 309-316.
408
27. J.-W. Yoo, G. Acharya and C. H. Lee, Biomaterials, 2009, 30, 3978-3985. 409
28. L. A. Peterson, T. Wagener, H. Sies and W. Stahl, Chem. Res. Toxicol., 2007, 20, 410
721-723. 411
29. R. A. Hunter and M. H. Schoenfisch, Anal. Chem., 2015, 87, 3171-3176. 412
30. https://www.micruxfluidic.com/en/ Acessed on 04/12/2018 413
31. S. C. Jacobson, S. V. Ermakov and J. M. Ramsey, Anal. Chem., 1999, 71, 3273-414
3276. 415
32. A. Ismail, S. Griveau, F. d'Orlyé, A. Varenne and F. Bedioui, Electroanalysis, 416
2015, 27, 2857-2863. 417
33. B. Thirumalraj, S. Palanisamy, S.-M. Chen and D.-H. Zhao, J. Colloid Interface 418
Sci., 2016, 478, 413-420.
419
34. P. Kubáň and P. C. Hauser, Electrophoresis, 2009, 30, 3305-3314. 420
35. J. L. Beckers and P. Boček, Electrophoresis, 2003, 24, 518-535. 421