HAL Id: hal-03042896
https://hal.univ-lorraine.fr/hal-03042896
Submitted on 7 Dec 2020
HAL is a multi-disciplinary open access
archive for the deposit and dissemination of
sci-entific research documents, whether they are
pub-lished or not. The documents may come from
teaching and research institutions in France or
abroad, or from public or private research centers.
L’archive ouverte pluridisciplinaire HAL, est
destinée au dépôt et à la diffusion de documents
scientifiques de niveau recherche, publiés ou non,
émanant des établissements d’enseignement et de
recherche français ou étrangers, des laboratoires
publics ou privés.
Strong magnetocaloric effect induced by spin
reorientation transitions in epitaxial Ho thin films
O. Koplak, R. Morgunov, R. Medapalli, E. Fullerton, S Mangin
To cite this version:
O. Koplak, R. Morgunov, R. Medapalli, E. Fullerton, S Mangin. Strong magnetocaloric effect induced
by spin reorientation transitions in epitaxial Ho thin films. Physical Review B, American Physical
Society, 2020, 102, pp.134426. �10.1103/physrevb.102.134426�. �hal-03042896�
Strong magnetocaloric effect induced by spin reorientation
transitions in epitaxial Ho thin films
O. Koplak1, R.Morgunov1,2, R.Medapalli3,4, E.Fullerton3, S. Mangin5
1Institute of Problems of Chemical Physics, 142432, Chernogolovka, Russia 2
I.M. Sechenov First Moscow State Medical University, Ministry of Health of Russia, 119991 Moscow, Russia
3Center for Memory and Recording Research, University of California, San Diego, California
92093-0401, USA
4Department of Physics, School of Sciences, National Institute of Technology, Andhra Pradesh-534102, India 5Université de Lorraine, CNRS, IJL, F-54000 Nancy, France
*E-mail:o.koplak@gmail.com
Magnetocaloric effect (MCE) in antiferromagnetic holmium (Ho) film is studied near the spin reorientation temperatures. A series of magnetization isotherms from 60 K to 150 K around the Neel temperature, TN ≈ 130 K were recorded for both in-plane and out-of-plane magnetic field
orientations. A change in entropy, ∆SM of – 5 J/kg K was found near TN for an in-plane field
orientation. A large change in ∆SM of – 11.8 J/kg K due to a fan-helix spin transition at Т = 90 K is
observed for an in-plane field orientation. Spin transition at both TN and at the fan-helix transition
exhibit larger MCE in the in-plane field orientations in comparison with the perpendicular orientation. The value of the refrigerant capacity extracted from the temperature dependence of ΔSM(T) is found to
be larger for the "in- plane" orientation by a factor of two.
I. INTRODUCTION
Holmium (Ho) is a rare earth spiral antiferromagnet, where the magnetic moments in each of its atomic layers align in-plane to form a ferromagnetic state, but each layer is slightly misaligned to each adjacent layer resulting in an out-of-plane helix magnetic structure. Ho has a commensurate conical structure below TC ~19 K and a basal-plane spiral structure between 19 K
and 133 K in their helicities. Above the Néel temperature (TN)
~133 K, Ho is paramagnetic [1–4]. Several magnetic phases (cone, fan, and helix) exist at different temperatures in zero magnetic field. Such magnetic phases have been extensively studied and well understood. However, application of an external magnetic field has a huge influence on formation various intermediate magnetic phases, e.g., spin-slip, ferrofan, and helifan. The existence of each phase is determined by two major competing energies: exchange and magneto-crystalline anisotropy. For instance, in high-purity holmium crystals the spin-slip and fan-helicoidal phases can be observed [1–4]. In [5], the region of existence of a spin-slip phase in the 95 – 110 K range and an intermediate phase of the ferro-fan type in the 40 – 120 K range were found under 20 – 80 kOe applied magnetic field. In zero field at T = 78 K, the spin-slip phase turns into a spiral phase. Moreover, in Ho thin films the (H, T) phase diagram is highly affected by strain of the films on the substrate, mechanical stress and thickness limitation [6], which can strongly influence the crystallographic structure [7], and the direction of the easy axis of magnetization [8]. Decreasing the Ho film thickness suppresses spin structure, which are becoming energetically unfavorable in thin films [6]. All mentioned above spin transitions can be used to develop magnetocaloric effect (MCE). Special attention will be focused to magnetic anisotropy of spin structures and tuning of the favorable field orientation to maximize the MCE. Therefore, our
work is aimed to study the anisotropy of MCE in MgO/W/Ho/W multilayer structure, with Ho grown along the c-axis (0002) with a thickness of 400 nm intermediate to bulk and thin film limit. The thickness was chosen to conserve presence of all known spin phases. From the evolution of M as a function of H for temperatures between 60 – 100 K we could calculate two significant variations of the magnetic part of entropy: one for TN =
133 K and for the other T = 90 K. We will show that at these particular temperatures the entropy changes strongly dependent on the field orientation. At a magnetic phase transition (for example at Tc), the magnetization strongly varies in a narrow temperature
range i.e. the value of ∂M/∂T is large. In theory first-order phase transition occurs at a fixed transition temperature, Tc and, thus,
(|(∂M/∂T)H|) value should be infinitely large. For example, giant magnetocaloric effect (GMCE) is associated with a first-order transition provided by a strong spin-lattice interaction [9, 10]. In the case of second-order magnetic phase transitions, the presence of short-range order and spin fluctuations above the ordering temperature leads to a decrease in the maximum possible value of (|(∂M/∂T)H|) and МСE [11, 12]. Under the assumption that the metal goes from a completely disordered paramagnetic state to a fully ordered magnetic state in the temperature range considered, the magnetic entropy variation, during that particular transition, ∆SM depends on multiplicity 2J+1 where J is the total angular
momentum and is given by:
(1), Where R is the universal gas constant. As Ho, exhibits the largest
J value of all the rare-earth elements, it is a natural candidate to
study MCE. The theoretical value of the saturation moment in Bohr magnetons/atom is given by gJ (where g = 5/4, J = 8, and gJ = 10 μB/atom). For rare earth elements, such as Ho, crystal
2 ion anisotropy. This greatly reduces the entropy from the value estimated by expression (1). The experimental value of magnetic moment strongly depends on structure of Ho and crystallographic orientations. Due to the fact that Ho exhibits various magnetic phase transitions in the (H,T) space, one can expect that the MCE can be maximum at those particular transition temperatures [1-8]. Several studies have reported various spin structures in crystalline bulk Ho (see Fig. S1 in Supplementary material [13]) [14, 15]. However, the MCE in Ho films is practically not analyzed in the literature.
II. EXPERIMENTAL TECHNIQUE AND SAMPLES
Using magnetron sputtering technique, we deposited 400 nm thick Ho thin film on single crystalline MgO substrates with an intermediate buffer layer of tungsten W. Deposition of W onto MgO (100) first yields W(100) growth which sets an epitaxial growth in Ho with its c-axis (0002) normal to the sample plane. In [17] high crystallinity of the epitaxial films was confirmed by very narrow rocking curves peaks with the full width at half maximum
2 indicative of a high degree of crystalline orientation. We used the samples grown in the same machine with the same growth protocol. A 5 nm thick W film was used to protect the Ho film from oxidation. Prior to deposition of the films, the substrate was baked at 800 °C for 45 min, and then at 700 °C for 30 min after which a 10 nm thick W film was deposited at the same temperature. Subsequently, the specimen was cooled to room temperature where a 400 nm thick Ho film was deposited, and further annealed at 500 0C from 45 mins to ensure a crystalline growth in Ho. The sample was then capped with a 5 nm thick W layer while cooling to room temperature. Similar epitaxial growth of Ho film on W substrate was achieved by Wescke et al. [16]. The Ho film with a thickness of 400 nm corresponds to ~ 60 periods of spin-helix rotation (each period is 12 lattice parameters 5.6 Å along c axis) in the bulk Ho. Thus, the thickness exceeds the spin–structure period and allows one to find effect of the mechanical stresses on known transitions. A study based on neutron diffraction technique has shown that even 100 nm films do not correspond to bulk properties and still convenient to study periodicity of spin helix and other incommensurate spin structures [18].
Several techniques were used to characterize the heterostructure: X-Ray Diffraction (XRD) for structural analysis, X-ray photoelectron spectroscopy (XPS) for surface investigations and energy dispersive X-ray (EDX) spectroscopy for layer-by layer analysis. Structural analysis was performed by a Bruker X-ray diffractometer providing 2θ-scanning under CuKα1
-irradiation. Scanning step was 0.02. The chemical composition of subsurface layers of the films was determined by X-ray photoelectron Specs Phoibos HSA 3500 spectrometer in 10–9 mbar vacuum. Local chemical composition determined by energy dispersive analysis as well as images of surface were recorded by a SUPRA 25 Zeiss electron microscope with different accelerating voltages. Magnetization as an H and T were recorded using MPMS XL Quantum Design SQUID magnetometer in the range of T = 2-300 K for external magnetic applied along “in-plane” and
“out-of-plane” orientations. In the vicinity of phase transitions, isothermal M(H) curves were measured at a fixed cryostat temperature for ranging between 60 - 150 K with a 5 K step.
III. RESULTS AND DISCUSSION
A. Structural and chemical analysis of the sample
The XRD spectrum of the analyzed film and simulated spectrum of single crystal Ho are shown in Fig. 1(a) and 1(b), respectively. The MgO and W peaks, the Ho(002) and (004) reflections are observed indicating c-axis growth. Holmium lattice corresponds to P63/mmc space group, hexagonal close-packed structure with cell parameters: a = 3.5773 Å, b = 3.5773 Å, c = 5.6158 Å. X-ray diffraction results for Ho grown onto MgO(111) substrates with W(110) buffer layers (Fig.1 (a)). Dominating intensity of narrow Ho(002) peak, positions of the (002) and (004) peaks coinciding with ones recorded in [17] verify single crystallinity of the film used in our experiments. The spectrum in Fig.(1a) is rather different from ones recorded for nanocristalline and coarse-grain Ho films [19] and theoretically calculated Ho powder spectrum (Fig.(1b)) [20]. Theoretical calculation of spectrum in Fig. 1b was fulfilled by Crystallography Open Database [20]. Powder patterns were obtained for hexagonal lattice space group P63/mmc with atomic coordinates in elementary cell х = 0.333, у = 0.667, z = 0.250. Full description including references and CIF file is presented in [20]. Plot of the spectrum in Figure 1b was performed by Match software downloading data from Crystallography Open Database [20].
Clearly it seen the presence of a mechanical stress in the Ho films as shift of the positions of Ho(002) and (004) peaks in comparison with its positions in the simulated XRD spectrum (Fig.(1b)) and insertion in Fig.(1a). The full width at half maximum 1 was even smaller, that in [17] indicating a high degree of crystalline orientation.
FIG.1. (a) X-ray diffraction spectrum measured in MgO/W(10 nm)/Ho(400 nm)/W(5 nm) sample, (b) simulation of Ho powder X-ray spectra obtained using Crystallography Open Database [20]. Vertical dashed lines indicate positions of the Ho(002) and (004) reflections in simulated spectrum. Shift of the Ho(002) line from calculated position is shown in insertion.
Probably this indicates a mechanical stress, which can affect critical temperatures at which the spin transitions are observed as
well as the MCE in epitaxial films in comparison with the bulk systems [21].
With the aid of surface sensitive XPS analysis we verified the electronic states of Ho and its possible oxidization and presence of the declared chemical elements (see Fig. S2 in the Supplementary material [13]). The XPS spectrum shown in Fig.
S2(а) in the Supplementary material [13] demonstrates a presence of W and Ho main elements in sample. The O and C peaks has no relation to the sample and correspond to unavoidable impurities in spectrometer. In the insertion in the Fig. S2(а) in the Supplementary material [13], the peak at Ев= 159.6 eV corresponds to 4d electronic level of Ho3+ ion in f10(5I8) ground
state. One can conclude the absence of the oxygen and carbon in Ho layer. Zoomed spectrum of W 4d-core level is presented in Fig. S2(b) in the Supplementary material [13]). Presence of the pure W as well as its oxidation was confirmed by few O 1s peaks see insertion in Fig. S2(b) Supplementary material [13]. Magnesium oxide was not detected due to lower penetration depth (~ 5 -7 nm) of X-ray.
Layer by layer chemical analysis of the sample was performed by EDX spectroscopy, and the measured spectrum is shown in Fig. S3(a) Supplementary material [13]. The EDX spectrum was collected in the area marked by pink rectangle in the inset of Fig. S3(a). Clearly, the spectrum indicates the presence of W, Ho, Mg, O, C elements similarly with XPS technique (Fig.
S3(a)). The EDX technique with different accelerating voltage made it possible to estimate the percentage ratio of chemical elements dependently on the beam penetration depth peaks Sketch of experiments is shown on the Supplementary material [13], insertion in Fig. S3(b)). Since analyzing sample has multilayered structure, the estimation was complicated by back scattering in interfaces and depends film thickness at low accelerating voltages. We used enhanced voltage 7 - 25 keV to reach all layers of the sample (Fig. S3(b)). We plotted depth distribution of the chemical elements based on calculated R values (Fig. S3(b)). We applied Bethe formula and Kanaya-Okayama expression [22] to calculate penetration depth of electrons R as function of their energy E. Presence of the chemical elements in corresponded layers was verified. We can see approximate EDX determined values of the Ho thicknesses ~ 400 nm which is in good agreement with estimations of thickness by deposition time (see Fig. S3(c) in the Supplementary material [13].
B. Orientation and temperature dependence of
hysteresis loops
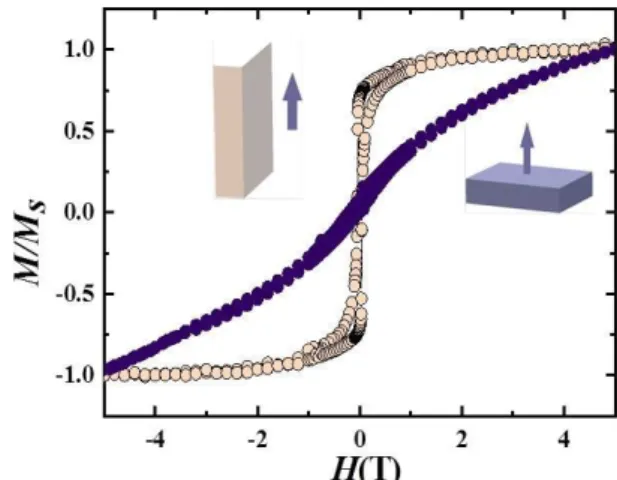
Figure 2 shows two magnetic hysteresis loops for the in-plane and out-of-in-plane orientations of the applied magnetic field at 2 K are presented. When the field is applied in the plane of the sample, the hysteresis loop has a rectangular shape with Mr/Ms =
0.78, where Mr is the remnant magnetic moment, Ms is saturation
magnetic moment. In the out-of-plane orientation, М(Н) shows almost no hysteresis and Mr/Ms = 0.1. Detailed magnetic
hysteresis loop of the MgO/W/Ho(400 nm)/W structure for in-plane orientations is shown in Fig. 3. The shape of the M(H) curve changes as temperature of the sample is varied. In a temperature
range of 70-100 K, magnetization jumps appeared in М(Н) curves due to spin transitions (Fig. 3).
FIG.2. Normalized magnetization (M/Ms) as a function of H curves for in-plane (beige) and out-of-plane (violet) applied field orientations measured at 2 K are shown. Directions of the applied magnetic field are shown in the insets.
-4 -2 0 2 4 -1.9 0.0 1.9 -1.7 0.0 1.7 -1.2 0.0 1.2 -4 -2 0 2 4 -1.2 0.0 1.2
H
CFS FAN HELIFAN HELIX(d)
(c)
(b)
(a)
90 K
70 K
M
(
10
-4emu
)
FERRO-FAN100 K
130 K
H (T)
FIG.3. Magnetization as a function of the applied magnetic field measured in MgO/W/Ho(400 nm)/W sample at different temperature: 70 K (a), 90 K (b), 100 K (c) and 130 K (d). Note that the loops are measured in the in-plane orientation. Schematic
4 spin directions in the atomic layers corresponding to the spin phases are shown at the bottom.
Well known magnetic phases (ferrofan, helix, helifan, fan) are marked by colors in Fig. 3 and their corresponding schematics are presented in the bottom panel of Fig. 3. Above TN, the sample
takes a transition into the paramagnetic phase and this behavior is clearly evident from Fig. 3(d). In Figs. 3(a)-3(c), the in the magnetization correspond to a transition into a helifan phase.
An increase in the temperature causes widening of the helical phase region in H. Upper border of the helix phase with critical field switching HCFS, shifts from HCFS = 1.57 Т at 70 K up
to HCFS = 2.04 Т at 100 K (see Figs. 3 (a)-(c)). Simultaneously
field ranges corresponding to the ferro-fan (violet), helifan (green) and fan (pink) rapidly decrease with an increase in the temperature. Finally, all magnetically ordered phases disappear and field dependencies transforms to the straight line near TN (Fig.
3(d)). In the paramagnetic phase, the slope of the M(H) straight line (Fig. 3 (d)) characterizes magnetic moment of the single Ho atom calculated by formula μ (8T)1/2 = 10 μB normally relating
to an individual Ho ion.
C. Anisotropy of the evolution of the magnetic
moment as a function of temperature
Temperature dependencies of the magnetic moment under the influence of external magnetic field applied in-plane and out-of-plane are shown in Fig. 4(а) and Fig. 4(b), respectively.
FIG.4. Magnetic moment as a function of temperature recorded under 100 Oe applied magnetic field in FC, ZFC modes for both in–plane applied field (a) and out-of-plane applied field (b) orientations. The temperature dependencies of the reciprocal magnetic susceptibility 1/(T) are shown in the insets for both in– plane (a) and out-of-plane (b) orientations. Red line is approximation by Curie-Weiss low. Known spin reorientation transitions (ferrofan, helix, helifan, fan and spin-slip) at correspondent temperatures are indicated by arrows.
Two types of the temperature dependencies M(T) are recorded for each orientation: 1) FC (Field Cooling) corresponds to the measurement of magnetic moment during sample heating in low magnetic field 100 Oe after a sample cooling in a strong 5 T field 2) ZFC (Zero Field Cooling) corresponds measurement of magnetic moment during sample heating in magnetic field 100 Oe after the cooling of sample in zero field.
The divergence of the ZFC curves at low temperature below 20-25 K corresponds to a first order phase transition (Fig. S 5 b) in agreement with previous investigations in literature [8]. Temperature of the magnetic ordering (transition between paramagnetic and helix phases) TN ≈ 130 K was determined as a
maximum on М(Т) dependencies for the field in-plane and out-of-plane orientations (see Fig. 4(b)).These features are clearly seen in derivative plots dМ/dT(Т) ( see Fig. S4(b) in the Supplementary material[13]).
Reciprocal magnetic susceptibilities 1/χ = 1/(dM/dH) for in-plane and out-of-plane applied field orientations are shown in the insets of Fig.4 in order to show the transitions at 130 K (paramagnet - helix), 110 K (helix - fan), 70 K (fan – ferrofan or fan-helifan) and low temperature transition at 23 K (ferrofan-cone) are shown by vertical arrows. We plotted high temperature tangent straight line intersecting on to the horizontal axis at T = 130 K to determine the Weiss temperature, Θ = 130 K coinciding well with the critical temperature of the paramagnet-helix transition.
The value of the MCE strongly depends on the measurement procedure of the isothermal M(H) curves [23]. Driving the sample through the phase transition in a mixed-phase state or stable state leads to a different value of MCE [23]. For instance, in this case, when the sample is abruptly cooled down to a lower temperature by 5 K or when heated to room temperature before next measurement the values of M(H), and MCE differ by about 8 times [23]. In our experiment, the stepwise cooling was used before recording of the isothermal magnetization curves. A magnetic field of 5 T was applied from a temperature of 60 K to a temperature of 150 K by 5 K step increments in the in-plane and out-of-plane orientations (Fig. 5 a, b). The sample orientation was strictly fixed during recording of each set of M(H) curves. Sample was not removed from magnetometer within the series of measurements (Fig. 5 a, b). Rotation of the sample in ab plane from orientation H║a to orientation H║b does not change field dependence M(H) (see Figure S5 in the Supplementary material [13]), i.e. magnetization in ab plane is isotropic. Thus, anisotropy in ab plane is rather similar with XY-like model, than Ising model. In order to subtract the demagnetization field 4Ms = 1.7 kOe
corrected for the demagnetizing factor N = 1 [24] (see Fig.S6 in the Supplementary material [13]), while no corrections were needed for in-plane M(H) curves. The isothermal magnetization
M(H) curves are shown for in-plane and out-of-plane orientations
in Fig. 5(a) and Fig. 5(b), respectively for various temperatures of the sample in the range of 60 – 150 K.
In the in-plane orientation, the linear M(H) dependence above 130 K gradually transforms into a stepwise curve at 130 K (see Fig. 5(а)). In the out-of-plane orientation, change of the curve shape occurs at 70 K (see Fig. 5(b)). Difference between the observed in-plane and out-of-plane critical temperatures can obviously be explained by correspondent phase transitions at 130 K and 70 K.
The comparison between the critical transitions temperatures in W/Ho(0002)/W film and Ho single crystal b-axis [8] is shown in Fig. S7 in the Supplementary material [13] on temperature dependencies of reciprocal magnetic susceptibilities 1/.
In order to characterize the type of transitions we observed in our experiment, we plotted Arrott curves M2(H/M), in the 60 -
150 K temperature range.
FIG.5. Magnetization as a function of the magnetic field for various temperatures. The field is applied (a) in-plane and (b) out-of-plane orientations. The curves are presented after performing the correction due to demagnetizing field.
Arrott technique is based on Weiss molecular field theory assuming a proportionality between the intrinsic magnetic field of the ferromagnet and its magnetization [25, 26]. According to Ginzburg-Landau mean field theory [25], the free energy of a ferromagnetic in the vicinity of phase (spin) transition can be expressed as:
(2) Where HM is the Zeeman energy, the second and the third terms correspond to magnetization dependent intrinsic energies. In general, Arrott plot is based on Arrott–Noakes equation [26]:
(3) Where γ and β are the critical parameters associated with magnetic susceptibility and saturation magnetization, respectively. To apply Arrott analysis, the material should be magnetically homogeneous, i.e. the spin correlation length should be large enough in comparison with the range of structural inhomogeneity. In the frame of the mean field model, exponents β = 0.5, γ = 1.0 give straightening of the M(H) curves around ТС corresponding to
the long-range magnetic ordering, i.e. mean field model gives straight lines in М2 on Н/М coordinates. The curve slope = (T-Tc)/Tc determines critical temperatures. The straight line crossing
М2 axis at < 0 corresponds to the temperature higher than the
critical temperature, while the straight line crossing the H/M axis (at > 0) lies in temperature range below Tc. The line directed to
zero point at H = 0 corresponds to critical temperature. Positive
M2(H/M) slope indicates a second order transition, while negative slope corresponds to first order transition [26, 27]. The Arrott plots in M2 vs H/M “mean-field” axis are presented in Fig. 6(a).
Clearly, the curves are non-linear. Since the narrow lines in the X-ray spectrum (see Fig. 1) confirm single crystalline structure of the film, curvature of the lines in Arrott plot cannot be explained by film structural inhomogeneity, which correlation length is shorter than magnetic correlation length. The values β = 0.5 and γ = 1 in Fig.6a should correspond to a linear trend in
M2(H/M) coordinates in the mean-field model describing classical collinear ferromagnet. The obvious failure of the mean field model is probably due to non collinear spin structure in Ho, in contrast with simple collinear ferromagnet. Mean field theory does not describe helical or spiral spin ordering.
Convenient treatments based on 3D-Heisenberg, 3D-Ising, Tricritical models should be applied. In MnSi [28], FeGe [29], Cr1/3NbS2 [30] chiral magnets, 3D Heisenberg model implying
modified β and γ values gives nice straightening of the Arrott curves. The Arrott plot is valid in the mentioned above non collinear chiral ferromagnets at the convenient parameter values, because spin Hamiltonian includes all components of exchange interaction, including asymmetric components.
The problem of Arrott plot interpretation in Ho is multiple spin transitions following one by another in temperature scale. The absence of the parallel lines in Fig.6a is also due to few transitions in studied temperature range. Change of the slope in the M2(H/M) coordinates reveals change of spin configuration.
6 The Arrott plot in Fig.6a overlaps at least two transitions between three spin configurations. The dashed lines in Fig.6a separate areas with different slopes. These lines are the borders separating helifan/helix and spin-slip/helix transitions. For that reason, one should analyze upper and bottom parts of the Arrott plot separately. We selected the narrow 70 - 120 K range and the 3D- Heisenberg parameters β = 0.365 and γ = 1.336 [13] providing good straightening of the curves in Arrott plot (Fig. 6b). The Arrott plot in other coordinates corresponding to 3D-Ising and Tricritical models are shown in Fig. S8 in the Supplementary material, as well as comparison with mean field model (Fig. S8 a), inconvenient for our system. All three models considering x, y, z spin projections (Fig. S8 b, c, d) give straightening at the expected
β and γ values, in contrast with the mean field model (Fig. S8 a). In this part of Arrott plot, all curves can be presented as straight parallel lines indicating a second order spin transition between 70 -120 K. This temperature range corresponds probably to helifan/helix spin transition. Thus, fragmentary analysis of the Arrot plot allowed us to distinguish spin transition resolved in 1/plot and determine the type of the transition.
FIG.6. (a) Arrott plots M2(H/M) for the mean field β = 0.5 and
γ = 1 parameters. The lines 1 and 2 are borders of the helifan-helix
and spin-slip - helix transitions. Direction of the temperature change is shown by the black arrow. (b) The Arrott plot corresponding to Heisenberg model in selected temperature range possessing single phase transition at 50 K. (c) Temperature dependences of the normalized relative slopes RS = S(T)/S(TC)
for Mean field, 3D-Heisenberg, 3D-Ising and Tricritical models. The normalized relative slope RS = S(T)/S(TC) identifies
the most suitable model by comparing experimental RS value with the idealized value “1”, as it was determined for the chiral FeGe alloy [29]. Plots of RS vs T for the four different models are shown in Fig. 6c. One can see that the RS of Heisenberg, 3D-Ising and Tricritical models models are close to ‘1’, while that of the Mean field model is far from ‘1’ above 90 K. This result indicates that the critical behavior of Ho may not belong to a single universality class. Although, mean field coordinates do not result in correct Arrott plot, they give correct value of the early known paramagnet-helix spin transition at 132 K (shown by arrow), where the negative slope changes to positive slope (Fig. 6 a).
D. Change of magnetic part of entropy
accompanying spin transitions
The basic principal determining entropy calculation is Maxwell’s equation connecting changes of entropy and magnetic moment [31]:
(4)
The Maxwell’s equation (4) refers to the total entropy S including phonon, electronic and magnetic parts. In a first order transition S, V and M are discontinuous and the Maxwell equation collapses into Clausius-Clapeyron equation:
S/M = - dH/dT (5)
which is rigorously valid to calculate change of magnetic part of the entropy SM, if temperature hysteresis is absent [31]. In
Ho crystal no structural transitions were observed in 2-300 K range. In contrast with the shape memory Heusler alloys, described in [31], Ho crystal does not manifest strong contribution of magneto-elastic energy. First order transitions can be observed at low temperatures ~ 2 K [32]. Temperature range analyzing in our experiments is free of first order transitions [32]. Thus, one can conclude validity of the Eqn. (5) to determine magnetic part of the entropy. Series of the isothermal magnetization curves corrected by the determined demagnetizing factor (Fig. S5) were used to calculate magnetic part of entropy SM and its variation ΔSM
(H, T), caused by spin-reorientation transitions (Fig. 7).
The expression for calculation of magnetic part of the entropy can be obtained from (5):
(6) Since temperature and magnetic field were discretely changed in our experiments, Eqn.(6) can be rewritten, as given below, as a sum of several discrete contributions:
(7)
Мi (Ti, H) is the magnetic moment at temperature Ti,
corresponding to i-th field dependence, Мi+1 (Ti+1, H) is the
magnetic moment at temperature Ti+1 corresponding to
neighboring i+1-th field dependence (Fig. 5). Plots of ΔSM (H, T)
dependences calculated for the in-plane and out-of-plane field orientations are shown in Fig. 7(a) and Fig. 7(b), respectively.
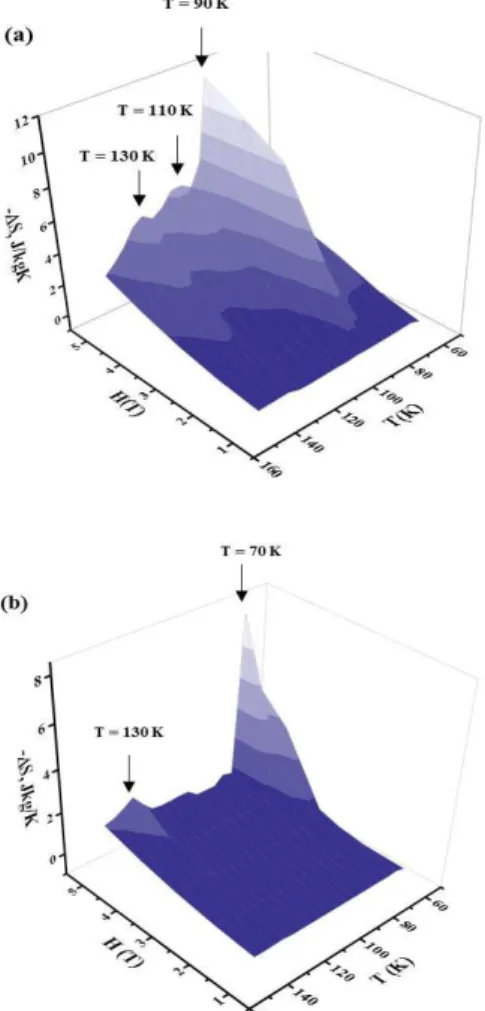
FIG.7. Change of magnetic entropy ΔSM in the in- plane (a)
and out-of-plane (b) orientations.
Figure 7 shows the magnetic entropy change obtained from isothermal field dependencies of the magnetization M(H) by applying Eqn.(7). Maximal entropy change -ΔSM =11.8 J/kgK was
observed at 90 K for in–plane applied field orientation (Fig. 7(а)) and - ΔSM = 8.2 J/kgK at 70 K for out-of-plane applied field
orientation (Fig. 7(b)) under 5 T magnetic field. Expected maximum of the ΔSM(T) dependence at TN = 130 K corresponding
to helix-paramagnet transition has a same position for both the perpendicular and the parallel field orientations. Maximal change of the entropy -ΔSM does not exceed 5 J/kgK for in-plane
orientation and 2 J/kgK for perpendicular orientation at TN = 130
K.
Thus, spin-reorientation transitions at 90 K at 5 T and transition at 70 K demonstrate that the observed MCE is quite significant even when compared to the one measured for paramagnet-helix spin transition. This fact attracts interest to Ho film in intermediate temperature region 70 - 110 K.
E. Anisotropy of the H-T phase diagram
Spin-reorientation transitions in Ho are mainly driven by magneto-crystalline anisotropy caused by mixing of electron levels of Ho3+ ions depending on crystallography orientation [33]. The magneto-crystalline single axis anisotropy of Ho is very high (K1 = –1.45 x 10⁸ erg/cm3) due to the orbital wave function of Ho,
with high L = 6 orbital moment sensitive to the crystal field of other atoms. Anisotropy in the phase diagram results of the large magneto-crystalline anisotropy energy which is comparable with the exchange energy [34]. Holmium exhibits very high ellipsoidal magnetostriction with maximal value of 2500 ppm along c axis at 4 K [34]. In our work, we observe strong difference in MCE and other magnetic properties between magnetic fields applied parallel and perpendicular to the c-axis. The summarized magnetic phase diagrams of our sample for those two orientations are shown in Fig. 8.
FIG.8. Magnetic phase diagram of W/Ho/W/MgO sample for in-plane (a), out-of-plane (b) field orientations. The lines 1 and 2 correspond to helifan-helix and spin-slip-helix transitions.
According to [8] helical phase transforms to fan at Т = 70 K with out-of-plane magnetic field, while helicoidal structure transforms to helifan state at Т = 90 K under the influence of magnetic field applied in the plane of the sample. Since the H(M,
8 difference between the two orientations cannot be explained by shape anisotropy and is related to the magneto-crystalline anisotropy of Ho in the stress extended film.
Anisotropy of the MCE was early observed in many alloys [35-40]. It has been reported [35], that −ΔSM changes under
rotating the sample in the applied magnetic field. It has been shown in Ref. [36] that the entropy change is two times larger for
H//[110], than for H//[100] field direction.
An increase of −ΔSM with a change in the direction
magnetic field orientation was found in Fe3−x GeTe2 [37]. The
periodicity of angular dependence of the MCE was found in [38,
39]. Giant anisotropy of magnetocaloric effect in TbMnO3 single
crystals between different axes was found [40]. These findings relate to the first order transitions near the Curie point. However, the results presented in this paper for the case of Ho film demonstrate similar anisotropic MCE due to second order spin-reorientation transitions.
For practical applications of the MCE require materials with higher value for relative cooling power (RCP) as well as for entropy (see Fig. S9 in the Supplementary material [13]). In order to verify this, we have calculated the RCP values that depend on
ΔSM as well as on shape of the ΔSM (T) curve.
The calculations are done by the formula RCP = -ΔSM
δTFWHM, where δTFWHM is Full Width at Half Maxima of the -ΔSM
(T) curve [41]. The RCP value for in-plane field orientation are two times higher than for out-of-plane orientation (see Fig. S9 in Supplementary material [13]). Relative RCP cooling power in MgO/W/Ho (400 nm)/W films at 5 T reaches 120 TJ/kgK for in-plane and 60 TJ/kgK for perpendicular orientation of the applied magnetic field.
IV. CONCLUSIONS
The magnetocaloric effect in the multilayer MgO/W/Ho(400nm)/W structure of (0002) Ho orientation has been investigated near the spin reorientation tempertures. Under in plane applied magnetic field the magnetocaloric effect, observed at 130 K is 2.5 times greater than that observed for the case when field was applied out-of-plane. With the sample magnetization oriented parallel to the external magnetic field, the transition between metastable magnetic structures from helix to helifan at T = 90 K results in entropy change ∆SM = -11.8 J/kgK in a field of 4
T. In a perpendicular magnetic field orientation, the maximum ∆SM shifts to low temperature region. At T = 70 K, the maximum
change in entropy is ∆SM = - 8.2 J/kgK, which can be explained by
the transition of the helix structure to fan one. Remarkable change of the helifan and fan areas in H-T diagram due to orientation allows one to choose in-plane orientation of field to reach the highest change of dM/dT value at easy accessible field ~ 1 T and temperature ~ 100 K. We also verified borders separating helifan/helix and spin-slip/helix transitions in Arrot plot.
Furthermore, we have shown that the relative RCP cooling power in MgO/W/Ho (400 nm)/W films at 5 T reaches 120 TJ/kgK for in-plane and 60 TJ/kgK for perpendicular orientation of the applied magnetic field. The anisotropy dependent magnetocaloric effect in holmium opens up new possibilities for controlling and optimizing the magnetocaloric effect in thin magnetic films.
ACKNOWLEDGMENTS
We acknowledge funding from the Ministry of Science
and Higher Education of
the Russian Federation (Grant No. 13.1902.21.0006). R. M. was supported by «Project for enhancing of competitiveness of leading Russian universities among leading research and educational centres (5–100)».
REFERENCES
1. T. Chatterji Neutron scattering from magnetic materials,
Chapter 2: Magnetic Structures (Elsevier, 2006).
https://doi.org/10.1016/B978-044451050-1/50003-3
2. W.C. Koehler, J. W. Cable, H. R. Child, M. K. Wilkinson, and E. O. Wollan, Phys. Rev. 158, 450 (1967).
https://doi.org/10.1103/PhysRev.158.450
3. N. Ali, F. Willis, M. O. Steinitz, M. Kahrizi, and D. A. Tindall, Phys. Rev. B 40, 11414 (1989). https://doi.org/10.1103/PhysRevB.40.11414
4. D.A. Tindall, M. O. Steinitz, and M. L. Plumer, Phys. F: Metal. Phys. 7, L263 (1977). https://doi.org/10.1088/0305-4608/7/9/005
5. J. Bohr, D. Gibbs, D. E. Moncton, and K. L. D'Amico, Phys. A 140, 349 (1986). https://doi.org/10.1016/0378-4371(86)90241-4
6. L. J. Rodrigues, V. D. Mello, D. H. A. L. Anselmo, and M. S. Vasconcelos, J. Magn. Magn. Mat. 377, 24 (2015).
https://doi.org/10.1016/j.jmmm.2014.10.027
7. R. A. Cowley, P. M. Gehring, D. Gibbs, J. P. Goff, B. Lake, C. F. Majkrzak, A. Vigliante, R. C. C. Ward, and M. R. Wells,
J. Phys.: Cond. Mat. 10, 6803 (1998).
https://doi.org/10.1088/0953-8984/10/30/018
8. V. I. Zverev, A. M. Tishin, Z. Min, Y. Mudryk, K. A. Gschneidner Jr, and V. K. Pecharsky, J. Phys.: Condens.Mat.
27, 146002 (2015).
https://doi.org/10.1088/0953-8984/27/14/146002
9. H. N. Bez, A. K. Pathak, A. Biswas, N. Zarkevich,V. Balema, Y. Mudryk, D. D. Johnson, and V. K. Pecharsky, Acta Mat.
173, 225 (2019).
https://doi.org/10.1016/j.actamat.2019.05.004
10. J. Liu, T. Gottschall, K. P. Skokov, J. D. Moore, and O. Gutfleisch, Nature Mat. 11, 620 (2012).
https://doi.org/10.1038/nmat3334
11. I. D. Rodionov, D. E. Mettus, A. P. Kazakov, M. V. Prudnikova, V. N. Prudnikov, I. S. Dubenko, and A. B. Granovsky, Phys. of the Sol. St. 55, 1861 (2013).
https://doi.org/10.1134/S1063783413090266
12. T. D.Thanh, D. C. Linh,P. D. H. Yen,L. V. Bau,V. H. Ky,Z. Wang, H.G. Piao, N. M. An, and S.C. Yu, Phys. B: Condens.
Matt. 532, 166 (2018).
https://doi.org/10.1016/j.physb.2017.03.031
13. See Supplemental Material at http://link.aps.org/supplemental/
for MS Word file containing sketches of the sample structure and Ho magnetic structures, XPS spectra and sketch of determined X-ray penetration depths, EDX spectrum, fragments of Arrott plots within field ranges corresponding to the single magnetic phase, magnetic hysteresis, FC-ZFC curves and reciprocal susceptibility temperature plot for two
orientations, demonstration of demagnetizing field effect, field dependence of RCP factor and correspondent captions for all mentioned figures.
14. D. L. Strandburg, S. Legvold, and F. H. Spedding, Phys.
Rev. 127, 2046
(1962). https://doi.org/10.1103/PhysRev.127.2046
15. J. Bohr, D. Gibbs, D.E.Moncton, and K.L.D'Amico, Phys. A,
140 349 (1986). https://doi.org/10.1016/0378-4371(86)90241-4
16. C.Schüßler-Langeheinea, E.Weschke, A.Yu.Grigoriev, H.Ott, R.Meier, D.V.Vyalikh, C. Mazumdar, C.Sutter, D.Abernathy, G.Grübel, and G.Kaindl, J. Electron Spectroscopy and Related Phen. 114–116, 953 (2001). https://doi.org/10.1016/S0368-2048(00)00318-2
17. E. E. Fullerton, C. H. Sowers, J. P. Pearson, X. Z. Wu, D. Lederman, S. D. Bader, Structure and magnetism of epitaxial
rare-earth-transition-metal films in Magnetic Hysteresis in
Novel Magnetic Materials, Ed.: G.C. Hadjipanayis, (Kluwer Academic Press, Netherlands, 1997), pp. 467-478.
https://www.osti.gov/servlets/purl/390625
18. V. Leiner, D. Labergerie, R. Siebrecht, Ch. Sutter, and H. Zabel, Phys. B 283, 167 (2000).
https://doi.org/10.1016/S0921-4526(99)01923-7
19. P.Szary, D. Kaiser, J.Bick, D. Lott, A.Heinemann, C.Dewhurst, R. Birringer and A. Michels, J. Appl. Cryst. 49, 533 (2016). http://dx.doi.org/10.1107/S1600576716001898 20. Crystallography Open Database
https://www.crystallography.net/cod/9008502.html
21. V. Tarnavich, A. Volegov, D. Lott, S. Mattauch, A. Vorobiev, A. Oleshkevych, and S. Grigoriev, J. Surf. Invest. 8, 976
(2014). https://doi.org/10.1134/S1027451014050425
22. K. Kanaya, S. Okayama, Penetration and energy-loss theory of electrons in solid targets, Physics D: Applied Physics, 5 (1972), pp. 43−58. https://doi.org/10.1088/0022-3727/5/1/308
23. M. Bratko, K. Morrison, A. de Campos, S. Gama, L. F. Cohen, and K.G. Sandeman, Appl. Phys. Lett. 100, 252409
(2012). https://doi.org/10.1063/1.4729893
24. D. X. Chen, E. Pardo, and A. Sanchez, IEEE Trans. Magn. 38, 1742 (2002). https://doi.org/10.1109/TMAG.2002.1017766
25. S. Chikadzumi, Ed. C. D Jr. Graham Physics of
ferromagnetism (Clarendon, Oxford 1997).
https://global.oup.com/academic/product/physics-of-ferromagnetism-9780198517764?cc=ru&lang=en&#
26. I. Yeung, R. M. Roshko, and G. Williams, Phys. Rev. B 34, 3456 (1986). https://doi.org/10.1103/PhysRevB.34.3456 27. B. K. Banerjee, Phys. Lett. 12, 16 (1964).
https://doi.org/10.1016/0031-9163(64)91158-8
28. M. K. Chattopadhyay, P. Arora and S. B. Roy, J. Phys.: Condens. Matter, 21, 296003 (2009). https://doi.org/10.1088/0953-8984/21/29/296003
29. L. Zhang, H.Han, M. Ge, H. Du, C. Jin, W. Wei, J. Fan, C. Zhang, L. Pi & Y. Zhang, Scientific Reports, 6, 22397(2016).
https://doi.org/10.1038/srep22397
30. E. M. Clements, R. Das, L. Li, P. J. Lampen-Kelley, M.Phan, V. Keppens, D. Mandrus & H.Srikanth, Scientific Reports, 7, 6545 (2017). https://doi.org/10.1038/s41598-017-06728-5
31. A. Planes, L.Manosa and M. Acet, J. Phys.: Condens. Matter 21, 233201 (2009). https://doi.org/10.1088/0953-8984/21/23/233201
32. M. L. Plumer, Phys. Rev. B 44, 12376 (1991). https://doi.org/10.1103/PhysRevB.44.12376
33. H. Ohsumi, J. Phys. Soc. Jpn. 71, 1732 (2002).
https://doi.org/10.1143/JPSJ.71.1732
34. J. J. Rhyne, S. Foner, E. J. McNiff Jr., and R. Doclo, J. Appl. Phys. 39, 892 (1968). https://doi.org/10.1063/1.1656324
35. Yu Liu, and C. Petrovic, Phys. Rev. B 97, 174418 (2018)
https://doi.org/10.1103/PhysRevB.97.174418
36. D.X.Li, S.Nimori, and T.Shikama, Solid State Comm. 150, 1865 (2010). https://doi.org/10.1016/j.ssc.2010.07.049
37. Yu Liu, J. Li, J. Tao, Y. Zhu, and C.R. Petrovic, Sci. Rep. 9, 13233 (2019). https://doi.org/10.1038/s41598-019-49654-4
38. V. I. Ivanovskii, and P. P. Denisov, Sov. Phys. Journ. 9, 88
(1966). https://doi.org/10.1007/BF00818749
39. K. P. Skokov, Y. G. Pastushenkov, S. A. Nikitin, M. Fries, and O. Gutfleisch, IEEE Trans. Magn. 52, 1 (2016). http://dx.doi.org/10.1109/TMAG.2016.2530138
40. J.Y. Moon, M.K. Kim, D.G. Oh, J.H., Kim H.J. Shin, Y.J. Choi, and N. Lee. Phys. Rev. B. 98, 174424
(2018). https://doi.org/10.1103/PhysRevB.98.174424 41. K. A. Gschneidner, V. K. Pecharsky, and A. O. Tsokol, Rep.
Prog. Phys. 68, 1479 (2005). https://doi.org/10.1088/0034-4885/68/6/R04