HAL Id: inserm-01187368
https://www.hal.inserm.fr/inserm-01187368
Submitted on 26 Aug 2015
HAL is a multi-disciplinary open access
archive for the deposit and dissemination of
sci-entific research documents, whether they are
pub-lished or not. The documents may come from
teaching and research institutions in France or
abroad, or from public or private research centers.
L’archive ouverte pluridisciplinaire HAL, est
destinée au dépôt et à la diffusion de documents
scientifiques de niveau recherche, publiés ou non,
émanant des établissements d’enseignement et de
recherche français ou étrangers, des laboratoires
publics ou privés.
Patient-physician agreement on tobacco and alcohol
consumption: a multilevel analysis of GPs’
characteristics.
Jean-Laurent Thebault, Hector Falcoff, Madeleine Favre, Frédérique Noël,
Laurent Rigal
To cite this version:
Jean-Laurent Thebault, Hector Falcoff, Madeleine Favre, Frédérique Noël, Laurent Rigal.
Patient-physician agreement on tobacco and alcohol consumption: a multilevel analysis of GPs’ characteristics..
BMC Health Services Research, BioMed Central, 2014, 15, pp.110. �10.1186/s12913-015-0767-6�.
�inserm-01187368�
R E S E A R C H A R T I C L E
Open Access
Patient-physician agreement on tobacco and
alcohol consumption: a multilevel analysis of GPs
’
characteristics
Jean-Laurent Thebault
1*, Hector Falcoff
1,5, Madeleine Favre
1,5, Frédérique Noël
1and Laurent Rigal
1,2,3,4Abstract
Background: Data about tobacco and alcohol consumption are essential in many types of studies. These data can be obtained by directly questioning patients or by using the information collected from physicians. Agreement between these two sources varies according to the characteristics of patients but probably also those of physicians. The purpose of this study was to analyze the characteristics of general practitioners (GPs) associated with
agreement between them and their patients about the patients’ consumption of alcohol and tobacco. Methods: Data came from an observational survey among GPs who were internship supervisors in the Paris
metropolitan area. Fifty-two volunteer GPs completed a self-administered questionnaire about the organization of their practice and their training. For each GP, a random sample of 70 patients, aged 40 to 74 years, answered questions about their personal tobacco and alcohol consumption. GPs simultaneously answered similar questions about each patient. We used a mixed logistic model to assess the association between physicians’ characteristics and agreement for patients’ smoking status and alcohol consumption.
Results: Data were collected from both patient and physician for 2599 patients. The agreement between patients and their physicians was 60.4% for smoking status and 48.7% for alcohol consumption. Physicians with continuing medical education in management of smokers and those reporting specific skill in managing hypertension had the best agreement for smoking. Physicians who taught courses at the university medical school and those reporting specific skill in managing alcoholism had the best agreement for alcohol consumption.
Conclusions: Agreement increases with physicians’ training and skills in management of patients with tobacco and alcohol problems. It supports the importance of professional training for improving the quality of epidemiologic data in general practice. Researchers who use GPs as a source of information about patients’ tobacco and alcohol
consumption must assess the physicians’ characteristics.
Keywords: General practice, Alcohol drinking, Smoking, Agreement, Medical records Background
Tobacco and alcohol consumption are two major causes of morbidity and mortality. Worldwide, the mortality at-tributable to smoking has been estimated at 12% [1] and that attributable to alcohol at 3.8% [2]. Data about consumption of these products, which are risk factors for numerous diseases, are essential in many types of studies, especially epidemiologic, as a variable of interest or for
adjustment [3]. These data can be obtained by directly questioning patients or by collecting the information from physicians [4,5]. General practitioners (GPs) are often questioned about this [6,7]. The information collected from physicians and patients is not always identical. They agree more closely for smoking than for alcohol consump-tion [7,8]. In addiconsump-tion, agreement for smoking varies ac-cording to patients’ characteristics: it is poorer for patients who are younger, male, or more socially disadvantaged [3]. Few studies [9,10] have examined the variations in agree-ment according to physicians’ characteristics. Nonetheless, when data are collected from physicians (for reasons of
* Correspondence:jean-laurent.thebault@parisdescartes.fr
1
Department of General Practice, Sorbonne Paris Cité, Paris Descartes University, Paris, France
Full list of author information is available at the end of the article
© 2015 Thebault et al.; licensee BioMed Central. This is an Open Access article distributed under the terms of the Creative Commons Attribution License (http://creativecommons.org/licenses/by/4.0), which permits unrestricted use, distribution, and reproduction in any medium, provided the original work is properly credited. The Creative Commons Public Domain Dedication waiver (http://creativecommons.org/publicdomain/zero/1.0/) applies to the data made available in this article, unless otherwise stated.
simplicity or if the patients cannot be questioned directly), knowing these characteristics would make it possible to identify the GPs with the most reliable information about consumption (that is, the closest to the patient-reported data). Some characteristics of practice organization, such as the number and types of professionals in the office, have already been studied, but no significant associations have been identified [9]. Moreover, agreement differed according to type of practice organization (medical group vs inde-pendent practice association) in a US study, although this study did not consider tobacco and alcohol consumption [10]. To the best of our knowledge, other important organizational aspects, including the duration of consulta-tions, have not been analyzed. Moreover, we might suppose that physicians’ training, especially in managing smoking and alcoholism, might affect the agreement rate, but this hypothesis has never been tested.
The objective of this study was to analyze whether and if so what GP characteristics (related to their organization of work and their initial and continuing training) are associ-ated with agreement between patients and physicians about the patients’ use of tobacco and alcohol.
Methods
Study design
This study is an ancillary analysis of data from an observa-tional survey named Prev Quanti [11]. This survey was ini-tially designed to document social inequalities in preventive care (screening for breast, cervical, and colorectal cancer, tobacco and alcohol consumption, and cardiovascular risk) provided by GPs. To have a sample size large enough to be able to study the cancer screening tests recommended for patients aged 50–74 years, while still being able to analyze young patients at low cardiovascular risk, we chose to in-clude only patients aged 40 to 74 years. A power calculation determined that we would require 50 GPs and 70 patients per GP to be able to demonstrate social gradients for the types of preventive care studied. The Prev Quanti study was conducted in 2008–09 among GPs who supervised students training in general practice during internships at their offices. We used email and telephone to recruit from among the 215 GPs working with two medical school departments of general practice in the Paris metropolitan area (who were paid 300 € for work estimated to take around 10 hours). For each participating GP, a random sample of 35 men and 35 women aged 40 to 74 years was drawn from their patient list (patients who had reported them to be their regular GP), furnished by the national health insurance fund. There were no exclusion criteria.
GPs’ characteristics
The GPs’ characteristics were collected by a self-administered questionnaire. The first group of characteris-tics concerned the organization of their practices: fixed
fees or authorization for fees beyond the amount re-imbursed by the national health insurance fund, group or solo practice, mean number of consultations per week, mean duration of consultations, percentage of consulta-tions by appointment (compared with open hours), use of computerized medical files, and use of automatic re-minders. The second group of characteristics concerned their initial and continuing training: time since completion of medical school, teaching medical school courses (above and beyond supervising internships), participation in peer groups, responsibility in an organization offering continu-ing medical education (CME), participation in a CME course or a study on any or more of six prevention themes (hypertension, smoking, alcoholism, and screening for breast cancer, colon cancer, and cervical cancer), and reporting specific skill for each of these themes.
Patients’ characteristics
All of the included patients received a questionnaire from their GP, which asked about their smoking status, alcohol consumption, and social situation. They were asked to complete and return it to the GP. At the same time, the GPs were asked to complete a form covering the same data for each patient, using the information in their med-ical files or what they knew about the patient, even if not mentioned in the medical file.
Patients’ smoking status, collected from the patient and the physician, was classified in three categories: current smoker, ex-smoker and non-smoker. Neither group’s report of smoking status was considered a gold standard.
The binary variable of agreement about smoking status was defined as positive when both the patient and the physician placed the patient in the same category. The physician, unlike the patient, could answer “do not know” about the patient’s smoking status. In this case, the response was considered discordant regardless of the patient’s response.
The variable of agreement about alcohol consumption was defined similarly to that for smoking but depended on the patient’s level of alcohol consumption, classified in four categories: abstinent, moderate consumption (≤210 g weekly for men and ≤ 140 g for women), sional excessive consumption (≥50 g on a single occa-sion) and regular excessive consumption (>210 g weekly for men and > 140 g for women). This classification was determined by the alcohol consumption reported, and the cut-off values are those set by the French Society of Alcohol Studies [12].
Statistical analysis
We describe below only the analyses for smoking but the same analytic strategy was used for alcohol con-sumption. We first calculated the agreement among all patients for whom this calculation was possible (that is,
in including all the physicians with “do not know” re-sponses). Next we calculated the agreement and a weighted kappa coefficient (quadratic weighting) [13], only among patients whose physicians did not answer“do not know”, as is usual in the literature [7,8].
We used a mixed logistic model [14] with a random intercept [15,16] to assess the association between physi-cians’ characteristics and agreement for smoking status (the dependent variable). The structure of our data (that is, that patients are grouped by physicians) mandates the use of these statistical models [17] to obtain unbiased estimators [18]. These models simultaneously include fixed indicators that enable ORs to be calculated, as in the standard models, and a random indicator, inter-GP variance, which allows us to calculate variations in the agreement rates between GPs [19].
We performed a univariate and then a multivariate analysis, adjusted for patient’s sex, age (40–50 years, 51–60, 61 to >70), duration of time seeing this GP (<1 year, 1–5, >5), number of consultations with the GP during the past year (<3, ≥3) and occupation, as well as for the physician’s sex [20] and age (in quartiles). We included in a multivariate model all of the GPs’ charac-teristics significantly associated with agreement for smoking status in the univariate analysis, at a threshold of 20%. We then removed the GP characteristics accord-ing to a backward stepwise strategy, with a threshold of 5%, to obtain the final model.
At the end, to evaluate the percentage of inter-GP variance (s2) explained by the GP characteristics in the final model, we constructed another multivariate model (called the reduced final model) containing all patient characteris-tics and the GPs’ age and sex but without any of the other GP characteristics present in the final model. The percentage of reduction of the inter-GP variance between these two models was calculated as follows: Δs2
= 100.(s2reduced final model- s2final model)/s2reduced final model.
This calculation allowed us to quantify the effect of GPs’ characteristics on the variations in the agreement rate between GPs, independently of any effect due to the composition of their practice (patient load) [17].
All statistical analyses were performed with R software, version 2.14.1, and SAS software, version 9.3. The study was approved by the advisory committee on information treatment for health research (Commission nationale de l’informatique et des libertés), and all patients signed informed consents.
Results
The first 52 GPs who volunteered to participate were included in the study. Of the 3640 randomly selected patients, the return rate for physician questionnaires was 98.9% (n = 3600), while the patient participation rate was 71.6% (n = 2605). Finally, data were collected from both
patient and physician for 71.4% (n = 2599) of the patients included.
The physicians’ mean age was 55 years (SD = 6), and 63% of them were men (Table 1). The mean duration of consultations was 21 minutes (SD = 4.8), and physicians saw 92 (SD = 23) patients weekly, on average.
The patients’ mean age was 54 years (+/−9) (Table 1). The median duration of the physician-patient relation-ship was 7 years (interquartile range (IQR) = 3-11) and
Table 1 Patient (n = 2599) and GP (n = 52) characteristics
Patient characteristics n (%) Age (years) 40-50 1027 (39) 51-60 829 (32) 61-70 598 (23) >70 145 (6) Male 1255 (48)
Duration of time seeing the GP (years) [0, 1[ 168 (6)
[1-5[ 846 (33)
>5 1558 (60) Number of consultations during the past year≤ 3 1451 (55) >3 1061 (40) Occupational group Shopkeepers and crafts workers 114 (4) Professionals and managers 1133 (44) Intermediate white-collar workers 502 (19) Office, sales, and service employees 446 (18) Skilled or unskilled manual workers 214 (8) GP characteristics n (%) Age (years)≤50 570 (22) 51-56 638 (25) 57-61 827 (32) ≥62 564 (22) Male 33 (63)
Participation in a CME*course about managing: Hypertension 33 (63) Smoking cessation 23 (44) Alcoholism 23 (44) Reporting specific skills about managing: Hypertension 15 (29) Smoking cessation 12 (23) Alcoholism 12 (23) Teaching medical school course 32 (61) Responsibility in a organisation providing CME 14 (27) Participation in peer groups 33 (63) Group practice 37 (71) Fixed fees 33 (63) ≥80 % consultations by appointment 41 (79) Using computerised medical files 46 (88) Using automatic reminders 15 (28)
*
the median number of consultations during the past year 3 (IQR = 1-5).
The patients’ non-response rate to the smoking ques-tions was 0.3% (n = 8), and to the drinking quesques-tions, 23% (n = 596).
Overall, 27.6% of the patients reported they smoke (Table 2), and 23.9% reported occasional or regular excessive alcohol consumption (Table 3).
For smoking, the mean agreement rate was 60.3%. This rate varied significantly between physicians, ranging from 41.2% to 77.8% for the 10thand 90thpercentiles of the dis-tribution (s2= 0.63). Among patients whose physician did not answer“do not know”, agreement was 75.6% and the weighted kappa coefficient was 0.70. Agreement for smok-ing status was higher among physicians who had done a CME course about managing smoking cessation and those who reported specific skill in managing hypertension (Table 4). The reduction in the inter-GP variance because of these two GP characteristics was 21%.
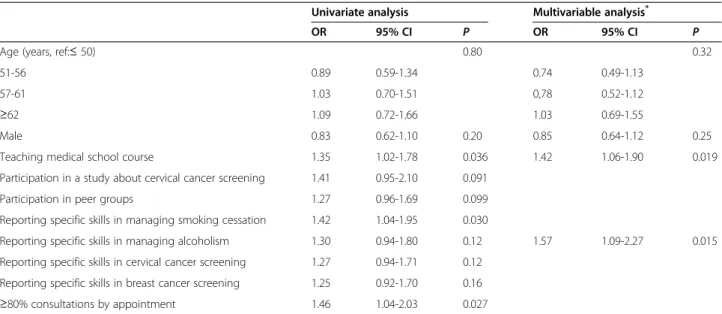
For drinking, the mean agreement rate was 48.7%. This rate again varied significantly between physicians, from 36.0% to 60.8% for the 10thand 90thpercentiles of the distribution (s2= 0.40). Among patients whose physician did not answer “do not know”, the agreement was 58.6% and the weighted kappa coefficient was 0.33. Agreement for alcohol consumption was higher among GPs teaching courses at the medical school and those GPs reporting specific skill in managing alcoholism (Table 5). The reduction in the inter-GP variance be-cause of these two GP characteristics was 29%.
Discussion
In our study, the agreement between patients and their physicians was about 60% for smoking status and almost 50% for alcohol consumption. Both varied significantly be-tween the GPs. Physicians with a CME course in manage-ment of smoking cessation and those reporting specific
skill in managing hypertension had the best agreement for smoking. Physicians who taught courses at the university medical school and those reporting specific skill in man-aging alcoholism had the best agreement for alcohol con-sumption. No characteristic of the organization of their practice was significantly associated with agreement.
To our knowledge, this study is the first to have tested the association between a large group of physicians’ characteristics related to their practice organization and medical education and agreement about smoking and alcohol consumption.
Another strength of our study is the good level of pa-tient participation. This is explained in part by specific characteristics of the physicians who recruited them. The fact that the request for participation came from their regular GP [21] and that this physician had an as-sociation with the university [22] probably gave them confidence.
To assess the physicians’ knowledge of their patients’ smoking status and alcohol use, we used what the GPs ac-tually knew about their patients, even if it was not written in the medical files. That is, GPs in France mainly use their files as practice reminders rather than exhaustive data collections or protection against malpractice suits: they frequently do not include everything they know about the patient (especially the things they know well and are unlikely to forget) [23]. We also calculated agreements based only on what was recorded in the medical files. These agreement rates were lower (39.4% for smoking status and 13.3% for alcohol use, results not shown) than those we obtained in the principal analyses.
In addition to the portion of disagreement resulting from our treating physicians’ “do not know” responses as disagreement, several other points may explain some of this discordance between patients and physicians. Pa-tients generally underestimate their consumptions dur-ing questionnaire surveys [24]. But because the patients
Table 2 Patients’ smoking status according to patients and physicians
Smoking status According to patients n
% Non-smoker Ex-smoker Current smoker Total According to physicians Non-smoker 707 177 73 957
27.3 6.8 2.8 36.9 Ex-smoker 81 407 81 569 3.1 15.7 3.1 22,0 Current smoker 34 59 450 543 1.3 2.3 17.4 21,0 Do not know 284 127 111 522 11,0 4.9 4.3 20,1 Total 1106 770 715 2591 42.7 29.7 27.6 100
had to send the questionnaire back to the GP, they prob-ably responded as they would have during a consultation with him or her. From their perspective, some physicians might also have assumed under-reporting by their patients and accordingly estimated consumption at a level higher than reported.
Moreover, some patients might have modified their consumptions between their last consultation and the time
that they completed the questionnaire, in particular those whom the doctors had not seen recently. To try to take time since the last consultation into account (and thus limit the measurement bias for the agreement), we ad-justed our analyses for the number of consultations during the previous year (which was significantly associated with agreement, results of adjustment not shown). We also conducted a sensitivity analysis, excluding patients who
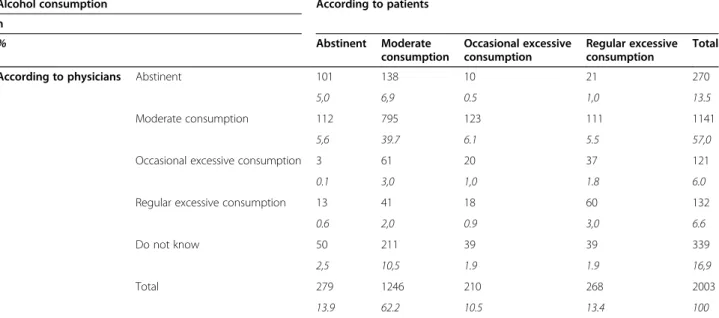
Table 3 Patients’ alcohol consumption according to patients and physicians
Alcohol consumption According to patients n % Abstinent Moderate consumption Occasional excessive consumption Regular excessive consumption Total According to physicians Abstinent 101 138 10 21 270
5,0 6,9 0.5 1,0 13.5 Moderate consumption 112 795 123 111 1141
5,6 39.7 6.1 5.5 57,0 Occasional excessive consumption 3 61 20 37 121 0.1 3,0 1,0 1.8 6.0 Regular excessive consumption 13 41 18 60 132
0.6 2,0 0.9 3,0 6.6 Do not know 50 211 39 39 339
2,5 10,5 1.9 1.9 16,9 Total 279 1246 210 268 2003
13.9 62.2 10.5 13.4 100
Table 4 Association between GPs’ characteristics& and agreement for smoking status (n = 2322)
Univariate analysis Multivariable analysis*
OR 95% CI P OR 95% CI P Age (years, ref :≤ 50) 0.90 0.94 51-56 1.00 0.57-1.74 0.97 0.58-1.63
57-61 1.01 0.61-1.69 1.02 0.63-1.66 ≥62 0.84 0.48-1.48 0.87 0.51-1.51
Male 1.28 0.87-1.89 0.22 0.71 0.48-1.05 0.088 Teaching medical school course 1.43 0.98-2.08 0.063
Responsibility in an organization providing CME# 1.66 1.10-2.50 0.015
Participation in a CME#about managing smoking cessation 1.54 1.07-2.21 0.021 1.71 1.18-2.49 0.005 Participation in a CME#about colon cancer screening 1.38 0.92-2.06 0.12
Participation in a study about colon cancer screening 0.73 0.46-1.17 0.19 Participation in peer groups 1.42 0.97-2.08 0.072
Reporting specific skills in managing hypertension 1.32 0.87-1.99 0.19 1.72 1.11-2.65 0.015 Reporting specific skills in managing smoking cessation 1.35 0.86-2.10 0.19
Reporting specific skills about cervical cancer screening 1.35 0.90-2.04 0.15 Using computerized medical files 0.68 0.38-1.22 0.19
Inter-GP variance: s2= 0.31, Hosmer-Lemeshow test of goodness of fit:P = 0.11. & Only GPs characteristics withP ≤ 0.20 in univariate analysis are shown.
*
adjusted for patient’s sex, patient’s age, duration of time seeing this GP, number of consultations during the past year, patient’s occupation, GP’s age and GP’s sex.
#
had not been seen in the past year (16.7% of patients); its results were nearly identical to those presented. Agreement was 62.7% for smoking status and 50.0% for alcohol con-sumption. The results of the final models also remained very similar in terms of the significance of the variables, and the direction and intensity of the associations.
Another particularity of our study is that we collected the doctor’s opinion (as well as the file information). This opinion might be affected by memory errors or based on prejudices [25].
Finally, some part of the disconcordance may be due to the fact that physicians do not regularly collect up-dated information on these topics, although such updat-ing is recommended [23].
For some GPs, agreement might have been better be-cause they had patients with the characteristics associ-ated with better agreement and not because of their own characteristics. Agreement is best, for example, for the most advantaged patients [3]. Physicians whose patients were largely well-off could thus have had better agree-ment that was not associated with their own characteris-tics. We took this confounding into account by using hierarchical models adjusted for different patient charac-teristics (such as occupation) that are known to be asso-ciated with agreement.
Two hypotheses might explain why we found so few GP characteristics associated with agreement. Our sam-ple of physicians might be too homogeneous. All the participating GPs also supervise internships, which tends to encourage them to follow the clinical practice guide-lines [23] that mandate the inclusion of smoking and
alcohol status in medical files. Nonetheless this theory seems to be contradicted by the great variability ob-served between the GPs. More probably, the relatively low number of physicians included in the study limited the power of our statistical tests: in hierarchical models with random physician effects, power is linked above all else to the number of physicians analyzed [24,26].
The generalizability of our results might also be ques-tioned, especially because all the participating GPs supervise interns. However, the characteristics of the participating GPs are not very different from those of all French GPs, particularly with regard to age, sex, fixed fees or not, and solo or group practice [27], and the agreement we observed for smoking status and alcohol consumption was quite similar to the agreement re-ported in the literature (as discussed below). Moreover, the association measures between agreement and GPs’ characteristics reported here do not appear likely to be influenced by internship supervision.
The kappa for smoking status that we observed (0.70) corresponds to substantial agreement [28].
This result is consistent with previous studies that have found kappa coefficients between 0.46 and 0.83 [7,8,29,30]. The kappa for alcohol consumption (0.33) corresponds to fair agreement and is lower than that reported in the study by Mant et al. (0.53) [7]. This dif-ference is probably due to the existence of the category of occasional excessive consumption, which the physi-cians selected rather rarely: only 9.5% of the patients who reported such consumption were so classified by their GPs (Table 3).
Table 5 Association between GPs’ characteristics& and agreement for alcohol consumption (n = 1827)
Univariate analysis Multivariable analysis* OR 95% CI P OR 95% CI P Age (years, ref:≤ 50) 0.80 0.32 51-56 0.89 0.59-1.34 0.74 0.49-1.13
57-61 1.03 0.70-1.51 0,78 0.52-1.12 ≥62 1.09 0.72-1.66 1.03 0.69-1.55
Male 0.83 0.62-1.10 0.20 0.85 0.64-1.12 0.25 Teaching medical school course 1.35 1.02-1.78 0.036 1.42 1.06-1.90 0.019 Participation in a study about cervical cancer screening 1.41 0.95-2.10 0.091
Participation in peer groups 1.27 0.96-1.69 0.099 Reporting specific skills in managing smoking cessation 1.42 1.04-1.95 0.030
Reporting specific skills in managing alcoholism 1.30 0.94-1.80 0.12 1.57 1.09-2.27 0.015 Reporting specific skills in cervical cancer screening 1.27 0.94-1.71 0.12
Reporting specific skills in breast cancer screening 1.25 0.92-1.70 0.16 ≥80% consultations by appointment 1.46 1.04-2.03 0.027
Inter-GP variance: s2
= 0.11, Hosmer-Lemeshow test of goodness of fit:P = 0.41. & Only GPs characteristics with p≤ 0.20 in univariate analysis are shown.
*
adjusted for patient’s sex, patient’s age, duration of time seeing this GP, number of consultations during the past year, patient’s occupation, GP’s age and GP’s sex.
We found few reports to compare with our results about the physicians’ characteristics associated with agreement. The study by Ferrante et al., which is the closest to ours, did not look at alcohol consumption, nor did it find the organizational characteristics of the practice to be associ-ated with agreement about smoking [9].
Physicians trained in managing patients who smoke had the best agreement rate, probably because they are more involved in screening and helping their patients to stop smoking [31]. Similarly, physicians skilled in man-aging patients with drinking problems feel that they can appropriately be interested in their patients’ consump-tion. It is well known that one of the major obstacles to screening for alcoholism is physicians’ feeling of impo-tence in this field and their lack of training [32].
Conclusions
Agreement increases with physicians’ training and skills in management of patients with tobacco and alcohol problems. Our results thus underline the importance of professional training, which still requires improvement. Our results should also induce researchers to look at physicians’ characteristics when they ask GPs about their patients’ smoking status and al-cohol consumption. The data in studies of phenomena associ-ated with use of these substances would probably be of higher quality if the researchers recruited as investigators physicians trained or specifically skilled in these domain, for example, through a CME organization or a relevant care network.
Abbreviations
CCTIRS:Advisory committee on data processing in health research (Comité consultatif sur le traitement de l’information en matière de recherche dans le domaine de la santé); CME: Continuing medical education; GP: General practitioner; IQR: Interquartile range; SD: Standard deviation; SFTG: French society of generalist treatment (Société de formation thérapeutique du généraliste); WHO: World Health Organization.
Competing interests
The authors declare that they have no competing interests.
Authors’ contributions
All authors participated in the development of the research question and the study design. FN, MF, HF and LR participated in the recruitment of physicians, data collection and data entry. JLT and LR performed the statistical analysis. JLT and LR drafted the manuscript, which was reviewed and approved by all authors.
Acknowledgments
The authors are extremely grateful to all the GPs and patients who took part in this study, as well as to the Society for Training of General Practitioners (Société de Formation Thérapeutique du Généraliste, SFTG) for its logistic support and to the general medicine department of the Faculté de médecine Pierre and Marie Curie for its active collaboration in the performance of this study. The authors thank the Groupement régional de santé publique d'Ile de France, Conseil régional d’Ile de France and the National Institute for Prevention and Health Education (INPES, Institut national de prévention et d’éducation pour la santé) for their financial support.
Author details
1Department of General Practice, Sorbonne Paris Cité, Paris Descartes
University, Paris, France.2Inserm, Centre for Research in Epidemiology and Population Health, U1018, Gender, Health, Sexuality Team, Villejuif, France.
3
Paris Sud University, UMRS 1018, Villejuif, France.4Ined, Paris, France.
5Société de Formation Thérapeutique du Généraliste, Paris, France.
Received: 18 November 2014 Accepted: 27 February 2015
References
1. World Health Organization. WHO global report on mortality attributable to tobacco. Geneva, Switzerland: World Health Organization; 2012.
2. World Health Organization, Management of Substance Abuse Team. Global Status Report on Alcohol and Health. Geneva, Switzerland: World Health Organization; 2011.
3. Newell SA, Girgis A, Sanson-Fisher RW, Savolainen NJ. The accuracy of self-reported health behaviors and risk factors relating to cancer and cardiovascular disease in the general population: a critical review. Am J Prev Med. 1999;17:211–29.
4. Pakhomov SV, Jacobsen SJ, Chute CG, Roger VL. Agreement between patient-reported symptoms and their documentation in the medical record. Am J Manag Care. 2008;14:530–9.
5. Murray RL, Coleman T, Antoniak M, Fergus A, Britton J, Lewis SA. The potential to improve ascertainment and intervention to reduce smoking in Primary Care: a cross sectional survey. BMC Health Serv Res. 2008;8:6. 6. Simpson CR, Hippisley-Cox J, Sheikh A. Trends in the epidemiology of
smoking recorded in UK general practice. Br J Gen Pract J R Coll Gen Pract. 2010;60:e121–7.
7. Mant J, Murphy M, Rose P, Vessey M. The accuracy of general practitioner records of smoking and alcohol use: comparison with patient
questionnaires. J Public Health Med. 2000;22:198–201.
8. Wilson A, Manku-Scott T, Shepherd D, Jones B. A comparison of individual and population smoking data from a postal survey and general practice records. Br J Gen Pract. 2000;50:465.
9. Ferrante JM, Ohman-Strickland P, Hahn KA, Hudson SV, Shaw EK, Crosson JC, et al. Self-report versus Medical Records for Assessing Cancer-Preventive Services Delivery. Cancer Epidemiol Biomarkers Prev. 2008;17:2987–94. 10. Tisnado DM, Adams JL, Liu H, Damberg CL, Hu A, Chen W-P, et al. Does
concordance between data sources vary by medical organization type. Am J Manag Care. 2007;13(part 1):289–96.
11. Société de formation thérapeutique du Généraliste. Mobiliser les médecins traitants franciliens pour réduire les inégalités de prévention et dépistage. Paris, France: Société de formation thérapeutique du généraliste; 2010. 12. Société française d’alcoologie. Alcohol misuse except alcohol addiction:
use and misuse. Alcoologie Addictologie. 2003;25:75S–87.
13. Cohen J. A Coefficient of Agreement for Nominal Scales. Educ Psychol Meas. 1960;20:37–46.
14. Coughlin SS, Pickle LW, Goodman MT, Wilkens LR. The logistic modeling of interobserver agreement. J Clin Epidemiol. 1992;45:1237–41. 15. Snijders TAB, Bosker R. Multilevel Analysis: An Introduction to Basic and
Advanced Multilevel Modeling. Secondth ed. Los Angeles: SAGE Publications Ltd; 2011.
16. Raudenbush SW, Bryk AS. Hierarchical Linear Models: Applications and Data Analysis Methods. 2nd ed. Thousand Oaks: SAGE Publications, Inc; 2001. 17. Diez R. A glossary for multilevel analysis. J Epidemiol Community Health.
2002;56:588–94.
18. Moerbeek M, van Breukelen GJP, Berger MPF. A comparison between traditional methods and multilevel regression for the analysis of multicenter intervention studies. J Clin Epidemiol. 2003;56:341–50.
19. Merlo J, Chaix B, Yang M, Lynch J, Råstam L. A brief conceptual tutorial of multilevel analysis in social epidemiology: linking the statistical concept of clustering to the idea of contextual phenomenon. J Epidemiol Community Health. 2005;59:443–9.
20. Soto CM, Kleinman KP, Simon SR. Quality and correlates of medical record documentation in the ambulatory care setting. BMC Health Serv Res. 2002;2:22.
21. Rigal L, Saurel-Cubizolles M-J, Falcoff H, Bouyer J, Ringa V. Do social inequalities in cervical cancer screening persist among patients who use primary care? The Paris Prevention in General Practice survey. Prev Med. 2011;53:199–202.
22. Kaguelidou F, Amiel P, Blachier A, Iliescu C, Rozé J-C, Tsimaratos M, et al. Recruitment in pediatric clinical research was influenced by study characteristics and pediatricians’ perceptions: a multicenter survey. J Clin Epidemiol. 2013;66:1151–7.
23. Agence nationale d’accréditation et d’évaluation en santé (ANAES): La Tenue Du Dossier Médical En Médecine Générale: État Des Lieux et Recommandations. Paris, France; 1996
24. Snijders TAB, Bosker RJ. Standard errors and sample sizes for two-level research. J Educ Behav Stat. 1993;18:237–59.
25. Van Ryn M, Burke J. The effect of patient race and socio-economic status on physicians’ perceptions of patients. Soc Sci Med 1982. 2000;50:813–28. 26. Kreft IGG, de Leeuw J. Introducing Multilevel Modeling. London; Thousand Oaks,
Calif: Sage; 1998.
27. Institut national de prévention et d’éducation pour la santé. Baromètre santé médecins généralistes 2009. Saint-Denis: INPES éd; 2011. 28. Landis JR, Koch GG. The measurement of observer agreement for
categorical data. Biometrics. 1977;33:159–74.
29. Eze-Nliam C, Cain K, Bond K, Forlenza K, Jankowski R, Magyar-Russell G, et al. Discrepancies between the medical record and the reports of patients with acute coronary syndrome regarding important aspects of the medical history. BMC Health Serv Res. 2012;12:78.
30. Tisnado DM, Adams JL, Liu H, Damberg CL, Chen W-P, Hu FA, et al. What is the concordance between the medical record and patient self-report as data sources for ambulatory care? Med Care. 2006;44:132–40.
31. Stead M, Angus K, Holme I, Cohen D, Tait G. Factors influencing European GPs’ engagement in smoking cessation: a multi-country literature review. Br J Gen Pract. 2009;59:682–90.
32. Blanquet M, Peyrol MF, Gerbaud L, Morel F, Maradeix B, Llorca P-M, et al. Tackling the alcohol issue in France. Br J Gen Pract. 2014;64:16.
Submit your next manuscript to BioMed Central and take full advantage of:
• Convenient online submission
• Thorough peer review
• No space constraints or color figure charges
• Immediate publication on acceptance
• Inclusion in PubMed, CAS, Scopus and Google Scholar
• Research which is freely available for redistribution
Submit your manuscript at www.biomedcentral.com/submit