Constraint Analysis and Throughput Improvement at an Automotive Assembly Plant
by
Jos6 Leoncio Vald6s R.
Bachelor of Science in Mechanical Engineering,
Instituto Tecnol6gico y de Estudios Superiores de Monterrey (1996)
Submitted to the Department of Mechanical Engineering and the Sloan School of Management in Partial Fulfillment of the Requirements for the Degrees of
Master of Science in Mechanical Engineering and Master of Business Administration
In Conjunction with the Leaders for Manufacturing Program at the Massachusetts Institute of Technology
June 2003
@2003 Massachusetts Institute of Technology. All rights reserved.
Signature of Author
Department of Mechanical Engineering Sloan School of Management May 9, 2003
Certified by
Roy Welsch, Thesis Advisor Professor of Statistics and Management Science Sloan School of Management Certified by
Dr. niel Whitney, Thesis Advisor Senior Research Scientist Center for Technology, Policy and Industrial Developments Accepted by
Margaret Andrews, Executive Director of Masters Program I an School of Management
Accepted by
Constraint Analysis and Throughput Improvement at an Automotive Assembly Plant
by
Jose Leoncio Vald6s R.
Submitted to the Department of Mechanical Engineering and the Sloan School of Management on May 18, 2003 in partial fulfillment of the Requirements for the Degrees of Master of Science
in Mechanical Engineering and Master of Business Administration
Abstract
To effectively increase throughput of a process, one must understand where the constraints are and how to manage them effectively. In complex manufacturing environments, locating the bottleneck is not a simple task in the absence of good information about the equipment, production yield rates, and the interaction between the various machines. This thesis describes the process of analyzing a complex production line at an automobile company and identifying
opportunities for productivity improvement.
The task of collecting an increasing amount of accurate and reliable data for evaluating the performance of a production system has become a challenge for manufacturing companies. Web-deployed machine monitoring software seemed to be the solution to real-time data collection at the automobile company. A proposed template for how to set up the software is included as well as the implementation process and recommendations for future installations. Unfortunately, these systems are still "hard-wired" to the Programmable Logic Controllers (PLC) on the plant floor. Changes made to the PLC programs will alter the data collected and put at risk the reliability of the information every time a change is made to them.
In addition to deficient information, line supervisors lack the necessary analytical tools for locating the bottleneck(s) in their subsystems and thus, are unable to focus their throughput improvement e fforts. T he r esult i s wasted effort focused o n areas that d o n ot d irectly i mpact throughput. Much time is devoted to firefighting daily production issues. Firefighting and continuous improvement methods should be data driven to ensure that limited resources are used efficiently when trying to increase throughput. Tools such as man/machine mapping and discrete-event type simulation techniques are explained. Recommendations developed from the use of both tools are listed.
Regardless of the tools and methods employed, worker involvement with its continuous improvement work group is essential to the success of the lean manufacturing improvement initiatives. Improvements will be limited if this key element is ignored.
Thesis Supervisor: Roy Welsch
Title: Professor of Statistics and Management Science Sloan School of Management
Thesis Supervisor: Dr. Daniel Whitney Title: Senior Research Scientist
Acknowledgements
The author gratefully acknowledges the support and r esources m ade available t o h im for t his project through the Leaders for Manufacturing Program, CONACYT, and the Ford Motor Company. I specifically want to thank Song Lee, my company supervisor, for going "above and beyond the call of duty" and offering all the different training opportunities needed to develop the project.
I would like to thank my advisors, professors Roy Welsch and Dr. Daniel Whitney for their patient guidance throughout this entire project. Especially, I would like to thank Dr. Daniel Whitney for jumping into the project halfway down the road and providing his invaluable assistance.
I would like to thank the many employees at the Ford Motor Company who took the time to share their ideas and insight with me. In particular, I would like to thank Hossein Nivi, Lee Dimascio, Doug Crossman, Paul Lagrich, Steve Beeler, Shigeru Sadakane, Mark and Raymond for p roviding m e with t he m ajority o f t he k nowledge t hat I acquired d uring t his i ntemship. I would also like to thank the many engineers, operators and supervisors who made my time on the shop floor at Dearborn Assembly Plant a rewarding experience.
I am thankful to have been a part of the LFM Class of 2003 and to have had an opportunity to know the outstanding individuals in the program. I wish to thank all of my classmates for sharing their knowledge, experiences, and fun times over the past two years.
I would also like to thank my family and friends, who provided me with support and words of encouragement through the entire Leaders for Manufacturing program, particularly my parents Jos6 Leoncio Valdes and Sylvia Graciela Reynoso.
Most of all, I would like to thank my wife, Liza Fernanda, for her patience and dedication, and for helping me during the past two years so that I could accomplish my priorities. I could never have persevered this challenging experience without her support, encouragement, and love.
Table of Contents
A b stra c t... 2
A cknow ledgem ents... 4
Table of Contents... 5
Table of Figures ... 7
Chapter 1: Introduction... 8
1.1 Background... 10
1.2 Project Setting and M otivation... 11
1.3 Goals and Objectives ... 12
1.4 Project Approach ... 13
1.5 Structure of Thesis ... 14
Chapter 2: Environm ent... 16
2.1 A ssem bly Plant... 17
2.2 Body Shop Process Flow ... 18
2.3 Focus Area: Rear Pan Line ... 22
2.3.1 Policy D ecisions that A ffect Throughput ... 25
2.3.1.1 Production Overtim e Policy ... 25
2.3.1.2 Inventory Policy ... .... 27
2.3.1.3 Sum m ary... 28
Chapter 3: Theory of Constraints and Lean M anufacturing ... 29
3.1 Serial Production System s... 29
3.2 Theory of Constraints... 31
3.2.1 M easurem ent System s ... 34
3.2.2 Process of Ongoing Im provem ent ... 35
3.3 Lean M anufacturing ... 36
3.4 Theory of Constraints versus Lean M anufacturing... 39
3.4.1 Sim ilarities... 39
3.4.2 D ifferences... 41
3.4.3 Applicability to Rear Pan Line ... 42
3.5 Sum m ary... 43
Chapter 4: Perform ance M etrics ... 45
4.1 FPS Perform ance M etrics... 45
4.2 Reliability and M aintainability M etrics... 46
4.3 Sum m ary... 48
Chapter 5: Constraint Analysis ... 49
5.1 Body Shop Production Level. ... 50
5.1.1 Overspeed Strategy... 50
5.1.2 M anual D ata Collection... 51
5.1.3 Factory Reporting System (FRS) D ata... 53
5.1.4 Com puter Sim ulation of Autom ated Flow Lines ... 57
5.2 Rear Pan Production Level... 61
5.2.2 M an/M achine M apping ... 64
5.2.3 Com puter Sim ulation... 68
5 .3 S u m m ary ... 7 1 Chapter 6: D ata Driven actions... 72
6.1 On-line M onitoring System ... 74
6 .1 .1 C u rren t S tate ... 7 5 6.1.2 Proposed State ... 77
6 .2 S u m m ary ... 82
Chapter 7: Conclusions and Recom m endations ... 83
7.1 Operational Level... 85
7.2 M anagem ent Level... 88
7.3 Labor Relations ... 89
Glossary - Acronym s ... 92 B ib lio grap h y ... 9 3
Table of Figures
Figure 1. B ody Shop Layout ... 19
Figure 2. Percentage of Required versus Current Maintenance Manpower Heads ... 21
Figure 3. R ear Pan Line Layout ... 22
Figure 4. System Dynamics Model for the Production Overtime Policy ... 26
Figure 5. System Dynamics Model for Inventory ... 28
Figure 6. Three Coupled Stations Without a Buffer and their States ... 30
Figure 7. Three Stations with a Buffer and their States (Station 2 & 3 Decoupled) ... 30
Figure 8. JPH Potential by A rea (Shift -2) ... 54
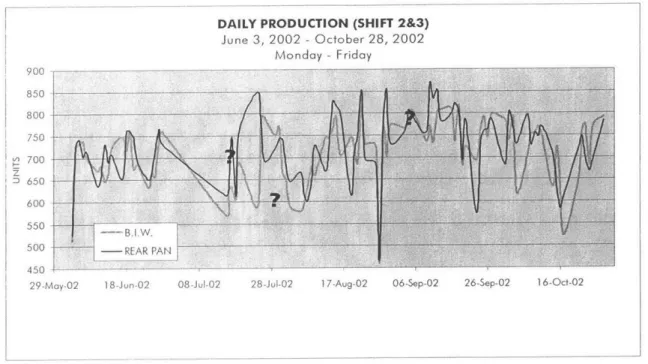
Figure 9. Rear Pan versus B.I.W. Daily Production (Shift 2 & 3) ... 57
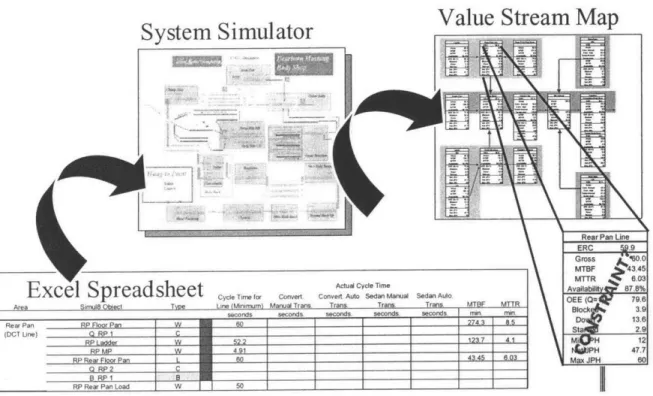
Figure 10. Inputs and Outputs of the System Simulator Using a Spreadsheet Interface ... 60
Figure 11. Comparison Between Shifts for the Rear Pan Line's 10-day Moving Average JPH and its V ariability ... 62
Figure 12. Man/Machine Map for the Rear Pan Line (Ladder and Automatic Areas) ... 65
Figure 13. Computer Simulation Template for the Rear Pan Line ... 69
Figure 14. TimeView Report for the Rear Pan Line Simulation ... 70
Figure 15. Lean Improvement Cycle Improved by Industrial Information Technology ... 72
Figure 16. Assumptions to Determine the State of the Ladder, Skin and Automatic Areas . 78 Figure 17. VisualPlantim Trends Window ... 79
Figure 18. VisualPlantTM Production View Window ... 81
Chapter 1: Introduction
Having the drive for continuous productivity improvement has become a necessity for manufacturing organizations. Companies that have failed to keep up in the productivity competition have paid the price on the bottom line, suffering declining profits and loss of market share. To maintain competitiveness, companies are implementing a variety of improvement methodologies, such as Lean Manufacturing and Theory of Constraints. Identification of the operations that most constrain productivity is a critical step in many of these improvement methodologies. The "most constraining operations" are called the system bottlenecks. The identification of system bottlenecks is important in the improvement process because it allows limited resources to be focused on the most effective improvement activities.
While improvement methodologies such as Lean Manufacturing techniques aid at recognizing system bottlenecks, the methods for identifying the system constraints in complex, unstable manufacturing environments are not fully developed in an easy to follow procedure so that line supervisors can understand them and use them on a daily basis. In these environments, analytical tools must be developed and applied to the task of data collection and bottleneck identification.
This thesis presents one example that illustrates the need for these tools. This example is taken from the research conducted in an automotive assembly plant. Serial production lines, semi-automated material handling, and poorly defined buffers between operations characterize the manufacturing process in this plant. In this environment, it was not possible to use simple heuristics to identify the bottlenecks. The research for this thesis was conducted as part of a
Leaders for Manufacturing internship conducted at the Ford Motor Company Dearborn Assembly Plant (DAP), sole manufacturing site for the Ford Mustang during the time of the project.
The improvement methodology applied at the DAP plant is based on the Theory of Constraints (TOC). Eli Goldratt and Jeff Cox first presented the TOC methodology in The Goal.3 The TOC states that improvement resources should be focused on the constraint (or bottleneck) process. In other words, improving a non-constraint process requires an investment without providing a return in improved productivity.
While the TOC presents a clear process for improving throughput, the methods for identifying the location of the system bottleneck(s) are less well developed. The method described in The Goal recommends observing the system and identifying where work in-process accumulates. The process step that occurs after the accumulated work in-process is considered the bottleneck. This thesis demonstrates that a more analytical method is required in environments where the process variables, including work in-process, are difficult or impossible to measure, such as the case of a continuous serial production system. Besides, reliable data collection systems should be in place in order to make assertive decisions.
Above all, in addition to the suggested tools, the methodology presented in this thesis requires a team structure to facilitate and support a continuous improvement process. Plant management, the engineering group and the hourly workforce, have to work together to identify avenues for improvement.
To meet the increased production demand of the Ford Mustang, plant management at DAP initiated a throughput improvement effort based on Ford Total Productive Maintenance and the Theory o f C onstraints, i n w hich u se o f t ools s uch a s c omputer d iscrete-event t ype s imulation were applied. I was able to join both efforts and assigned to the task of developing throughput improvement suggestions for the plant management.
1.1 Background
The DAP is located at the Rouge Complex, which dates back to 1917. Production lines within the Body Shop have been automated with the newest line, the Rear Pan Line, being about 10 years old. Among the different plans to revitalize the Rouge Complex area, the DAP is scheduled to be demolished in 2004. Production of the Ford Mustang is expected to move to the Mazda plant in Flat Rock for the 2004 model.
As part of the $2 billion redevelopment project, a brand new plant across the street, Dearborn Truck Plant (DTP), will start operations in mid-2004 to assemble the all-new 2004 Ford F-150. F-Series is Ford's best-selling vehicle and a key to the company's recovery plan. During 2001, they sold more than 900,000 F units and since the pickup's debut in 1948, they have sold 27.5 million F-Series pickups. F-Series has been the best-selling truck in America for 25 years and the best-selling vehicle in America for 20 years!*
The Rouge project is remaking one of the world's largest and oldest industrial icons into a role model for sustainable, lean and flexible manufacturing. Concerning flexibility, the new DTP at
the Ford Rouge Center, will be Ford's most flexible assembly plant in North America. DTP will have the ability to produce three vehicle platforms and up to nine different models.
1.2 Project Setting and Motivation
While the plant management and operators at DAP look forward to moving to the new facilities, they still had the challenge to deal with an old and unreliable operation at DAP, in which the preventive maintenance culture on the machinery was low. In addition, plant management had to deal with pressure from upper management to accomplish the production numbers because orders for this model were backlogged several months and the company itself was going through a financial crisis.
Ford Mustang was in high demand. Its sales were up 29% from previous month during September, 2002 and the model had positioned itself as the best-selling small sports car, year-to-date.* To meet customer commitments, the employees in the area worked significant overtime. Two 10-hour daily shifts were the norm, and some weekends as required. The increase in overtime had become less and less beneficial because workers were exhausted and had lost motivation to improve. Therefore, the area was not achieving the additional throughput for the added costs.
Most of the time, plant management found itself "fire-fighting" problems in order to achieve its production goals. Little time was allocated to collect and analyze data that would enable them to make decisions that would solve the problem by addressing the root causes. The lack of these information enablers inhibited the virtuous cycle of continuous improvement.
The Body Shop was the bottleneck of the DAP and because of the large increase in technology complexity in its manufacturing processes, it was hard to determine the location of the bottlenecks within the Body Shop. The objective of the thesis project was to start with a foundation of Theory of Constraints and Lean Manufacturing knowledge, and to use this knowledge to help understand and improve the Body Shop throughput problems.
1.3 Goals and Objectives
As already mentioned, the overall throughput of the plant seemed to be constrained by the Body Shop area, where it was believed that the Rear Pan Line was causing a bottleneck. However, there had been little effort to back up this assumption using a numerical validation.
Since methods were lacking to clearly pinpoint the subsystem bottlenecks, the main objective of the project was to help the plant management validate the constraint and improve its throughput, elevating the whole system's throughput as a consequence. The goal was to efficiently focus daily firefighting activities, thus freeing up more time for effectively focused continuous improvement activities.
The project proposes a numerical validation to help determine the bottlenecks within the Body Shop and makes recommendations on how to collect data from this area on a real time basis in order to monitor its behavior and be able to focus the improvement efforts. On-line monitoring systems for manual/automatic lines, as well as discrete-event type simulation techniques are applied to develop the proposed suggestions.
1.4 Project Approach
The Body Shop lacked a data analysis method to identify the subsystem bottlenecks. Early during the project, as an interim solution, the Vehicle Operations Division (V.0.) assisted the Body Shop by outsourcing a machine down time study of the facility to independent data loggers. The purpose was to observe and gather detailed data on downtime occurrences on the plant floor as well as its root causes. The downtime data was fed to a discrete-event type simulation developed by V.O. in which the operation of the whole Body Shop was simulated and the state of each station monitored to check for the bottleneck(s) within the system. A throughput
improvement roadmap was developed out of this project.
Initial efforts were also placed in a Ford Total Productive Maintenance (FTPM) Reenergization Program in which plant management at different levels interviewed maintenance skill trades and through a predefined procedure, a list of recommendations was developed. Statistical analysis on the line supervisor's manually input data led management to suspect that the Front End, Rear Pan and Underbody lines were the potential system bottlenecks.
After having both initiatives' feedback, the Rear Pan Line was chosen as the area of focus for the internship project. This line comprised a system with offline cellular production and traditional serial processes which was viewed as difficult to manage. While this was the area chosen for the project, the methodologies resulting from this project are applicable in other areas of the Body Shop.
Not long after focusing on the Rear Pan Line, we realized there was a lack of reliable and accurate information, which would, in turn, restrain our ability to spot improvement opportunities. As personnel associated with the area were interviewed, we discovered a general lack of understanding of the production goals as well as where and why the throughput was being constrained. This confusion was evidenced by the multitude of "root causes" which were described. As we looked into collecting data and information, we found a large gap between the information which was available and that which might be useful. This discovery prompted us to take a step back and analyze the manufacturing system further, to determine how the information was being collected and which information was in fact necessary to make effective decisions. Therefore, a strategy to obtain the right information and make use of it in a deliberate continuous improvement process had to be developed. While this was the area chosen for the project, the methodologies resulting from this project are applicable in other areas of the Body Shop.
1.5 Structure of Thesis
The thesis is divided into seven chapters:
Chapter I introduces the challenges of bottleneck identification, and describes the need for analytical tools. The plant environment and the specific problems faced are reviewed. Finally, the project approach is presented.
Chapter 2 explains in greater detail Ford's current financial position at the time of the project and gives m ore s pecifics o n t he D AP. Halfway i n t he c hapter, t he R ear P an Line i s e xplained i n detail as well as a couple of policy decisions that were affecting the area's throughput.
Chapter 3 is a quick overview of Theory of Constraints and Lean Manufacturing as well as a comparison of both methodologies. The chapter ends by stating the applicability of both theories to the Rear Pan Line.
Chapter 4 presents the Ford Production System's manufacturing performance metrics and makes comments relating to the usefulness of these metrics for the proper bottleneck identification. Reliability and Maintainability indexes are explained since they will be used for the remaining of
the thesis.
Chapter 5 first tries to define the plant's target throughput. It then relates to the difficulties faced in obtaining accurate data and how this data was used to define the Rear Pan Line as the area to focus. Man/machine mapping and discrete-event type simulation techniques are explained. Recommendations developed from the use of both tools are listed.
Chapter 6 stresses the need for data driven decisions. The used of a web-deployed on-line monitoring system is proposed as well as a template to be used in order to collect the information. Implementation challenges are listed.
Chapter 7 presents the conclusions and recommendations.
Chapter 2: Environment
During the course of the project, the Ford Motor Co. was feeling the consequences of an economic slowdown. In September, 2002 its market capitalization of $19.7 billion was less than the $24.9 billion in gross cash the company had on its books, which meant investors were effectively assigning a negative value to Ford's $131.5 billion a year automotive and finance business. There was a big concern from investors that Ford's need for cash to finance consumer discount deals and new products was currently outstripping its ability to generate cash from its day-to-day business. Company officials at Ford were expecting to return to positive operating cash flow by late 2003.*
As Stephen Girsky, Morgan Stanley's automotive analyst mentioned: "The good news is they're making progress on their [recovery] plan. The bad news is we're in a 17 million [vehicle sales a year] market and they're barely profitable". Company's top management had to cope with all the financial distress as well as having to rethink whether the company's target to reduce the cost of an average Ford North American vehicle by $700, one major element of their recovery plan, may not have been enough in the face of the industry's price wars.*
In October 2002, in just one week Ford's stock lost 16% of its value. For the year, it had lost 60% of its value - and almost 90% if we went back 3 years.** The above had a big impact on
Ford Expects 'Small Profit' In Period, Beating Forecasts, JOSEPH B. WHITE and NORIHIKO SHIROUZU, THE WALL STREET JOURNAL, 09/10/2002
employee's morale and made it hard to have any improvement project that required even little investment approved.
2.1 Assembly Plant
The Body Shop at DAP is one of three main sub-plants within the overall automotive assembly plant, the others being the Paint Shop, and General Assembly.
Body Shop. The Body Shop is the most upstream process within the assembly plant. Its function is to build up the body of the vehicle, which includes the structural frame and sheet metal shell of the vehicle (the Body Shop will be discussed in more detail in subsection 2.2). Once the body-in-white, the Body Shop's final product, has been fabricated, it flows into the Paint Shop.
Paint Shop. The Paint Shop's function is to receive the body-in-white from the Body Shop, and paint it. This involves cleaning, treating, applying undercoats, and applying a finish coat. The product then moves on to the General Assembly.
General Assembly. The General Assembly receives the painted body structure from the Paint Shop and adds all minor and major vehicle components to assemble the complete vehicle. General Assembly consists of two main areas: Trim and Chassis.
As of June, 2003 the Assembly Plant was running into some serious problems. As reported by the Manufacturing Plant Manager, actual production for the week ending June 25, 2003 was 13%
below the weekly target, representing $3.7 million in lost economic profits. Besides, the plant's budget performance for the week was over budget.*
Due to the fact that the plant was assembling the Ford Mustang, for which there was a long order backlog and this model was in fact a cash generator for the company, there was pressure from top management to increase the plant's throughput, especially with the financial crisis that the company was going through. Because of the machinery unreliability, plant management claimed to have an unstable working environment at the Body Shop and was proving to be very difficult to manage thus, required help from the V.0. Division within Ford. Vehicle Operations responded by assisting the plant with the machine down time study as well as launching the F ord Total Productive Maintenance (FTPM) Reenergization Program.
2.2 Body Shop Process Flow
A Body Shop assembles the metal of an automobile together through various welding serial processes. Some of the welding is used to locate the pieces of sheet metal in the right position while other welds (known as re-spot) are additional welds added for structural integrity.
The evolution of operations at DAP's Body Shop from a manual Body Shop to an automated, capital intensive Body Shop has created some throughput issues. As shown in Figure 1, twelve main processes make up the process flow for a particular model.
Rear Fooe
Pan Skins
=
hSar
Pan Line .1 Stations/\
F~T1 CT Unen ( O C T L i n e)R e a r I P a n Load LH Apron -- -- - rBodq Sie Rkgh U-4oA ~ 4diatot
support -R Foot Stfuctute
Bodq Side Left-
-(edmn 8"uck Line)
Frafing - o ieNo. I g gept
(Convert Body Suok Line)
Pa n M etal F mnls in c oJsu e 0 e C oss u Ba o
The Rear Pan, Center Pan and Front Structure of the car's underbody are welded together at the "marriage point", just before the Underbody Line, a re-spot line. The underbody is also checked for dimensional control at this point. At the Clamp Line, additional welds, subassemblies and sealant are added to the underbody so that it is ready for the body side assemblies. Once the body sides a re a ttached a t t he B S U nload S tation, t he u nit g oes i nto t he F raming Line, w here i t i s clamped i n a fixture and r e-spot w elded i n o rder t o guarantee t he d imensional s pecifications. Later, the roof is positioned and attached by robots in the Roof Line, just to undergo a series of steps, mainly welds and metal finishing, in order to be ready and sent to the Paint Shop.
The plant machinery at the Body Shop was unstable and there was a lack of focus on preventive maintenance. Several years ago, Ford Motor Co. paid a great deal of attention to their Ford Total Productive Maintenance Program (FTPM). As the Ford Production System (FPS) emerged and was implemented in response to the competitive environment caused by facilities implementing Lean Manufacturing techniques, the people implementing FPS in the plant failed to integrate successfully the FTPM portion in the implementation process. In addition, DAP's Body Shop had gone through a couple of cost-cutting initiatives in which the maintenance manager in place reduced the head count of skill trades in order to show operational savings. Both former maintenance managers were promoted as part of their "successful" cost-cutting strategy just to leave the current maintenance manager with a clear shortage of human resources.
Figure 2 shows the percentage of the current Body Shop maintenance trade human manpower versus the required manpower. The required manpower was estimated by the plant, collecting the number of hours per year required for each preventive maintenance procedure needed for all the
production lines within the Body Shop. It is easily noticeable that manpower is low in every trade required. In total, maintenance skill trades manpower is covered at 34%
50% 43% 43% 33% 33% 31% 34% 20% 18 -- 11% 100% 90% 80% 70% 60% 50% 40% 30% 20% 10% 0% 0
Figure 2. Percentage of Required versus Current Maintenance Manpower Heads
The V.0. division started a 3-week FTPM Reenergization Program in which upper and middle plant managers, as well as skill trades, were involved in finding the root-causes of the problems and developed a plan of action. Most of the observations made in the final report clearly showed the lack of reliable data on which to back up the recommendations. Among its conclusions, the working group stated that "given the data that we have, downtime and production counts, [it] shows that our constraint [within the Body Shop] is up front (Front End, Rear Pan, & Underbody)". Besides, "[the] m ajority o f 1 osses are from equipment downtime and history at other plants that are running in automatic suggests that minor stoppages are the constraint, but we don't record and log the minor issues."
W a. 50% oi Required Manpower % ( Trade 0 Current Manpower lsql IK\ .K\ ej
.<41\q
I
le
Besides making two observations on inconsistencies between the real data and the data presented in the plant's value stream map, all the remaining 18 observations, recommendations and next steps had to do with the way the data had to be collected and analyzed.* It was obvious from the recommendations that the plant was lacking the necessary information to make data-driven effective decisions.
2.3 Focus Area: Rear Pan Line
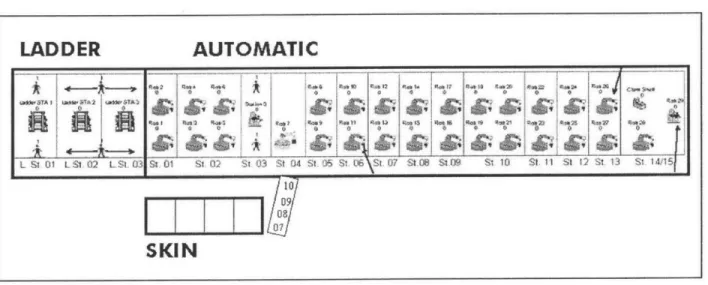
The Rear Pan Line assembles the bottom rear of the Mustang. The rear pan consists mainly of two support rails, two shock towers to position the shock absorbers and a rear sheet metal floor pan. Sedans and convertibles use the same rear pan while the Mustang Cobra version (sedan) has some additional parts added at the starting manual stations (i.e., extra positioners for seat belt buck). Figure 3 shows the layout of the Rear Pan Line.
LADDER
AUTOMATIC
0 "17 W k"is 0 .%* stf t * 01k a. * "2$ 2'
LSt 1 02 LSt 03 St 01 S6 02 St 03 St 64 St. 6 St 6 St. 07 St.08 St09 Sil1 1 t 1 St 12St3 S 141
10
SKIN
The Rear Pan Line consists of three main areas: Ladder, Skin and Automatic Areas. Ladder and Skin Areas feed the Automatic Area at Automatic Stations 1 and 4 respectively.
Ladder Area
The Ladder Area has three workstations and two operators to load the parts per side (one of the operators loads Ladder Station 2 and Station 3 every cycle). At Ladder Station 1, operators on each side load the support rails as well as two other small subassemblies. Operators taking care of Ladder Station 2 and 3 load the shock tower, seat belt buck and three other small subassemblies on each side. Operators manually feed all the rear pan parts (besides the rear sheet metal floor pan) in these first 3 manual stations.
Within the Ladder Area, welding cycles vary for each station. Operators start loading as soon as the cycle is completed in each of the stations. Nonetheless, the automatic welding cycle and activation of the overhead transfer will not happen until all the operators have pushed a button in their station signaling that their assigned station has been successfully loaded.
Operator over-cycle lights (lights that turn on when the operator has taken more than the required time to complete a cycle) are small and mounted to the equipment switchboards, far away from the operator's line of sight. The cycle time programmed for the over-cycle lights is wrong and none of the operators pay attention to it because of this error.
Skin Area
The Skin Area produces the sheet metal floor pan. It is an off-line cell with 4 stations and two operators (2 stations per operator). A mechanical conveyor with space up to 4 sheet metal floor pans link the Skin and Automatic Areas. The buffer is linked to the Automatic Area but extra skins produced can be stored, if desired, besides the conveyor #7 spot. The floor pan is added in Station #4 by a loading robot.
Automatic Area
The Automatic Area is a fully automated re-spot area with 15 stations: 26 weld robots, 2 unload robots and a stud welder referred to as the "clam shell".
Out of the 15 stations, only 3 perform a different activity than re-spot welding. Automatic Station 3 is a manual re-spot station that works as a "back up" station just before the sheet metal floor pan is added to the subassembly. Automatic Station 3 was not being used as a back up in reality. Full-time welders (one per side) were performing a couple of re-spot welds that were required b ecause o f s afety regulations. P rogramming t he w elds i nto Station 1 o r 2 s eemed t o have the potential to slow the line down, so the two operators remained on the line for the full seven months of the project.
Automatic Station 4 loads the sheet metal floor plan onto the line and Station 15 unloads the finished rear pan. At station 15, a material-handling robot loads the completed subassembly either to an electrified monorail buffer or to an off-line buffer. The off-line buffer can accumulate hundreds of additional completed underbody rears if desired. The finished rear pans
are then either placed in a buffer or married to the center pan and front structures at the "marriage" station just before the Underbody Re-spot line.
2.3.1 Policy Decisions that Affect Throughput
Peter Senge's book The Fifth Discipline4 describes several archetypes of behavior by using
system dynamics principles. System dynamics essentially uses the concepts of feedback theory to describe the effects of behavior and policy decisions. One of the archetypes in Senge's book is called Shifting the Burden. In the Shifting the Burden archetype, there are two possible policy solutions to implement: long and short-term policies. The long term, fundamental solution takes time t o c reate a 1 ong-lasting i mprovement, w hile t he s hort-term s olution creates a t emporary, quick improvement. As the short-term solution is utilized more often, the fundamental solution for the problem becomes less feasible and is used even less often. Over a long period, managers continue to depend on the short-term solution and never use the long-lasting improvement. Two policies used in the DAP plant demonstrate this shifting the burden archetype: the production overtime policy and the inventory policy. These two policies negatively affect the plant's throughput.
2.3.1.1 Production Overtime Policy
In the Production Overtime policy case (see Figure 4), the DAP Body Shop is trying to solve their throughput problem by building the scheduled amount of jobs each week. A portion of the throughput loss stems from poor equipment uptime that relates to incomplete preventative maintenance work orders and unscheduled continuous improvement projects on the equipment
for better reliability. This fundamental solution of scheduling maintenance time and manpower takes plant management discipline.
Productio Overtime
Jobs Buil
Preventive _ Maintenanc
Figure 4. System Dynamics Model for the Production Overtime Policy
On the other hand, DA-P Body Shop utilizes the short-term solution policy of scheduling production overtime to make up the lost units each week regardless of having a thorough understanding of the capacity constraining resources (CCRs) at the factory. While the overtime immediately builds the lost units, it further restricts available preventative maintenance (PM) time. The reduced efforts in PM create even lower throughput output during scheduled production because of greater equipment failure frequency. This warrants ever greater production overtime. The fundamental solution of PM is continually reduced while the short-term solution is reinforced. This vicious cycle continues as production works more and more weekends. At DAP Body Shop, it was not uncommon to see production people working in the Body Shop on both Saturday and Sunday. One way for the DAP Body Shop to ultimately increase their throughput is to eliminate overtime production in areas that are not CCRs and start reducing it gradually in CCR areas. During that same period, increase the amount of PM and equipment reliability projects. B y stressing the fundamental solution, m anagement c an improve the throughput and reduce overall plant overtime.
Unfortunately, the improvements from this solution are not seen immediately. The first effect of this suggested policy is in fact an increase in cost and only after several months do the cost savings start to accumulate.5 In addition, because of the limited Body Shop human resources, being able to perform all the PM required would probably mean having to increase the maintenance manpower and this would not be considered an e ffective recommendation at the time. Because of the current financial difficulties and the short life expected for DAP, plant management was unwilling to wait for the longer term solutions and basically was trying to operate the plant as a "cash cow" for the time remaining.
Therefore, it was necessary to come up with a solution that directed limited resources to the areas in the Body Shop that would create the most impact on net system throughput through the Paint Shop.
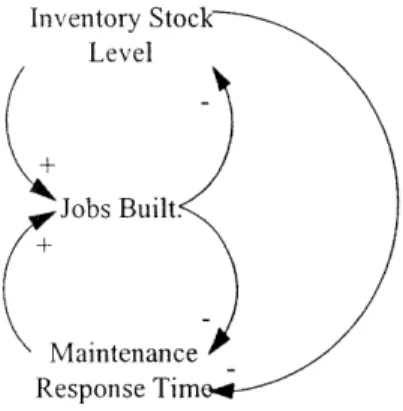
2.3.1.2 Inventory Policy
Another policy being practiced at DAP's Body Shop was to increase throughput by increasing the amount of inventory stocks in the off-line buffers between the major sub-assembly lines (see Figure 5). By buffering for all potential breakdowns, the Body Shop was able to meet better their daily production during the shift. Unfortunately, because of the large inventory stocks, the maintenance workers have little incentive to fix breakdowns quickly. The complacency of the maintenance worker increases the Mean Time to Repair (MTTR) of each station and reduces the amount of jobs built on the production line. This effect also depletes the jobs in the buffer ultimately affecting throughput. In order to prevent throughput losses from these breakdowns,
the off-line buffers are further increased, creating even more complacency in the maintenance worker. Inventory Stock Level + c Jobs Built. Maintenance_ Response Tim
Figure 5. System Dynamics Model for Inventory
The off-line inventory itself can also create throughput problems. For example, the front structures were stored on the floor outside of inventory racks. The parts on the floor in some instances can become bent or damaged. When these damaged parts are re-entered into the assembly process, they do not fit properly in the tabbing station and the machine shuts the skid system down. Again, by stressing the fundamental solution of improving response time and also reducing the amount of inventory in the plant, management can improve the system throughput although, the benefit of these actions will have a delay.
2.3.1.3 Summary
The use of system dynamics archetypes can help management recognize the long term effects of certain policy decisions. DAP has currently been using two short term solution policies in the Body S hop t o a ttain t he n ecessary t hroughput e ach d ay. By s hifting t heir p olicies t oward t he long-term solutions, they can ultimately solve their throughput issues and save overtime and inventory holding costs.
Chapter 3: Theory of Constraints and Lean Manufacturing
First, we discuss serial production systems, including a discussion of the blocked and starved states and the importance of buffers and inventory with respect to throughput. Then we describe briefly and compare the Theory of Constraints and the Lean Manufacturing System. At last we state both methods applicability to the Rear Pan Line.
3.1 Serial Production Systems
A serial production system is comprised of manufacturing operations in a sequential order. Buffers s toring p arts for the following s tation c an e xist b etween o perations. E ven when m ost assembly plants do not strictly follow a serial production line as some of the parts may feed into the line from a different subassembly line, the modeling of serial production systems is the basic building block for developing more complicated models.
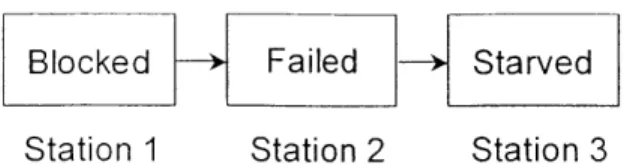
In coupled stations, one station immediately feeds a part into another station, while in decoupled stations; the two stations are separated by a buffer. There are three states for machines that negatively affect the throughput of an assembly line -failed, blocked, and starved.
When a machine fails, it can affect the state of other operations around it. For example in Figure
6, there are three stations coupled without a buffer. When Station 2 fails, it directly affects the state of the other two stations. Station 1 has finished its job but has no place to put it because Station 2 has failed. Station 1 is blocked. Similarly, Station 3 cannot build because Station 2 is down and is not feeding it parts. Station 3 is waiting, it is considered starved by Station 2.
Blocked Failed Starved
Station 1 Station 2 Station 3
Figure 6. Three Coupled Stations Without a Buffer and their States
When stations are coupled together, one failed station will either block or starve the remaining stations. As a result, any failure within the coupled group will affect the throughput of the last station and therefore the line as a whole.
One solution for increasing throughput is to add buffers to the system. Let us now assume that we place a buffer between Station 2 and Station 3 (Figure 7) and that this buffer contains some work in process (W.I.P.) in it. Now, when Station 2 fails, Station 1 remains blocked but station 3 can still operate because it pulls jobs out of the buffer. Later, if Station 3 breaks down, Stations 1 and 2 can build jobs until the buffer fills up. Previously this would have blocked Stations 1 and 2. Now these stations can build jobs into the buffer until the buffer becomes full.
Blocked Failed W.l.P. Running
Station 1 Station 2 Buffer Station 3
Figure 7. Three Stations with a Buffer and their States (Station 2 & 3 Decoupled)
The purpose of inventory is to cope with the variability of the system. The greater the system's variability, the greater the inventory levels required. Since machines do breakdown occasionally, inventory can compensate for these breakdowns and assist in leveling throughput. The advantage of inventory is clear, yet much has been written about the "evils" of inventory under the Lean
Manufacturing System. One of the Lean Manufacturing System strategies is to eliminate waste by reducing inventory. A mong many o ther disadvantage of having inventory w e c an mention that there are higher levels of scrap due to damaged parts in inventory, long delays between discovering faults and correcting them, higher inventory holding costs and cost of transportation as well as slower response times of operators and maintenance trades due to high buffer sizes.
To maximize the effectiveness of buffers, one must balance the buffer's disadvantages with its throughput advantages. Having too much buffer results in high costs while having too little buffer also increases costs due to many blocked and starved conditions restricting output. When designing a Body Shop, the engineers must consider these inventory issues to optimize the assembly facility. From a throughput perspective, the best assembly system keeps each station working when it is not in a failure mode. Therefore, no station in the system is blocked or starved due to any other station's failure. Managing these blocked and starved conditions in the real world is critical to improving total system throughput.
3.2 Theory of Constraints
TOC was developed by an Israeli physicist named Eliyahu Goldratt. Dr. Goldratt developed this management philosophy to aid companies in optimizing the overall system, rather than optimizing parts of a system. Its goal of making money can be stated in terms of three metrics: increase throughput while simultaneously reducing both inventory and operating expense.3 The concept of simultaneity indicates a focus on optimizing the organization as a whole rather than on local optimums.
Thus, at a high level, an organization should be concerned about increasing net profit, while simultaneously increasing both ROI and cash flow.3 At a plant level, an organization should utilize the following metrics: throughput (rate at which the system generates money through sales), inventory (all the money that the system invests in purchasing things the system intends to sell), and operating expense (all the money the system spends in turning inventory into
6
throughput).
A bottleneck or constraint is the operation with capacity that is equal or less than the demand placed on it,3 or anything that limits a system from achieving higher performance versus its goal. The Theory of Constraints focuses on finding the location and managing the bottlenecks in any system. A constraint can be any part of the entire system and may be found in the market, materials, capacity, logistical areas, and management or behavioral areas. A bottleneck typically refers t o a c onstraint i n t he m anufacturing p rocess. T his r esearch i s focused p rimarily o n t he entire manufacturing system rather than the system of a corporation as a whole, and therefore the terms bottleneck and system constraint are used interchangeably. A work station can become the manufacturing system's bottleneck due to a wide variety of reasons: low cycle time or high downtime, excessive material blocking the operation of the work station, poor material replenishment systems that cause the work station to starve frequently, etcetera.
A key insight of TOC is that only a few work centers within the factory control the output of the entire factory for each product line. Managing these capacity constraining resources (CCRs) or bottlenecks optimizes the output of the factory.
To increase the throughput, one must have a clear understanding of where it is constrained and an understanding that throughput improvement efforts at points in the system other than at the bottleneck will have no impact on the throughput.
Sometimes the true bottleneck is not the station with the greatest amount of downtime due to the buffers in the system. When this case occurs, much effort tends to be placed by management on the station with the most downtime, resulting in little overall effect on system throughput. Resources focused on a bottleneck are well placed and will have an impact on the system. Resources focused on non-bottleneck processes are not well placed and will likely lead to frustration when it is recognized that the system is not impacted. Another important issue is to never starve the bottleneck. Whenever a bottleneck is starved, the losses in throughput as a result of starving pass directly through the system and affect the system's throughput. Knowledge of the plant's CCRs also provides guidance for future plant investment. The identification of constraints also shows where setup reductions and process improvement efforts should be focused.
The suggestion is to do CCR determination by simply walking through the shop and observing where inventory has piled up3. Other sources for insights on the CCR determination are the shop floor personnel, the master scheduler and, in case there is, a list of machines that are candidates for capacity improvement. The initial set of bottlenecks will change as TOC is implemented, so perfect accuracy is not necessary. The Pareto rule is used to determine CCRs, and explore candidates for setup improvement. The 20% most heavily loaded work areas are assessed as potential bottlenecks.
In an automotive assembly plant, one tends to see multiple bottlenecks due to the low reliability of the substations and the balanced designed cycle time of the assembly processes. The design of the tooling tends to equalize the capacity at each machine. Therefore, low equipment reliability at the tooling, stemming from machinery complexity, can produce multiple bottlenecks in the system. These multiple bottlenecks can ultimately affect the throughput of the whole system. The buffering used in the system plays a factor in whether certain stations become one of the bottlenecks.
3.2.1 Measurement Systems
To keep the system in synch with the constraint, TOC develops the concept of Drum-Buffer-Rope (DBR).6 This essentially involves tying a "rope" from the slowest process in the system to the first process. There will be no dispersion behind the slowest process since those behind it will have the capacity to catch up. The only spreading that will occur will be in front of the slowest process, but the length of the buffer will control that. This gap in front of the slowest hiker is a buffer against the disturbances of the preceding processes. It is apparent that in this method you can avoid the detrimental effects of statistical fluctuations. The slowest process' pace becomes the drumbeat for the entire system. A key to implementing the DBR system is the appropriate sizing of buffers so that the entire plant is protected, not the individual operations. If the actual buffer equals the planned buffer, then the buffer size is too large and should be reduced. The point, though, is to never starve the constraint.
Efficient data management is crucial to the effectiveness of any TOC management system. Understanding where the constraints are and understanding when to release material into the system r equires d ata t hat i s c ollected f or t hat s pecific p urpose. D ata i s t ypically c ollected f or financial reporting purposes and may not provide the exact type of information that is necessary to i dentify c onstraints. S ystems m ay n eed t o b e developed t o e nable t he i mplementation o f a drum-buffer rope material control system.
3.2.2 Process of Ongoing Improvement
Working from a base of appropriate metrics, bottleneck management, and employing DBR to account for the combination of dependent events and statistical fluctuations, TOC boils down to the following process of ongoing improvement (using the terminology of the system to be
improved) 7:
1. Identify the system's constraints: It also means to prioritize them according to their impact on the goal; otherwise many trivialities will sneak into the next step.
2. Decide how to exploit the system's constraints: We should manage the system's resources so that everything that the constraints are going to consume will be supplied by the non-constraints.
3. Subordinate everything else to the above decision.
4. Elevate the system's constraints7 : we only need to be aware that if we continue to elevate a constraint by increasing its throughput, there must come a time when we break it.
5. If in the previous steps a constraint has been broken, go back to step 1, but do not allow inertia to cause a system constraint: Every manager is overwhelmed with problems, or as some would call it opportunities. We all tend to concentrate on taking corrective actions that we know how to take, not necessarily concentrating on the problems we should correct and the actions needed to correct those problems. Thus, if a process of ongoing improvement is to be effective, we must first of all find what to change. In other words, the first ability that we
must require from a manager is the ability to pinpoint the core problems, those problems that, once corrected, will have a major impact, rather than drifting from one small problem to another, fooling ourselves into thinking that we are doing our job.
The following steps are equivalent to the above five steps, but are expressed in the terminology of the improvement process itself 7:
1. What to change? Pinpoint the core problems!
2. To what to change to? Construct simple, practical solutions!
3. How to cause the change? Induce the appropriate people to invent such solutions!
The process of ongoing improvement acts as a method for eliminating the disruptions that cause the holes in the constraint buffers so that inventory can be reduced.6 As the buffers are decreased,
since t hey c ontain t he majority o f t he w ork-in-process i nventory, t he c ompetitive e dge o f t he plant is increased.
3.3 Lean Manufacturing
Since the early 1980's, American manufacturing firms have been under close examination. The widespread t raditional mass p roduction sy stem u sed b y t hese firms, find i tself i n c ompetition with a new set of ideas pioneered by Japanese companies such as Toyota, and grouped under the term "lean production".8 This new method of manufacturing has been so successful against the world's industrial giants, that many U.S. firms are reengineering their operations to take advantage of these powerful ideas. The Ford Motor Company, whose founder's name is almost synonymous with mass production, is not an exception and started to undertake the change under their Ford Production System.
The differences between mass and lean production are striking. Traditional production systems are designed to manufacture standardized products at very high volumes, using expensive, single-purpose equipment and a low-skilled workforce. Lean production seeks instead to be able to produce a high variety of products using flexible equipment and multi-skilled teams. The focus is on zero defects, zero inventory, and on reducing costs. Toyota is perhaps the best known of the lean producers, and provides Ford with an impressive benchmark for its own production system.
Making money today and in the future is also the motive behind Lean Manufacturing. It is built on the foundation that the market sets the selling price of a good, and the way to increase profits is to reduce costs by the elimination of the seven categories of waste (motion, defects, conveyance, overproduction, waiting, processing and inventory) and provide customer satisfaction.
Lean Manufacturing aims at providing high quality, low cost products with volume and mix flexibility in response to customer requirements. It consists of a set of concepts: all of which are applicable in some environments; some of which are applicable in all environments. Following is a list of some lean manufacturing concepts:
Just In Time (J.I.T.): producing what you need, when you need it, in the quantities you need. Production is triggered or pulled by customer demands.
Jidoka: human-like qualities that equipment must have to ensure that defects are not passed on to subsequent operations.
Pokayoke: "fool-proof' or "error-proof' devices to help prevent defects.
Kaizen: its English translation is improvement. Kaizen is viewed as a never-ending, continuous process.
Standardized Work: defining and following the motions and actions for each operation can reduce variability. Improvements can be made afterwards.
Man/Machine Chart: the chart combines an operator's work and walking times with equipment operating times. By considering different work combinations, efficient Standardized Work can be developed.
Takt Time: the available production time divided by the number of parts required by the customer. It is a key element in the design of a lean manufacturing system since it defines the pace for the production system.
Kanban: its English translation is signboard.* A tool to visually convey information. Kanban are used as a tool for pull systems in JIT operations.
Heijunka: refers to scheduling production loads at a level schedule for each day, week, and month to eliminate peaks and valleys in manufacturing**.
Setup Time Reduction: the time elapsed from the instant that the production of unit A finishes, to the instant that the first good unit of B is produced. Reduction of setup time is a requirement for s uccessful i mplementation o f Lean M anufacturing, a nd i nvolves t he use of techniques such as Shingo's Single Minute Exchange of Dies (SMED). Having predictable, efficient setups allows for better utilization of people and equipment, and better response to changes in customer demand.
Flow Operations/Cell Layouts: dissimilar machines are grouped into a flow line9, or cellular layout. The objective is to achieve one-piece flow.
Andon: tools for visual communication. Typically, colored lights that indicate the status of a machine or line.
Worker Involvement: an essential part of lean manufacturing. Improvement potential will be achieved, only by utilizing the experience and abilities of the people who actually perform the work. An environment of continuous improvement is only possible when
the workforce is engaged in the concepts of lean manufacturing.
3.4 Theory of Constraints versus Lean Manufacturing
In this section's introduction, TOC and Lean Manufacturing were described as basic philosophies for running a plant. While this is an acceptable frame of reference, we must further identify the similarities and differences between TOC and Lean Manufacturing before we can truly understand their usefulness. The following points are viewed as the most significant
similarities and differences.
3.4.1 Similarities
Both systems try to maximize profits. TOC seeks system responsiveness to the customer's needs by providing on time delivery of high quality, low cost products. Lean Manufacturing tries to deliver the right product at the right quantity, at the right time and price (by accepting that the market sets the price).
Both systems view the survival and ability of the organization to make money as being dependent on the process of continuous improvement. TOC calls it "A Process of Ongoing
Improvement" while Kaizen is p art o ft he foundation o f Lean M anufacturing.
TOC's concept of the drum as the pace setter is analogous to the Lean Manufacturing concepts of heijunka and takt time while the rope which ensures that operations with excess capacity do not overproduce is equivalent to the kanban. While both systems address pace setting, TOC recognizes the process bottleneck as the controlling factor for pace; Lean Manufacturing recognizes customer demand as the controlling factor for pace.
Like JIT, TOC assumes a stable environment. A plant should have a stable order mix and given resources before implementing.10 TOC's buffer concept is central to mitigate the effects of combinations of dependent events and statistical fluctuations. Lean Manufacturing makes use of one-piece flow, where at all possible. Besides, its supermarket concept and the allocation of appropriate numbers of kanban between processes serve the purpose of absorbing the effects of disturbances.
At last, both philosophies view worker wages as a sunk cost and worker idle time during production as a sign of efficiency. Goldratt indicates in The Goal that "a plant in which everyone is working all the time is very inefficient".3 Dr. Goldratt distinguishes between 'utilizing' a resource which helps move the system toward the goal and 'activating' a resource which does not.3 Similarly, Shingo explains that Toyota's basic philosophy is that it is better to allow workers to be idle than to overproduce."I
3.4.2 Differences
Within manufacturing, Lean Manufacturing is most useful for the production of medium to high volume repetitive parts or part families, and not so useful in a job shop that makes individual, one-of-a-kind parts. TOC, though, is more flexible and can be effectively utilized in both situations since, regardless of the volumes; there will always be a bottleneck process. Another reason is that TOC is actually less sensitive to changes in the production plan than Lean Manufacturing J.I.T.'s concept. Production plan changes are analyzed in terms of their impact upon the CCR, which highlights any problems. Simulation of the factory can be carried out in the scheduling process.1 2 13 Capacity changes in the CCRs can also be simulated. This permits the planner to anticipate impact of changes in demand, schedules or work center capacities. J.I.T., on the other hand, reacts to the actual results of the change. In Lean Manufacturing, a disturbance can immediately shut down the entire system. In TOC the system is protected from disturbances to a certain point.6
TOC is a push system downstream from the CCR and a pull system upstream from the CCR. Obviously, if the market is the constraint, then the whole factory is a pull system, as it is for the Lean JIT concept. But TOC is flexible, and the CCR may be located anywhere in the factory.
In terms of process flow, Lean Manufacturing is most applicable to cellular production; whereas, TOC is most easily applied to serial flows. If a process flow is highly serial, bottlenecks can be found with relative ease by analyzing starved, blocked, and downtime data.