HAL Id: hal-01992164
https://hal.archives-ouvertes.fr/hal-01992164
Submitted on 24 Jan 2019
HAL is a multi-disciplinary open access
archive for the deposit and dissemination of sci-entific research documents, whether they are pub-lished or not. The documents may come from teaching and research institutions in France or abroad, or from public or private research centers.
L’archive ouverte pluridisciplinaire HAL, est destinée au dépôt et à la diffusion de documents scientifiques de niveau recherche, publiés ou non, émanant des établissements d’enseignement et de recherche français ou étrangers, des laboratoires publics ou privés.
An indicator of intensity of cyclone activity at country
level
Sosso Feindouno, Michaël Goujon, Olivier Santoni
To cite this version:
Sosso Feindouno, Michaël Goujon, Olivier Santoni. An indicator of intensity of cyclone activity at country level. 2018. �hal-01992164�
fondation pour les études et recherches sur le développement international
LA FERDI EST UNE FOND
ATION REC ONNUE D ’UTILITÉ PUBLIQUE . ELLE ME T EN ŒUVRE A VEC L ’IDDRI L ’INITIA TIVE POUR LE DÉ VEL OPPEMENT E
T LA GOUVERNANCE MONDIALE (IDGM).
ELLE C
OORDONNE LE LABEX IDGM+ QUI L
’ASSOCIE A U CERDI E T À L ’IDDRI. CE TTE PUBLIC ATION A BÉNÉFICIÉ D ’UNE AIDE DE L ’É TA T FR ANC AIS GÉRÉE P AR L ’ANR A U TITRE DU PR OGR A MME « INVESTISSEMENT S D ’A VENIR » POR TANT LA RÉFÉRENCE « ANR-10-LABX -14-01 »
poli
cy brief
Summary
We propose an indicator of the intensity of cyclone activity
calculated at country level by year. This simple metric uses
historical geolocalized data on cyclones, particularly their
power and position from which we deduct the affected share
of the country area, and their duration. This indicator is
calculated (and is nonzero) for 128 countries and territories over
1970–2014. It can be used for cross-country comparison of
vulnerability to cyclone activity, which is considered as one of
the important consequences of climate change.
Sosso Feindouno, PhD in economics at FERDI. Email: sosso.feindouno@ferdi.fr
Michaël Goujon, Senior Lecturer, Clermont Auvergne University – CERDI, Head of Programme at FERDI. Email: michael.goujon@uca.fr
Olivier Santoni, Geomatics Specialist at FERDI. Email: olivier.santoni@ferdi.fr
An indicator of intensity of
cyclone activity at country level
Sosso Feindouno
Michaël Goujon
Olivier Santoni
note brève
December2018180
1. Introduction
The last decades have been marked by considerable human and economic dam-ages due to storms 1. Any increase in the human and economic impact of storm
activity can be explained by a strong demographic growth as well as a larger share of population, infrastructure and activities located in coastal areas, but also by the amplification of storm activity (Doocy et al, 2013). Indeed, the reports of the Intergovernmental Panel on Climate Change (IPCC) indicate that one of the likely consequences of climate change could be an increase in the frequency of storm events, or at least an increase in their intensity (see also Knutson et al, 2010). A significant correlation was found between the warming of ocean surface and an increase in the storm intensity (Emanuel, 2005).
The objective here is to present a simple metric that we have developed in order to compare the vulnerability of the countries and territories facing storm activity 2. This indicator is a measure of the country physical vulnerability only, not
of the economic impacts that also depend on the location of population and activi-ties within the territory, but also on its early-warning and protection systems 3. The
primary data that we use are geolocalized data of every storm from the interna-tional database IBTrACS, which we treat in order to match them with the affected territories for which the indicator is calculated. Our indicator is simple and easily computable and replicable, while based on scientific parameters for the power of storm activity. It uses the wind speed (or the storm power), the duration and the size in terms of share of the territory that is affected by the storm. Finally, the indi-cator is computed at annual frequency for a broad set of countries and territories, and therefore allows a comprehensive comparison between these territories, and possibly the assessment of changes over time.
2. IBTrACS data
Primary data are provided by the National Oceanic and Atmospheric Administration (NOAA), specifically the National Climatic Data Center – International Best Track 1. In the following, we use interchangeably the terms storm (generic name) and cyclone used in the
NOAA-NCDC-IBTrACS database.
2. A component of cyclone activity was introduced in the synthetic “physical vulnerability to climate change index (PVCCI)” developed by Guillaumont and Simonet (2011, 2014), Closset et al (2017). This index has been presented by Patrick Guillaumont in October 2015 at the annual meetings of the World Bank and the IMF in Lima, in December 2015 at the COP21 in Paris, and in November 2016 at the COP22 in Marrakech.
3. Physical and economic damages of cyclones can take several forms. First, the cyclones can damage buildings, infrastructure and agricultural crops. High precipitation associated with cyclones can cause floods and landslides in steep areas. Finally, the fierce winds on the surface of the oceans cause sea-level rise and storm surges in coastal areas.
2 Policy brief n°180 S. F eindouno , M. G oujon & O . S an toni
Archive for Climate Stewardship (IBTrACS): http://www.ncdc.NOAA.gov/ibtracs/ 4.
We use the “polygon” version v03r07, where every storm is registered for every af-fected territory through which it passes. This database is published by the UNEP/ GRID-Geneva (http://preview.grid.unep.ch/) 5, while IBTrACS initially only provides
the path line of the eye of the cyclone 6.
This database covers the period 1970-2014 and records 2 485 storm episodes of categories 1 to 5 on the Saffir-Simpson hurricane scale that ranks storms based on their wind speed 7. The primary database also lists the events of lesser intensity
or “tropical storms”, that we note “class 0” 8, bringing the total number of events to
3 915.
These data are widely used in studies on global storm activity, and particu-larly by the IPCC experts, even if they are not exempt from criticism (Holland and Bruyère, 2014). Notably, data prior to 1980 could be weakly reliable because of the low accuracy of measurement tools at that time.
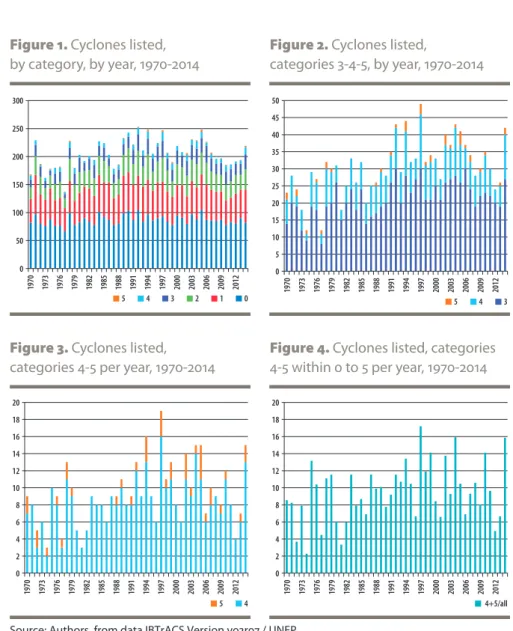
Figures 1 to 4 present the total number – worldwide – of storms recorded in the IBTrACS database, and the numbers by category over 1970-2014. Focusing on the period 1990-2014, trends are difficult to identify. We detect no significant trend over 4. As explained on the IBTrACS website (on May 24, 2018): “The intent of the IBTrACS project is to over-come data availability issues. This was achieved by working directly with all the Regional Specialized Meteorological Centers and other international centers and individuals to create a global best track dataset, merging storm information from multiple centers into one product and archiving the data for public use. One of the goals of the project is for the data processing methods to remain open, such that desired user feedback on data quality is more easily collected. Also, data provenance is completely recorded so all observations and corrections, either through rigorous quality control or user feedback, may be tracked. Data are then provided in various formats given the diversity of the tropical cyclone (TC) data user community. The World Meteorological Organization non-gonvernment domain Tropical Cyclone Programme has endorsed IBTrACS as an official archiving and distribution resource for tropical cyclone best track data. The IBTrACS project: Contains the most complete global set of historical tropical cyclones available; Combines information from numerous tropical cyclone datasets; Simplifies inter-agency comparisons by providing storm data from multiple sources in one place; Provides data in popular formats to facilitate analysis; Checks the quality of storm inventories, positions, pressures, and wind speeds, passing the information on to the user.
5. In 2011 UNEP/GRID-Geneva published a risk map using those data. First, the 2010 GDP was allocated according to the population distribution and then intersected with 1970-2009 cyclones footprint to obtain a single-year exposure of economy to tropical cyclones without time evolution (http:// preview.grid.unep.ch/index.php?preview=data&events=cyclones&evcat=6&lang=eng). Then this data is converted into a risk map from 1 to 5 regarding to, for each country, the part of GDP exposed in each 10X10 km cell (http://preview.grid.unep.ch/index.php?preview=data&events=cyclones&ev cat=7&lang=eng).
6. IBTrACS v03r10 is the last release of IBTrACS version 3. The next release (Sept. 2018) will be in the new IBTrACS version 4 format.
7. More precisely the minimum sustained speed observed. Category 1 includes events in which the winds reach speeds from 119 to 153 km/h, category 2 from 154 to 177 km/h, category 3 from 178 to 210 km/h, category 4 from 211 to 251 km/h, category 5 exceeds 251 km/h (Saffir-Simpson Hurricane Wind Scale: http://www.nhc.noaa.gov/aboutsshws.php). There is currently no official category 6 but in view of the increase in the intensity of hurricanes in recent years, some experts have suggested the creation of this category for hurricanes which winds reach more than 280 or 287 km/h (including a few cyclones with the majority located in the West Pacific, as the Typhoon Tip in 1979 with winds blowing at over 310 km/h).
8. The speed of the winds is included between 63 and 118 km/h.
3 Policy brief n°180 S. F eindouno , M. G oujon & O . S an toni
this period for all events of category 0 to 5, except a possible ten-year cycle (figure 1). Evolution is erratic for events of categories 4 and 5, for which occurrence varies greatly from year to year (figure 2 and 3). The diagnosis is the same for the share of the events of categories 4 and 5 in all categories events (figure 4). An overview of the worldwide location of storm activity is presented in Figure 5.
Figure 1. Cyclones listed,
by category, by year, 1970-2014
Figure 2. Cyclones listed,
categories 3-4-5, by year, 1970-2014
Figure 3. Cyclones listed,
categories 4-5 per year, 1970-2014
Figure 4. Cyclones listed, categories
4-5 within 0 to 5 per year, 1970-2014
Source: Authors, from data IBTrACS Version v03r07 / UNEP 4 Policy brief n°180 S. F eindouno , M. G oujon & O . S an toni
Figure . Number of cyclones over the period 1970-2014
Notes: Number of cyclones (regardless of intensity). Sources: Authors, from IBTrACS data Version v03r07 / UNEP
3. Construction of the indicator of storm intensity
by country-year
The destructive power of a storm depends on the speed of the winds, or on its category that varies along its life. But, it also depends on its time span, on the size of the aff ected areas, and on the local geographical features, i.e. on the exposure of the aff ected territory (elevation in the case of coastal areas, or land slope in the case of mountainous areas). The destructive impact extends to areas beyond the eye and is not spatially uniform. Moreover, the duration and the size of the cyclone have no systematic links with the speed of the winds.
In the IBTrACS / UNEP database, the complete trajectory of every storm is reg-istered (geolocalized), starting with its birth in the ocean (low intensity-category), then when it approaches and reaches lands (usually with its maximum intensity-category), and fi nally until its death, usually in the lands (low intensity-category). Every storm event is therefore registered under diff erent categories according to the Saffi r-Simpson scale (logically, under its maximum intensity-category and all the lower intensity-categories). For example, a storm of a maximum category of 3 is registered in the IBTrACS - UNEP database in the form of 4 events or storm-categories, from 0 to 3, of diff erent durations, sizes, and localization.
The IBTrACS – UNEP database provides the geolocalization of each storm-category, with the geographic breakdown of aff ected territories (as polygons). These territories being identifi ed by their ISO 3166 code, it is possible to assign to each territory all storms having aff ected it.
5 Policy brief n°180 S. F eindouno , M. G oujon & O . S an toni
The perimeter (polygon) by country allows us to calculate the surface affected by each event 9. Each storm experiences during its life different intensity periods, so
it is represented by as many polygons as categories by which it manifested itself. The database also gives the dates (days) and duration (hours) associated with these event-categories.
From polygons, we calculate the sum of the areas of the country affected by each event- category; an affected area being counted repeatedly as many times as it was affected by different event-categories. We then compute the share of the affected areas to the total area of the country.
For each event-category affecting a country, we therefore have its date, its duration and the share of the country it affected.
The indicator that we propose is based on the principle that the intensity of the storm event, at the country level, depends on its category (related to wind speed and pressure), but also on its duration and on the area of the affected terri-tory (event size). A measure of intensity can be defined for each event-category- affected country by year, as:
IIC
kjit=
D
kjitxS
kjitWith for country i at period t, the event j (a country being possibly affected by several events at the period t) and k the storm-category (6 possible categories from 0 to 5, as the same storm may move through different categories when affecting the country), D the duration of the event-category (in hours), S the share of the country affected by the event-category (in %).
For each country-year, we can calculate the index by event, by summing the event-categories:
IIC
jit=
α
kxD
kjit xS
kjitα
is the relative weight of the category compared to others based on its relative power or intensity.If the country is affected by several events in the year, we simply add the events. The general formula is then:
IIC
it=
α
kxD
kjit xS
kjitWith j the event (number = n) in country i at period t, k the categories of the event (6 possible categories from 0 to 5).
It remains to determine the weight assigned to the cyclone categories that should reflect the relative power of cyclone events. There are several measures or scales for storm intensity or power used to measure its destructive power, beyond 9. All data manipulations were carried out with the software ArcGIS 10.2.
6 Policy brief n°180 S. F eindouno , M. G oujon & O . S an toni
the 1-to-5 Saffir-Simpson intensity scale that is considered as too simple. These measures are based on the principle that the destructive power of the storm is more than proportional to the wind speed that it generates, following a nonlinear function. We retain this principle to determine the weight assigned to the storm categories.
Among the best known of these measures are the Power Dissipation Index (PDI) proposed by Emanuel (2005), which is based on the cube of the maximum speeds, and the Accumulated Cyclone Energy (ACE) proposed by Camargo and Sobel (2005), which is based on the square of the maximum speeds (see box 1).
We take these non-linear functions of the PDI and the ACE to set the weights
α
k of the storm categories in our index. These weights are reported in table 1 with the minimum speed of each category. We assign a standardized weight equal to 1 to the minimum speed of the category 0. In the column ‘weight V’, following a linear formula, the weight of the upper category is equal to the ratio between its minimum speed and the minimum speed of the category 0. In the last two columns, using the non-linear formulas of the ACE (and the PDI) based on the square (cube) of the speed, the weight of the upper category is equal to the square (cube) of the weight V.4. An overview of the results
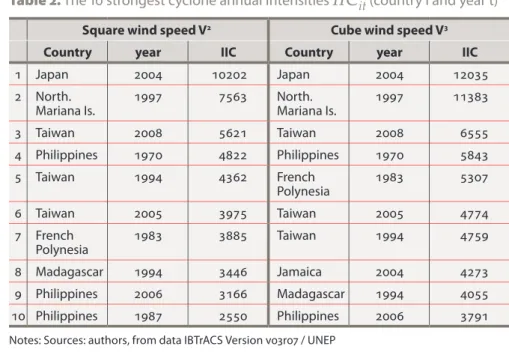
We apply the calculation of the annual IIC using the data of 3915 storm events recorded in IBTrACS over the period 1970-2014. 128 countries and territories have been affected by cyclone activity over this period. However, relative intensities vary dramatically from one country to another. Obviously, the most affected ter-ritories are islands (and coastal terter-ritories), but not necessarily the smaller ones (table 2, figure 7 and 8). At the regional level, the most affected territories over the period are located in the Northwest Pacific: Japan, Philippines, Taiwan, the Northern Mariana Islands (and to a lesser degree Guam). They are followed by Vanuatu and New Caledonia (Southwest Pacific), Madagascar and Mauritius (Indian Ocean), and Cuba (Caribbean). 7 Policy brief n°180 S. F eindouno , M. G oujon & O . S an toni
Box 1. Measures of the power of a cyclone
The Saffir-Simpson scale is based only on the speed of the wind (minimum speed recorded on one minute) but is also indirectly used to anticipate the damage (Saffir-Simpson Hurricane Wind Scale: http://www.nhc.noaa.gov/ aboutsshws.php). However, this scale is considered too simple (and discrete, which can be encompassed by a continuous measure), or even wrong, since some cyclones of lower category are actually more destructive than cyclones of higher category, including because they show a longer lifetime). Other mea-sures or scales of cyclone intensity have then been developed to overcoming the Saffir-Simpson scale.
Emanuel (2005) defines a simplified version of the “Power Dissipation Index” (PDI) as the integral of the cube of the maximum sustained wind speed over the lifetime of the cyclone:
PDI =
dt
where Vmax is the maximum sustained wind speed measured at the con-ventional maximum height of 10 meters. According to Emanuel, while not perfect, this index is a better indicator of cyclone threat compared to the frequency (number) or intensity (category). This index is similar to the index of Accumulated Cyclone Energy (ACE), defined as the sum of the square of the maximum wind speed over the period of observation (Camargo and Sobel, 2005). The PDI thus takes into account the intensity and duration of the event (duration is relatively linked to the size of the cyclone).
Other more complex indicators have been developed to measure the de-structive potential of a cyclone, such as the “Integrated Kinetic Energy” (IKE) which takes into account the size of the cyclone (Powell and Reinhold, 2007) and the ‘Track Integrated Kinetic Energy’ (TIKE) that is the accumulation of the IKE over the lifetime of the cyclone (Misra et al, 2013). These indicators however do not take into account the spatial distribution of the winds which affects the destructive potential of the cyclone.
These measures are applied at the cyclone-level (that is, not at the affected territory-level) using the maximum speeds of the winds throughout the lifetime of the cyclone. They require complete information about all wind speeds and duration throughout the lifetime of the cyclone, which is not available for all the cyclones. The database IBTrACS that we use do not provide all this information, but only the Saffir-Simpson categorization that is based on minimum and not maximum speed reached by the winds generated by the cyclone.
Consequently, from these formulas we only retain the principle of the non-linear relationship (square or cube) between the category or wind speed and the power for our weighting system.
8 Policy brief n°180 S. F eindouno , M. G oujon & O . S an toni
Table 1. Alternative weight systems Category Saffir-Simpson Minimum speed (km/h) Saffir-Simpson
Weight V Weight V2 Weight V3
0 63 1 1 1 1 119 1.87 3.5 6.5 2 154 2.44 6 14.5 3 178 2.82 8 22.4 4 211 3.33 11.1 36.9 5 252 3.96 15.7 62.1
Figure 6. Cumulated weighted cyclones located on lands (weighted by their
intensity based on the square of the wind speed), over the period 1970-2014.
Notes: Sources: authors, from data IBTrACS Version v03r07 / UNEP
9 Policy brief n°180 S. F eindouno , M. G oujon & O . S an toni
Table 2. The 10 strongest cyclone annual intensities
IIC
it (country i and year t)Square wind speed V2 Cube wind speed V3
Country year IIC Country year IIC
1 Japan 2004 10202 Japan 2004 12035
2 North.
Mariana Is. 1997 7563 North. Mariana Is. 1997 11383
3 Taiwan 2008 5621 Taiwan 2008 6555 4 Philippines 1970 4822 Philippines 1970 5843 5 Taiwan 1994 4362 French Polynesia 1983 5307 6 Taiwan 2005 3975 Taiwan 2005 4774 7 French Polynesia 1983 3885 Taiwan 1994 4759 8 Madagascar 1994 3446 Jamaica 2004 4273 9 Philippines 2006 3166 Madagascar 1994 4055 10 Philippines 1987 2550 Philippines 2006 3791
Notes: Sources: authors, from data IBTrACS Version v03r07 / UNEP
Figure . World map of IICi, cumulated over 1970-2014: IICi
Notes: Sources: authors, from data IBTrACS Version v03r07 / UNEP 10 Policy brief n°180 S. F eindouno , M. G oujon & O . S an toni
Figure 8.
IIC
i by country, accumulated over the period 1970-2014:IIC
it
Notes: in red IC using cube wind speed, in blue IC using square wind speed. Countries are reported if > 400. Sources: Authors, from data IBTrACS Version v03r07/UNEP.
11 Policy brief n°180 S. F eindouno , M. G oujon & O . S an toni
Conclusion
Most reports on climate change predict that the intensity of cyclone activity should increase with the increase in average global temperatures. However, cyclone activ-ity and its change overtime are and will be different according to the regions and countries. To take into account different factors defining the intensity of cyclones, it is important to measure cyclone activity through an index that goes beyond the simple measure of the wind speed observed on the Saffir-Simpson scale. Here we propose an index of the intensity of cyclone activity (IIC) that is computed at country level and takes into account several parameters such as wind speed (category), the duration, and the share of the territory affected by the cyclone activity.
The index is built, and is nonzero, for 128 countries and territories (which are affected by 3915 events recorded over the period 1970-2014).
The results show a strong heterogeneity across the affected territories. Over the period, the territories affected by the strongest intensity of cyclone activity are in the Western Pacific region (including Japan, the Philippines, Taiwan, and the Mariana Islands), followed by the Caribbean and the Indian Ocean regions.
The indicator of the intensity of cyclone activity at the country level may be used to assess one of the important dimensions of country vulnerability to natu-ral disasters and climate change. This indicator is based on scientific parameters for hurricane activity while remaining transparent and simple. It can be quickly recalculated following the update of databases on geolocalized cyclone activity. Complete data are available from the authors.
12 Policy brief n°180 S. F eindouno , M. G oujon & O . S an toni
References
• Camargo, S.J. and Sobel, A.H. (2005). Western North Pacific tropical cyclone
intensity and ENSO. Journal of Climate, 18(15), pp. 2996-3006.• Doocy S., Dick, A., Daniels, A., Kirsch, T. D. (2013). The Human Impact of Tropical
Cyclones: a Historical Review of Events 1980-2009 and Systematic Literature Review. PLOS Currents Disasters. 2013 Apr 16. Edition 1. doi:10.1371/currents.dis.2 664354a5571512063ed29d25ffbce74.• Emanuel, K. A. (1999). The power of a hurricane: An example of reckless driving
on the information superhighway. Weather, 54(4), 107-108.• Emanuel, K. (2005). Increasing destructiveness of tropical cyclones over the past
30 years. Nature, 436(7051), pp. 686-688.• Guillaumont, P. (2015), Mesurer la vulnérabilité au changement climatique pour
allouer le financement de l’adaptation, Ferdi Document de Travail 136.• Guillaumont, P. and Simonet, C. (2011) “Designing an Index of Structural
Vulnerability to Climate Change, Mars, Ferdi Working Paper, 108• Guillaumont, P. and Simonet, C. (2014) “Facing Climate Change in the LDCs: How
to Fit the Istanbul Programme of Action” in LDC IV Monitor, Istanbul Programme of Action for the LDCs (2011-2020). Monitoring Deliverables, Tracking Progress-Analytical Perspectives, Commonweath Secretariat, pp. 287-317• Guillaumont, P., Simonet, C. and Feindouno, S. (2017) “An Index of Physical
Vulnerabilty to Climate Change, Who Are the Most Vulnerable Countries?”, Ferdi Working Paper, forthcoming•
Holland, G. and Bruyère, C. L. 2014, Recent intense hurricane response to global climate change. Climate Dynamics, vol. 42, no 3-4, pp. 617-627.•
Kossin, J. P., Emanuel, K. A. and Vecchi, G. A. (2014), The poleward migration of the location of tropical cyclone maximum intensity, Nature 509, pp. 349–352, doi:10.1038/nature13278.• Mallen, K. J., Montgomery, M. T. and Wang, B. (2005), Reexamining the
Near-Core Radial Structure of the Tropical Cyclone Primary Circulation: Implications for Vortex Resiliency, Journal of the Atmospheric Sciences, 62, pp. 408-425.•
Misra, V., DiNapoli, S. and Powell, M. (2013). The track integrated kinetic en-ergy of Atlantic tropical cyclones. Monthly Weather Review, 141(7), pp. 2383-2389.•
Park, D.-S.R., Ho, C.-H., Kim, J.-H. and Kim, H.-S. (2013), Spatially Inhomogeneous Trends of Tropical Cyclone Intensity over the Western North Pacific for 1977–2010, Journal of Climate 26:14, pp. 5088-5101.• Powell, M. D. and Reinhold, T. A. (2007). Tropical cyclone destructive potential
by integrated kinetic energy. Bulletin of the American Meteorological Society, 88(4), pp. 513-526.•
Vecchi, G. A. and Knutson, T. R. (2008), On estimates of historical north atlantic tropical cyclone activity, Journal of Climate, 21, pp. 3580-3600.13 Policy brief n°180 S. F eindouno , M. G oujon & O . S an toni