HAL Id: hal-01220380
https://hal.inria.fr/hal-01220380
Submitted on 26 Oct 2015
HAL is a multi-disciplinary open access
archive for the deposit and dissemination of
sci-entific research documents, whether they are
pub-lished or not. The documents may come from
teaching and research institutions in France or
abroad, or from public or private research centers.
L’archive ouverte pluridisciplinaire HAL, est
destinée au dépôt et à la diffusion de documents
scientifiques de niveau recherche, publiés ou non,
émanant des établissements d’enseignement et de
recherche français ou étrangers, des laboratoires
publics ou privés.
Lateral Temporal Lobe: An Early Imaging Marker of
the Presymptomatic GRN Disease?
Paola Caroppo, Marie-Odile Habert, Stanley Durrleman, Aurélie Funkiewiez,
Vincent Perlbarg, Valérie Hahn, Hugo Bertin, Malo Gaubert, Alexandre
Routier, Didier Hannequin, et al.
To cite this version:
Paola Caroppo, Marie-Odile Habert, Stanley Durrleman, Aurélie Funkiewiez, Vincent Perlbarg, et al..
Lateral Temporal Lobe: An Early Imaging Marker of the Presymptomatic GRN Disease?. Journal of
Alzheimer’s Disease, IOS Press, 2015, 47 (3), pp.751-9. �10.3233/JAD-150270�. �hal-01220380�
IOS Press
Lateral Temporal Lobe: An Early Imaging
Marker of the Presymptomatic GRN Disease?
Paola Caroppo
a,b,c,d,e, Marie-Odile Habert
f,g, Stanley Durrleman
a,b,c,d,h, Aur´elie Funkiewiez
b,i,j,
Vincent Perlbarg
a,b,c,d,f,k, Val´erie Hahn
j, Hugo Bertin
f,l, Malo Gaubert
f,l, Alexandre Routier
a,b,c,d,h,l,
Didier Hannequin
m, Vincent Deramecourt
n, Florence Pasquier
n, Sophie Rivaud-Pechoux
a,b,c,d,
Martine Vercelletto
o, Geoffrey Edouart
a,b,c,d,p, Romain Valabregue
a,b,c,d,q, Pascal Lejeune
r,
Mira Didic
s, Jean-Christophe Corvol
a,b,c,d,p,t, Habib Benali
f, Stephane Lehericy
a,b,c,d,q,
Bruno Dubois
a,b,c,d,i,j,t, Olivier Colliot
a,b,c,d,h, Alexis Brice
a,b,c,d,t,u,∗, Isabelle Le Ber
a,b,c,d,j,t,∗and the Predict-PGRN study group
aSorbonne Universit´es, UPMC Universit´e Paris 06, UMR S 1127, ICM, Paris, France bInserm, U1127, ICM, Paris, France
cCNRS, UMR 7225, ICM, Paris, France
dInstitut du Cerveau et de la Moelle ´epini`ere (ICM), Hˆopital de la Piti´e Salpˆetri`ere, Paris, France eNeurological Institut Carlo Besta, Milan, Italy
fSorbonne Universit´es, UPMC Univ Paris 06, UMR 7371, UMR S 1146, Laboratoire d’Imagerie Biom´edicale,
Paris, France
gAP-HP, Hˆopitaux Universitaires La Piti´e Salpˆetri`ere-Charles Foix, D´epartement de M´edecine Nucl´eaire, Paris,
France
hINRIA, project-team Aramis, Centre Paris-Rocquencourt, France
iAP-HP, Hˆopitaux Universitaires La Piti´e Salpˆetri`ere-Charles Foix, Institut de la M´emoire et de la maladie
d’Alzheimer, Departement de Neurologie, Paris, France
jAP-HP, Hˆopitaux Universitaires La Piti´e Salpˆetri`ere-Charles Foix, Centre de R´ef´erence des D´emences Rares,
Paris, France
kIHU-A-ICM, Bioinformatics/Biostatistis Platform, Paris, France
lCentre pour l’Acquisition et le Traitement des Images (http://www.cati-neuroimaging.com), Paris and Saclay,
France
mService de Neurologie et CMRR, Inserm U1079, Centre Hospitalier Universitaire, Rouen, France nInserm U1171, Universit´e de Lille, Lille, France
oService de Neurologie, CHU Guillaume et Ren´e La¨ennec, Nantes, France
pAP-HP, Hˆopitaux Universitaires La Piti´e Salpˆetri`ere-Charles Foix, Clinical Investigation Center (CIC-1422),
Paris, France
qCentre de NeuroImagerie de Recherche (CENIR), Institut du Cerveau et de la Moelle ´epini`ere (ICM),
Hˆopital de la Piti´e Salpˆetri`ere, Paris, France
rService de neurologie, CHD La Roche sur Yon, France
sService de Neurologie et Neuropsychologie, APHM, CHU Timone et Aix Marseille Universit´e, Inserm, INS UMR S
1106, 13005 Marseille, France
tAP-HP, Hˆopitaux Universitaires La Piti´e Salpˆetri`ere-Charles Foix, D´epartement de Neurologie, Paris, France uAP-HP, Hˆopitaux Universitaires La Piti´e Salpˆetri`ere-Charles Foix, D´epartement de G´en´etique et Cytog´en´etique,
Unit´e Fonctionnelle de G´en´etique Clinique, Paris, France
Handling Associate Editor: Eric Salmon Accepted 9 May 2015
∗Correspondence to: Dr Isabelle Le Ber and Pr Alexis Brice, Institut du Cerveau et de la Moelle ´epini`ere (ICM), Hˆopital de la Piti´e Salpˆetri`ere, 75013 Paris, France. Tel.: +0033 015 727 4679;
Fax: +0033 015 727 4795; E-mails: isabelle.leber@upmc.fr, alexis.brice@upmc.fr.
ISSN 1387-2877/14/$27.50 © 2015 – IOS Press and the authors. All rights reserved
752 P. Caroppo et al. / Lateral Temporal Involvement in Asymptomatic GRN Carriers
Abstract. The preclinical stage of frontotemporal lobar degeneration (FTLD) is not well characterized. We conducted a brain
metabolism (FDG-PET) and structural (cortical thickness) study to detect early changes in asymptomatic GRN mutation carriers (aGRN+) that were evaluated longitudinally over a 20-month period. At baseline, a left lateral temporal lobe hypometabolism was present in aGRN+ without any structural changes. Importantly, this is the first longitudinal study and, across time, the metabolism more rapidly decreased in aGRN+ in lateral temporal and frontal regions. The main structural change observed in the longitudinal study was a reduction of cortical thickness in the left lateral temporal lobe in carriers. A limit of this study is the relatively small sample (n = 16); nevertheless, it provides important results. First, it evidences that the pathological processes develop a long time before clinical onset, and that early neuroimaging changes might be detected approximately 20 years before the clinical onset of disease. Second, it suggests that metabolic changes are detectable before structural modifications and cognitive deficits. Third, both the baseline and longitudinal studies provide converging results implicating lateral temporal lobe as early involved in GRN disease. Finally, our study demonstrates that structural and metabolic changes could represent possible biomarkers to monitor the progression of disease in the presymptomatic stage toward clinical onset.
Keywords: Cortical thickness, dementia, frontotemporal dementia, frontotemporal lobar degeneration, GRN, longitudinal, pre-clinical study, presymptomatic, progranulin, PET
INTRODUCTION
Frontotemporal lobar degeneration (FTLD) are rare neurodegenerative disorders characterized by behav-ioral changes and language deficits. Mutations of the GRN (progranulin) gene, all leading to progran-ulin haploinsufficiency, are responsible for 25% of familial cases. The prevalent clinical phenotype of
GRN patients is behavioral variant of
frontotempo-ral dementia (bvFTD). Primary progressive non-fluent aphasia and corticobasal syndrome are less common presenting phenotypes [1, 2]. Neuroimaging pattern of
GRN carriers is characterized by asymmetrical
fronto-temporal-parietal atrophy [3, 4].
So far, it is not known how long structural and functional changes occur before the clinical onset of FTLD disease. It is expected that biological alterations and morphological changes leading to dementia could occur decades before the first symptoms of FTLD, as demonstrated in other genetic forms of dementias such as Alzheimer’s disease [5]. Establishing how long these brain changes precede the clinical onset and their chronology during the presymptomatic stage is cru-cial because therapeutics such as HDAC inhibitors or amiodarone [6–8] are currently being developed to compensate progranulin haploinsufficiency. In this study, we performed a multimodal approach to inves-tigate the chronology of brain structural and metabolic changes in a cohort of asymptomatic GRN carriers. MATERIALS AND METHODS
Subjects
Forty-three neurologically healthy individuals with 50% risk to carry a GRN mutation (first degree
rela-tives of GRN carriers from 15 unrelated families) were recruited in four French centers over a 3-years period (2011 to 2013). All participants have signed informed consent for the study that was approved by the Ethics Committee of ‘Assistance Publique-Hopitaux de Paris, Paris’.
At inclusion, asymptomatic status was ascertained based on relative’s interview, neurological examination and the normality of scores of behavioral scales and neuropsychological tests (Supplementary Methods 2, Supplementary Table 1). Three participants presented cognitive impairment at neuropsychological evalua-tion and were considered as ‘cognitively symptomatic non dementia’ (CSND); therefore, they were excluded from the analyses. Additionally, 7 were also excluded from analyses because they did not undergo the full protocol, or because of the discovery of coincidental lesions on brain MRI a posteriori.
Finally, 33 healthy individuals were included in the analyses. GRN sequencing revealed that six-teen asymptomatic participants carried GRN mutation (aGRN+, see Supplementary Table 2 for the list of mutations); the 17 participants who did not carry mutation (GRN−) were used as control group. The characteristics of aGRN+ and GRN− groups are sum-marized in the Table 1 and Supplementary Table 1. There were no statistical differences in age at exam-ination, gender composition, and educational level between the two groups (Table 1, Supplementary Methods 1). The 33 subjects underwent standard MRI and FDG-PET study at baseline (T0); all except 5 underwent a second evaluation 20 months later (T20) with the same cognitive and neuroimaging protocol (14 GRN carriers, 14 non-carriers, n = 28) (Table 1). Five participants (2 carriers, 3 non-carriers) refused to be reevaluated and dropped out the study. Baseline
Table 1
Demographic characteristics of GRN carriers (aGRN+) and controls (GRN−)
Baseline visit (T0) Follow-up visit (T20)
Genetic status aGRN+ GRN− p-value aGRN+ GRN− p-value
Number of cases 16 17 – 14 14 –
Gender Male/Female 4/12 6/11 – 4/10 5/9 –
Education level (mean score) 2.7± 0.5 2.8± 0.5 0.8 – – – Age at examination, 41.9± 8.2 40± 8.3 0.8 43± 7.9 42.1± 9.0 0.9
years (range) (27–58) (27–60) (28–59) (29–51)
Duration T0–T20, months – – – 19.5± 2 20.0± 6.2 0.9 Distance to estimated age at 20± 10 – – – – –
onset, years (range) (7–34)
Means± SD are reported. Significant p-value <0.05. Educational level has been scored as follow: score 1 (5–8 years of study); score 2 (9–12 years); score 3 (>12 years).
and longitudinal statistical analyses were performed for brain structural MRI and metabolism, as described below. The participants were age- and gender-matched for the analyses at each time points (Table 1). We esti-mated the distance from the age of clinical onset in
aGRN+ by subtracting the age at examination to the
mean age at onset in the family.
MRI protocols MRI acquisition
MRIs were acquired with 3 Tesla and 1.5 Tesla scan-ners according to the scanner available in each center. All centers used the same MRI sequences protocol that was designed and optimized to minimize centers bias. Prior to the study, phantom acquisitions were per-formed in order to ensure the comparability of the results across centers. The same proportion of carri-ers and of non-carricarri-ers was investigated in each center, and baseline and follow-up MRIs were performed on the same scanners for each participant. High-resolution three-dimensional T1-weighted images were acquired with full brain coverage and isotropic voxels (TR: 2300 ms; TE: 4,18 ms; matrix = 256 mm; slice thick-ness = 1 mm).
Cortical thickness analysis
Cortical thickness analyses were performed on T1-weighted 3D images using Freesurfer software (http:// surfer.nmr.mgh.harvard.edu). Briefly, T1-weighted 3D images were preprocessed with intensity variations correction, normalization, affine registration to the Talairach atlas, skull stripping, and segmentation of grey and white matter. The pipeline for longitudinal processing has been used that includes the creation of an unbiased within-subject template using robust, inverse consistent registration [9]. For cortical thick-ness, we used surface-based analysis of thickness values at each vertex. Surface-based analyses of corti-cal thickness were performed using Surfstat software
(http://www.math.mcgill.ca/keith/surfstat/) following the methodology previously used [10]. Cortical thick-ness maps were smoothed using a 20 mm surface-based kernel. The comparison of baseline cortical thickness between groups was carried out using a two-sample t-test at each vertex. For longitudinal analyses, a paired
t-test was used. Statistics were corrected for
multi-ple comparisons using the random field theory for non-isotropic images [11]. A statistical threshold of
p < 0.005 was first applied (height threshold). An extent
threshold of p < 0.05 corrected for multiple compar-isons was then applied at the cluster level.
Positon emission tomography protocols
18Fluorodeoxyglucose positon emission
tomog-raphy (18FDG-PET) scans were acquired in four departments of nuclear medicine with a standardized protocol. Phantom acquisitions were performed prior to the study in order to measure the spatial resolution (FWHM) of each scanner. A dose of 2 MBq/Kg of flu-orodeoxyglucose (18FDG) was injected 30 to 45 min prior to an acquisition of 15 min. Patients rested in quiet surroundings with the eyes closed at least 20 min post-injection. Follow-up scans were performed on the same tomograph as the baseline, with the same protocol.
PET volumes were co-registered to their corre-sponding MRI volumes. MRI volumes were segmented into grey matter and white matter probability maps and spatially normalized to MNI space using SPM8. PET co-registered images were spatially normal-ized applying the transformation parameters of MRI normalization. Individual variability was taken into account by dividing for each subject voxel uptake by the mean pons uptake, yielding parametric images. Pons uptake was obtained from a Pickatlas (http://fmri. wfubmc.edu/software/pickatlas) region of interest. Parametric images were smoothed using an isotropic Gaussian kernel of 12 mm. Voxel-by-voxel comparison between carriers and non-carriers was then performed
754 P. Caroppo et al. / Lateral Temporal Involvement in Asymptomatic GRN Carriers
with a two-sample T-test on smoothed parametric images using an explicit mask. This mask was obtained from the mean of grey matter probability maps of each subject included in this analysis, with a threshold of 0.4. Age, gender, and tomograph spatial resolution were used as covariates. MarsBaR toolbox in SPM8 was used to extract [18F]FDG-uptake adjusted values from significant clusters.
The method used to analyze the longitudinal data has been adapted from the one previously described by Fouquet et al. [12]. The follow-up MRI was co-registered to the baseline MRI, and a mean image was calculated. This mean image was used to calcu-late optimal transformation parameters to MNI space. Next, baseline and follow-up PET images were co-registered to the baseline MRI, spatially normalized to MNI using optimal transformation previously cal-culated, scaled with mean pons uptake, and smoothed with an isotropic Gaussian kernel of 4 mm. Individ-ual percent annIndivid-ual changes maps or “PET-PAC” were then calculated. These maps represent the voxel-wise calculation of percent metabolic change over the 20-month follow-up period (i.e., the difference between follow-up and baseline scaled PET value divided by baseline PET value x 100) expressed in annual percent change. A voxel-by-voxel comparison of PET-PAC between carriers and non-carriers was then performed after a second smoothing of the individual PET-PAC maps with an isotropic Gaussian kernel of 10 mm, and
using a mask obtained with the same method as for the cross-sectional analysis.
All results are reported with p-value <0.001 uncor-rected for multiple comparisons with an extent threshold k corresponding to the expected number of voxels per cluster. Differences in spatially normalized FDG-PET scans obtained with scanners of different resolutions were minimized by the following mea-sures: i) restricting the analysis to voxels with intensity 80% greater than the whole-brain mean, and ii) exclud-ing voxels from the uppermost 10 slices (i.e., from the top 22.5 mm of the brain) and from the lowermost 5 slices, where significant inter-scanner effects due to different fields of view have been reported [13]. RESULTS
Groups did not differ for gender, age at examination (p = 0.8), age at follow-up (p = 0.9). The mean esti-mated distance to the age at clinical onset was 20± 10 years in aGRN+ (Table 1).
Cortical thickness
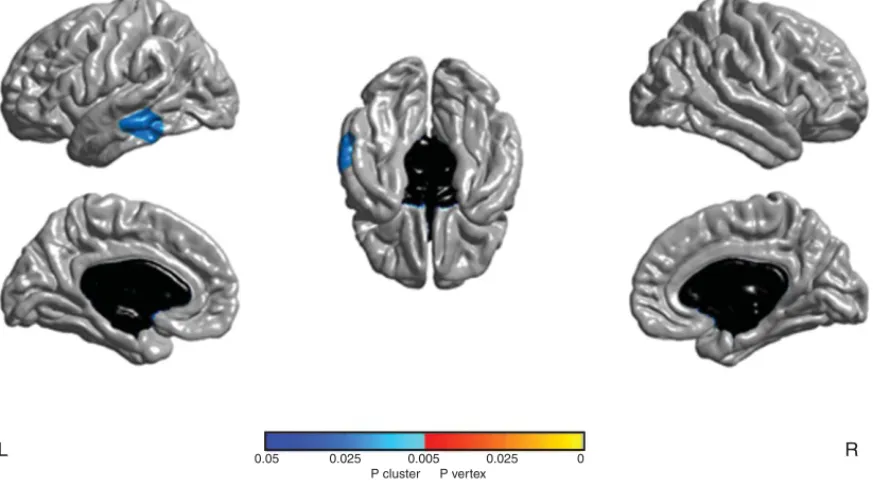
At baseline, no significant difference was found for cortical thickness between aGRN+ and GRN−. At follow-up a reduction of cortical thickness was found in one cluster in the left middle (1607 voxels) and infe-rior (554 voxels) temporal gyri (Fig. 1) in aGRN+,
L 0.05 0.025 0.005 0.025
P cluster P vertex
0 R
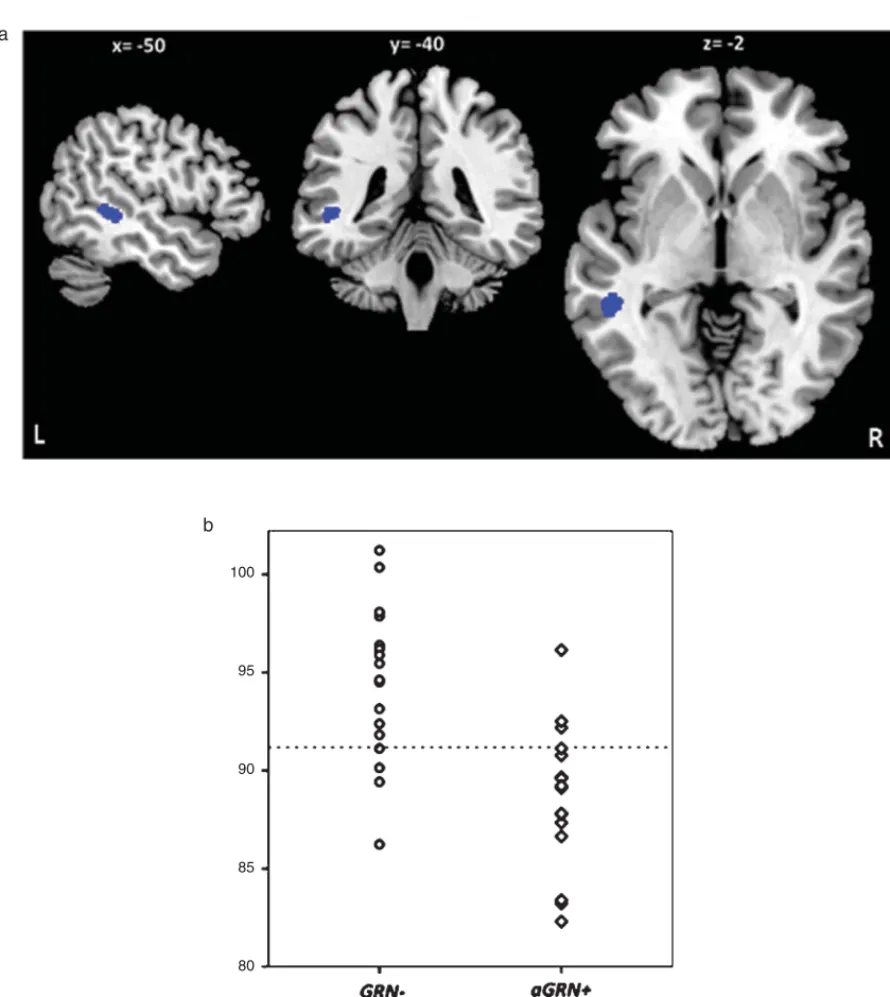
a b 100 95 90 85 80
Fig. 2. a) At baseline PET-FDG hypometabolism in aGRN+ compared to GRN- (p < 0.001 uncorrected). L, left; R, right. b) The plot of the adjusted values of [18F]FDG uptake in the cluster is reported. Horizontal line corresponds to the median. GRN−: non carriers, aGRN+: asymptomatic GRN mutation carriers.
with peak in the left middle temporal gyrus (p < 0.05, cluster-corrected).
18Fluorodeoxyglucose-PET
At baseline a left middle temporal gyrus
hypometabolism (183 voxels; MNI coordinates x =−50; y = −40; z = −2) was present in aGRN+ compared to GRN- (p < 0.001 uncorrected) (Fig. 2).
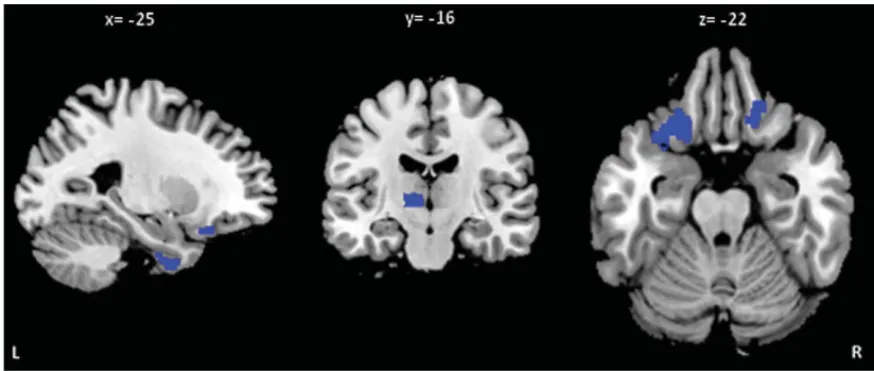
The longitudinal analysis revealed areas of greater metabolism decrease (p < 0.001, uncorrected) in
aGRN+ compared to GRN− in the left inferior
temporal, left middle frontal, left inferior orbital frontal, right superior orbital frontal gyri as well as in the left thalamus (Fig. 3; Supplementary Table 4). Mean and maximal percent annualized change values in the regions represented in Fig. 3 are given in Supplementary Table 4.
756 P. Caroppo et al. / Lateral Temporal Involvement in Asymptomatic GRN Carriers
Fig. 3. Regions of greater percentage of annualized changes of metabolism in aGRN+ compared to GRN− (p < 0.001 uncorrected). L, left; R, right (see Supplementary Table 4 for MNI coordinates and for values).
DISCUSSION
The major neuroanatomical signature of GRN dis-ease in symptomatic patients carrying mutations is an asymmetric involvement of the inferior frontal, tem-poral, and parietal brain regions [1, 3, 4]. A recent study also demonstrated that the most important annual percentage change of atrophy occurs in temporal lobe (lateral, polar), parietal (lateral, posterior) lobes, and insula in GRN symptomatic patients, compared to all other genotypes [14].
In this study, we have evaluated the presymp-tomatic phase of GRN disease. We have conducted a multimodal analysis combining two neuroimaging approaches to evaluate the chronology of structural and metabolic brain changes occurring during the presymptomatic phase in GRN carriers. The mean dis-tance from estimated age at onset in our series (20± 10 years) is longer than in most other studies (7 to 12 years, Supplementary Table 5) and allows detecting very early changes. We also evaluated the progression of brain changes across time in a longitudinal study. Importantly, this is the first longitudinal study con-ducted in GRN disease. In most studies, the progression in presymptomatic stage of dementia is evaluated by correlating changes to the mean distance to clinical onset, estimated as the difference between age at exam-ination and mean age at onset in a family [15–18]. This estimation can be easily applied in genetic dis-eases where age at onset is relatively stable within families, as in genetic forms of Alzheimer’s disease [5], but this approximation is less confident in GRN disease, where age at onset is highly variable within families. For this reason, we evaluated the
progres-sion of changes across time by longitudinal evaluation of presymptomatic GRN carriers, during a 20-month follow-up period.
At baseline, the absence of structural changes mea-sured by cortical thickness in this study is consistent with one other study [18]. These negative results might be explained by the long distance to clinical onset. Oth-erwise, this method might be not sensitive enough to detect small effects in small groups of asymptomatic individuals. Only one cross-sectional study performed by Pievani et al. demonstrated reduced cortical thick-ness in five GRN carriers in the orbitofrontal cortex, middle frontal and precentral gyri that are not com-pletely consistent with our results at baseline [19]. These inconsistencies might be due the age at exami-nation that is higher than in our study, the population is thus closer to clinical onset, and to the sample size of carriers which is smaller than our cohort, possibly explaining different results at baseline. Furthermore, statistical methodology in our study is less liberal than that used by Pievani et al. and shall minimize the report of false positive findings. This may also explain why Pievani et al reported differences in a smaller group of carriers while we did not find significant differences at baseline. Importantly, even if no changes were present at baseline in our study, the cortical thickness reduced across time at follow-up in our aGRN+ individuals in lateral temporal lobe, in particular in the left middle and inferior temporal gyri. Notably, accordingly with our results, cortical thickness decreased faster with aging in the same regions in GRN carriers in another study [18]. Our results indicate that a comparison across time might be an appropriate method to detect affected brain regions during the presymptomatic stage.
Hypometabolism was present at baseline in GRN carriers and was initially limited to the left mid-dle temporal region. Unexpectedly, frontal lobes were not involved at baseline, although another metabolism study in aGRN+ carriers [17] found dif-fuse hypometabolism in frontal lobes. In the latter study, however, half of 9 carriers were cognitively symptomatic, which might explain less selective impairment at a later stage of disease progression. These inconsistencies can also be partially related to different methodologies used in the two studies. Con-versely, our follow-up evaluation evidenced a rapid metabolism decrease in aGRN+ involving the frontal lobe (left middle, orbital) in addition to the inferior temporal gyrus and thalamus. Our results suggest that metabolic abnormalities, detectable at baseline, could predate the structural changes, and be one of the earliest predictor of the pathological process. It also suggests that temporal lobe might be initially more susceptible to the pathological process which secondarily progress to the frontal cortex.
Finally, both our baseline and longitudinal studies provide converging results implicating the lateral tem-poral lobe as one of the earliest regions involved in
GRN disease. Other studies [15, 20] also indicate that
temporal areas could be noticeably impaired, before the frontal regions. A recent European study in a large cohort of aGRN+ carriers demonstrates that tempo-ral atrophy is detectable 15 years before estimated clinical onset, before frontal involvement [21]. Con-sequently, one might hypothesize a dynamic model of the presymptomatic stage of GRN disease where temporal areas, involved many years before the clini-cal onset, could be the ‘epicenter’ of the pathologiclini-cal seeds, that might progress later toward frontal and/or parietal regions.
The left middle temporal gyrus, which is early and consistently involved in this study, is implicated in language and semantic processing as well as in the recognition and retrieval of semantic information [22]. The involvement of this region fits well with clinical presentation of language disorders, especially agram-matic/nonfluent variant of FTD, characterizing a subset of GRN patients [1, 3]. The lateral temporal lobe also plays a role in theory of mind [23] that is one of the first detectable cognitive deficits in the early stage of FTD, and that significantly decreases in GRN carriers approaching the age of onset of the disease [16].
A more rapid metabolic decrease was also detected in the thalamus, a key node in the prefrontal-basal ganglia circuits, as well as in the prefrontal cor-tex. Interestingly, thalamic atrophy is more frequently
detected in symptomatic GRN carriers than in other FTD subtypes [24], and already detected in the presymptomatic stage of FTD [21]. Both thalamus and the prefrontal cortex generate and control goal-directed behaviors [25, 26] and are implicated in apathy, one of the predominant clinical symptom of FTD.
Studies in GRN presymptomatic carriers have some limitations. First, clinical heterogeneity of GRN dis-ease, reflecting variable topography of lesions at onset, can diminish robustness of changes detection in presymptomatic carriers. Moreover, subtle changes detected during the presymptomatic stage, could also vary according to methodological approaches. Finally, disease-specific markers are not available in FTLD, thus possibly delaying the detection of presymptomatic changes in this pathology.
However, our study provides important results. First, it evidences that the pathological process develop a long time before clinical onset in GRN carriers, and that early metabolic changes might be detected approximately 20 years before estimated disease onset. Second, it shows that metabolic changes are detectable before structural modifications and cognitive deficits that possibly appear in a shorter delay from the clini-cal onset. Finally, our study contributes to demonstrate that structural and metabolic changes could represent possible biomarkers to monitor the progression of dis-ease in the presymptomatic stage toward the clinical onset.
ACKNOWLEDGMENTS
The research leading to these results has received funding from the program “Investissements d’avenir” ANR-10-IAIHU-06. P. Caroppo received a PhD Fel-lowship from Carlo Besta Institute, Milano, Italy. This work was funded by the Programme Hospital-ier de Recherche Clinique (PHRC Predict-PGRN, to A.B.). We thank Ms. Lydia Guennec, Sylvie Forlani, and Christelle Dussert (DNA and cell bank of CR-ICM, Hˆopital de la Piti´e-Salpetri`ere, Paris) for their excellent technical assistance, the URC- Hˆopital de la Salpetri`ere and CIC 1422, Hˆopital de la Piti´e-Salpetri`ere.
Authors’ disclosures available online (http://j-alz. com/manuscript-disclosures/15-0270r1).
The Predict-PGRN study group: Eric Guedj (CHU Timone, Marseille), Nadine Girard (CHU Timone, Marseille), Christine R´emy (CIC-Piti´e-Salpetri`ere, Paris), Ali Bouyahia (ICM, Paris), Marie Chupin (ICM, Paris), Basile Pinsard (ICM, Paris), Vanessa
758 P. Caroppo et al. / Lateral Temporal Involvement in Asymptomatic GRN Carriers
Mourlon (IMMA, Paris), Anne De Septenville (ICM, Paris), Agn`es Camuzat (ICM, Paris), Catherine Thomas-Ant´erion (Plein Ciel, Lyon), Mich`ele Puel (CHU Toulouse), J´er´emie Pariente (CHU Toulouse), Isabelle Berry (CHU Toulouse), Pierre Payoux (CHU Toulouse), Elisabeth Auffray-Calvier (CHU Nantes), Amandine Pallardy (CHU Nantes), Adeline Rollin (CHU Lille), Christine Delmaire (CHU Lille), Franck Semah (CHU Lille), Claude Hossein-Foucher (CHU Lille), Emmanuel Gerardin (CHU Rouen), Pierre Vera (CHU Rouen), Olivier Martinaud (CHU Rouen), David Wallon (CHU Rouen), Eric Bardinet (ICM, Paris), Aur´elie Kas (CHU Pitie-Salpetriere, Paris), Val´erie-Causse Lemercier (CHU Piti´e-Salpˆetri`ere, Paris), Alain Mallet (Unite de Recherche Clinique, CHU Piti´e-Salpetri`ere, Paris), Merry Masmanian (Unite de Recherche Clinique, CHU Piti´e-Salpetri`ere, Paris), Sarah Lehoux (Unite de Recherche Clinique, CHU Piti´e-Salpetri`ere, Paris), Saadane Kirouani (Unite de Recherche Clinique, CHU Piti´e-Salpetri`ere, Paris); Ivan Mozser (ICM, Paris), Arthur Tenenhaus (ICM, Paris).
SUPPLEMENTARY MATERIAL
The supplementary material is available in the electronic version of this article: http://dx.doi.org/ 10.3233/JAD-150270.
REFERENCES
[1] Le Ber I, Camuzat A, Hannequin D, Pasquier F, Guedj E, Rovelet-Lecrux A, Hahn-Barma V, van der Zee J, Clot F, Bakchine S, Puel M, Ghanim M, Lacomblez L, Mikol J, Deramecourt V, Lejeune P, de la Sayette V, Belliard S, Ver-celletto M, Meyrignac C, Van Broeckhoven C, Lambert JC, Verpillat P, Campion D, Habert MO, Dubois B, Brice A; French research network on FTD/FTD-MND (2008) Pheno-type variability in progranulin mutation carriers: A clinical, neuropsychological, imaging and genetic study. Brain 131, 732-746.
[2] Van Swieten JC, Heutink P (2008) Mutations in progran-ulin (GRN) within the spectrum of clinical and pathological phenotypes of frontotemporal dementia. Lancet Neurol 7, 965-974.
[3] Rohrer JD, Lashley T, Schott JM, Warren JE, Mead S, Isaacs AM, Beck J, Hardy J, de Silva R, Warrington E, Troakes C, Al-Sarraj S, King A, Borroni B, Clarkson MJ, Ourselin S, Holton JL, Fox NC, Revesz T, Rossor MN, Warren JD (2011) Clinical and neuroanatomical signatures of tissue pathology in frontotemporal lobar degeneration. Brain 134, 2565-2581. [4] Whitwell JL, Weigand SD, Boeve BF, Senjem ML, Gunter JL, DeJesus-Hernandez M, Rutherford NJ, Baker M, Knop-man DS, Wszolek ZK, Parisi JE, Dickson DW, Petersen RC, Rademakers R, Jack CR Jr, Josephs KA (2012) Neuroimaging signatures of frontotemporal dementia genetics: C9ORF72, tau, progranulin and sporadics. Brain 135, 794-806.
[5] Bateman RJ, Xiong C, Benzinger TL, Fagan AM, Goate A, Fox NC, et al. Marcus DS, Cairns NJ, Xie X, Blazey TM, Holtzman DM, Santacruz A, Buckles V, Oliver A, Moulder K, Aisen PS, Ghetti B, Klunk WE, McDade E, Martins RN, Masters CL, Mayeux R, Ringman JM, Rossor MN, Schofield PR, Sperling RA, Salloway S, Morris JC (2012) Domi-nantly Inherited Alzheimer Network. Clinical and biomarker changes in dominantly inherited Alzheimer’s disease. N Engl
J Med 367, 795-804.
[6] Cenik B, Sephton CF, Dewey CM, Xian X, Wei S, Yu K, Niu W, Coppola G, Coughlin SE, Lee SE, Dries DR, Almeida S, Geschwind DH, Gao FB, Miller BL, Farese RV Jr, Posner BA, Yu G, Herz J (2011) Suberoylanilide hydrox-amic acid (vorinostat) up-regulates progranulin transcription: Rational therapeutic approach to frontotemporal dementia.
J Biol Chem 286, 16101-16108.
[7] Lee WC, Almeida S, Prudencio M, Caulfield TR, Zhang YJ, Tay WM, Bauer PO, Chew J, Sasaguri H, Jansen-West KR, Gendron TF, Stetler CT, Finch N, Mackenzie IR, Rademak-ers R, Gao FB, Petrucelli L (2014) Targeted manipulation of the sortilin-progranulin axis rescues progranulin haploinsuf-ficiency. Hum Mol Genet 23, 1467-1478.
[8] Alberici A, Archetti S, Pilotto A, Premi E, Cosseddu M, Bianchetti A, Semeraro F, Salvetti M, Muiesan ML, Padovani A, Borroni B (2014) Results from a pilot study on amiodarone administration in monogenic frontotemporal dementia with granulin mutation. Neurol Sci 35, 1215-1219.
[9] Reuter M, Schmansky NJ, Rosas HD, Fischl B (2012) Within-subject template estimation for unbiased longitudinal image analysis. Neuroimage 61, 1402-1418.
[10] Worbe Y, Gerardin E, Hartmann A, Valabr´egue R, Chupin M, Tremblay L, Vidailhet M, Colliot O, Leh´ericy S (2010) Distinct structural changes underpin clinical phenotypes in patients with Gilles de la Tourette syndrome. Brain 133, 3649-3660.
[11] Worsley KJ, Andermann M, Koulis T, MacDonald D, Evans AC (1999) Detecting changes in nonisotropic images. Hum
Brain Mapp 8, 98-101.
[12] Fouquet M1, Desgranges B, Landeau B, Duchesnay E, M´ezenge F, de la Sayette V, Viader F, Baron JC, Eustache F, Ch´etelat G (2009) Longitudinal brain metabolic changes from amnestic mild cognitive impairment to Alzheimer’s disease.
Brain 132, 2058-2067.
[13] Mosconi L, Tsui WH, Herholz K, Pupi A, Drzezga A, Lucignani G, Reiman EM, Holthoff V, Kalbe E, Sorbi S, Diehl-Schmid J, Perneczky R, Clerici F, Caselli R, Beuthien-Baumann B, Kurz A, Minoshima S, and de Leon MJ (2008) Multicenter standardized 18F-FDG PET diagnosis of mild cognitive impairment, Alzheimer’s disease, and other demen-tias. J Nucl Med 49, 390-398.
[14] Whitwell JL, Boeve BF, Weigand SD, Senjem ML, Gunter JL, Baker MC, DeJesus-Hernandez M, Knopman DS, Wszolek ZK, Petersen RC, Rademakers R, Jack CR Jr, Josephs KA (2015) Brain atrophy over time in genetic and sporadic frontotemporal dementia: A study of 198 serial magnetic res-onance images. Eur J Neurol 22, 745-752.
[15] Borroni B, Alberici A, Cercignani M, Premi E, Serra L, Cerini C, Cosseddu M, Pettenati C, Turla M, Archetti S, Gasparotti R, Caltagirone C, Padovani A, Bozzali M (2012) Granulin muta-tion drives brain damage and reorganizamuta-tion from preclinical to symptomatic FTLD. Neurobiol Aging 33, 2506-2520. [16] Dopper EG, Rombouts SA, Jiskoot LC, den Heijer T, de
Graaf JR, de Koning I, Hammerschlag AR, Seelaar H, See-ley WW, Veer IM, van Buchem MA, Rizzu P, van Swieten JC (2014) Structural and functional brain connectivity in
presymptomatic familial frontotemporal dementia. Neurology
83, e19-e26.
[17] Jacova C, Hsiung GY, Tawankanjanachot I, Dinelle K, McCormick S, Gonzalez M, Lee H, Sengdy P, Bouchard-Kerr P, Baker M, Rademakers R, Sossi V, Stoessl AJ, Feldman HH, Mackenzie IR (2013) Anterior brain glucose hypometabolism predates dementia in progranulin mutation carriers.
Neurol-ogy 81, 1322-1331.
[18] Moreno F, Sala-Llonch R, Barandiaran M, S´anchez-Valle R, Estanga A, Bartr´es-Faz D, Sistiaga A, Alzualde A, Fern´andez E, Mart´ı Mass´o JF, L´opez de Munain A, Indakoetxea B (2013) Distinctive age-related temporal cortical thinning in asymp-tomatic granulin gene mutation carriers. Neurobiol Aging 34, 1462-1468.
[19] Pievani M, Paternic`o D, Benussi L, Binetti G, Orlandini A, Cobelli M, Magnaldi S, Ghidoni R, Frisoni GB (2014) Pattern of structural and functional brain abnormalities in asymp-tomatic granulin mutation carriers. Alzheimers Dement 10, S354-S363.e1.
[20] Premi E, Cauda F, Gasparotti R, Diano M, Archetti S, Padovani A, Borroni B (2014) Multimodal FMRI resting-state functional connectivity in granulin mutations: The case of fronto-parietal dementia. PLoS One 9, e106500. [21] Rohrer JD, Nicholas JM, Cash DM, van Swieten J, Dopper
E, Jiskoot L, van Minkelen R, Rombouts SA, Cardoso MJ, Clegg S, Espak M, Mead S, Thomas DL, De Vita E, Masellis M, Black SE, Freedman M, Keren R, MacIntosh BJ, Rogaeva E, Tang-Wai D, Tartaglia MC, Laforce R Jr, Tagliavini F, Tiraboschi P, Redaelli V, Prioni S, Grisoli M, Borroni B,
Padovani A, Galimberti D, Scarpini E, Arighi A, Fumagalli G, Rowe JB, Coyle-Gilchrist I, Graff C, Fallstr¨om M, Jelic V, St˚ahlbom AK, Andersson C, Thonberg H, Lilius L, Frisoni GB, Pievani M, Bocchetta M, Benussi L, Ghidoni R, Fin-ger E, Sorbi S, Nacmias B, Lombardi G, Polito C, Warren JD, Ourselin S, Fox NC, Rossor MN (2015) Presymptomatic cog-nitive and neuroanatomical changes in genetic frontotemporal dementia in the Genetic Frontotemporal dementia Initiative (GENFI) study: A cross-sectional analysis. Lancet Neurol 14, 253-262.
[22] Dronkers NF, Wilkins DP, Van Valin RD Jr, Redfern BB, Jaeger JJ (2004) Lesion analysis of the brain areas involved in language comprehension. Cognition 92, 145-177. [23] Ross LA, Olson IR (2010) Social cognition and the anterior
temporal lobes. Neuroimage 49, 3452-3462.
[24] Premi E, Garibotto V, Gazzina S, Formenti A, Archetti S, Gas-parotti R, Padovani A, Borroni B (2014) Subcortical and deep cortical atrophy in frontotemporal dementia due to granulin mutations. Dement Geriatr Cogn Dis Extra 4, 95-102. [25] Donovan NJ, Wadsworth LP, Lorius N, Locascio JJ, Rentz
DM, Johnson KA, Sperling RA, Marshall GA, Alzheimer Disease Neuroimaging Initiative (2014) Regional cortical thinning predicts worsening apathy and hallucinations across the Alzheimer disease spectrum. Am J Geriatr Psychiatry 22, 1168-1179.
[26] Levy R, Dubois B (2006) Apathy and the functional anatomy of the prefrontal cortex-basal ganglia circuits. Cereb Cortex