HAL Id: hal-00553202
https://hal.archives-ouvertes.fr/hal-00553202
Submitted on 6 Jan 2011
HAL is a multi-disciplinary open access
archive for the deposit and dissemination of
sci-entific research documents, whether they are
pub-lished or not. The documents may come from
teaching and research institutions in France or
abroad, or from public or private research centers.
L’archive ouverte pluridisciplinaire HAL, est
destinée au dépôt et à la diffusion de documents
scientifiques de niveau recherche, publiés ou non,
émanant des établissements d’enseignement et de
recherche français ou étrangers, des laboratoires
publics ou privés.
doi:10.5194/angeo-28-1923-2010
© Author(s) 2010. CC Attribution 3.0 License.
Geophysicae
Communica
tes
Recent changes in measured wind in the NE Atlantic and variability
of correlation with NAO
P. A. Pirazzoli1, A. Tomasin2, and A. Ullmann3
1CNRS – Laboratoire de G´eographie Physique, 1 Place Aristide Briand, 92195 Meudon cedex, France 2ISMAR-CNR, Venezia and Dipartimento di Matematica Applicata, Universit`a “Ca’ Foscari”, Venezia, Italy 3Centre de Recherches de Climatologie, Universit´e de Bourgogne, BP 138, 21004 Dijon cedex, France
Received: 4 June 2010 – Revised: 5 September 2010 – Accepted: 10 September 2010 – Published: 25 October 2010
Abstract. The paper deals with wind measurements, recorded since the 1950s, at twelve meteorological stations along a transect near the westernmost European border, be-tween 64◦and 44◦N. Extreme wind speed tends to decrease sharply near the northern boundary (at Reykjavick), near the middle of the study area (at Shannon and Valentia) and near the southern boundary (at Brest and Cap Ferret), to increase at Thorshavn, with less significant trends at the other sta-tions. Average wind speeds confirm the above tendencies, with an additional increasing speed at Lerwick, Kirkwall, Malin Head, Belle-Ile and Cap Ferret.
To compare changes in wind activity, the data have been subdivided into three periods: until 1975, 1976–1992 and 1993–2008. Frequencies have been computed also for the “winter” (October to March) period, per quadrants, and for occurrences exceeding the speed of 15 m s−1.
At Reykjavick a recent increase in the frequency of strong winds has occurred from various directions. Between 62◦N (Thorshavn) and 59◦N (Kirkwall) strong wind has been in-creasing since 1975. Minor changes can be observed at Stornoway, whereas at Malin Head the greatest increase for southerlies and westerlies is observed during the 1976–1992 period. At Belmullet, the frequency of strong southerlies has almost doubled since 1992, while at Shannon and Valentia it remains quite low. Finally at Brest and Belle-Ile, westerlies are predominant among winds > 15 m s−1.
Important changes in time and latitude appear in the correlation with the NAO (North Atlantic Oscillation) in-dex. The highest correlation coefficients, calculated with monthly or seasonal means between the early 1950s and 1975, are observed from between 58◦N (Stornoway) and Iceland, whereas low positive coefficients are reported more
Correspondence to: P. A. Pirazzoli
(pirazzol@cnrs-bellevue.fr)
south. During the period 1976–1992, when increasing NAO index is predominant, positive correlation improves south-wards as far as 54◦(Belmullet) with some improvement also at Shannon and Valentia, while it remains low or even neg-ative near the French Atlantic coast. Finally in the 1993– 2008 period, correlation improves for all the stations south of 54◦N (Belmullet), while it weakens more north.
Keywords. Meteorology and atmospheric dynamics (Cli-matology; General circulation)
1 Introduction
The majority of storms that affect the northeastern Atlantic area originate in the midlatitude westerly wind belt and are generically referred to as extratropical storms (Lozano et al., 2004). Their recent evolution is often discussed, but a gen-eral agreement about recent changes in storm and cyclone activity in the extratropical northeast Atlantic is still missing. The North Atlantic Oscillation (NAO) is often considered as the most robust climate teleconnection in the NE Atlantic (Hurrell and Deser, 2009). According to Hurrell et al. (2003), it swings from one NAO phase to the other to produce large changes in the mean wind speed and direction over the At-lantic and the intensity and number of storms. Surface winds are strongest during the cold season. Nevertheless, month-to-month and even year-to-year changes in the phase and ampli-tude of the NAO remain largely unpredictable.
Reanalysis results often show a noticeable increase in the number or in the intensity of cyclone events after 1970 (Lam-bert, 1996; Schmith et al., 1998; Paciorek et al., 2002). Some studies make a distinction between the high-latitude areas, where a significant increasing trend would be observed, and a gradual decrease over the eastern coasts of the Atlantic (Geng and Sugi, 2001; McCabe et al., 2001). Wang et al. (2006)
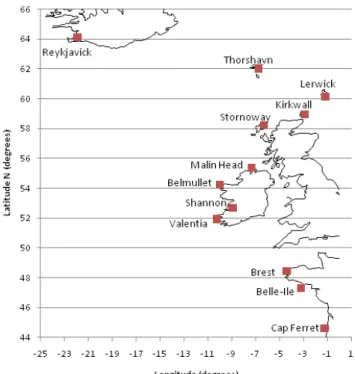
Fig. 1. Location map.
associate such changes in winter with a shifting of about 181 km northward of the mean position of the storm track. According to Gulev et al. (2001), Atlantic cyclone frequency demonstrates a high correlation with NAO.
On the other hand, station measurements of pressure change between October and March would show in Iceland a tendency towards less extreme severe events after 1980, while a tendency towards larger magnitude events was ob-served in the UK regions in recent decades (Alexander and Tett, 2005). According to Alexandersson et al. (2000), an increasing trend in NW Europe storminess – derived from station pressure measurements available since the late 19th century – started in the 1960s, but shows a clear tendency of a reduction in storminess after a maximum around 1990.
In an attempt to clarify recent climate changes in the east-ern North Atlantic area, we collected and analysed statis-tically hourly or three-hourly wind measurements recorded at twelve meteorological stations close to the western bor-der of Europe, i.e. directly exposed to Atlantic storms, be-tween Iceland and France. In this paper, preliminary results and correlation with the NAO index of boreal cold season are presented. The data and methods used are specified in Sect. 2. Results (trends for wind speed, directions of wind occurrences and the temporal variability of strong wind fre-quency) are summarized in Sect. 3. Finally the difficulty of explaining the changes observed, or even of relating them in detail to changes in the NAO index, are discussed in Sect. 4.
Fig. 2. Angular distribution of wind at Stornoway between October
and March.
2 Data and methods
This work is based on the analysis of hourly-type records from twelve meteorological stations: Reykjavick in Iceland, Thorshavn in the Faeroes (Denmark), Lerwick in Zetland (UK), Kirkwall in Orkney (UK), Stornoway in the Outer He-brides (UK), Malin Head, Belmullet, Shannon and Valen-tia in Ireland, and Brest, Belle-Ile and Cap Ferret in France (Fig. 1). Wind data have been generally provided by the Ice-landic Meteorological Office, the Danish Meteorological In-stitute, the Met Office, the Irish Meteorological Service and the M´et´eo France. In hourly-type measurements, wind di-rections are recorded clockwise from the geographical north and correspond to the average direction during the ten min-utes preceding the report time. Wind speed for a specific hour corresponds to the average speed during the same 10 min pe-riod to which the direction is referred. In this work, all speeds have been reduced to the m s−1unit. The records available usually start in the 1950s; some series have been completed for the period 1982–1997 by using the CD “International Surface Weather Observations” produced by the US Depart-ment of Commerce. For the most recent period, the records have been updated to the end of March 2009 by downloading from the Russia’s Weather Service (http://meteo.infospace. ru/wcarch/html/) (accessed April 2009). The frequency of measurements available is most often hourly for Met Of-fice records, hourly or three-hourly for Irish records (with the possible absence of measurements between 15H and 0H UTC), three-hourly for Danish and French records. The data reported by the Russia’s weather server are only three-hourly or six-hourly.
The analysis is based on observations on several wind time series from different sources, without any assurance that they have already been homogenized. Possible changes over time in station location, anemometer elevation or anemometer ex-posure, may cause spurious temporal trends. Caution is,
Table 1. Location of the meteorological stations considered, sources of the data and periods of observation.
Station Available record length
Number Name Lat. N Long. W National authorities NOAA Russia’s weather server 4030 Reykjavik 64◦08′ 21◦54′ 1950–1981, 1998–2000 1982–1997 2000–2009 6011 Thorshavn 62◦01′ 6◦46′ 1953–1981, 1998–2000 1982–1997 2000–2009 3005 Lerwick 60◦08′ 1◦11′ 1957–1982, 1988–2000 2000–2009 3017 Kirkwall 58◦57′ 2◦54′ 1957–1963, 1965–1966, 1971–1972, 1976, 1981, 1998–2000 1982–1997 2000–2009 3026 Stornoway 58◦13′ 6◦19′ 1957–1982, 1988–2000 1983–1987 2000–2009 3980 Malin Head 55◦22′ 7◦20′ 1955–1981, 1998–2000 1982–1997 2000–2009 3976 Belmullet 54◦14′ 10◦00′ 1956–2000 2000–2009 3962 Shannon 52◦42′ 8◦55′ 1950–1981, 1998–2000 1982–1997 2000–2009 3953 Valentia 51◦56′ 10◦15′ 1950–2000 2000–09 7110 Brest 48◦27′ 4◦42′ 1949–2004 2005–2009 7207 Belle-Ile 47◦18′ 3◦17′ 1949–2004 2005–2009 7500 Cap Ferret 44◦63′ 1◦25′ 1949–2004
therefore, necessary for the preliminary nature of the results of this study. Due to the inhomogeneous temporal distribu-tion, 99th percentiles have been preferred to maximum val-ues for the estimation of annual extremes. However, an in-homogeneity may have been introduced also in the 99th per-centiles by using hourly or three-hourly data prior to 2000, or three or six-hourly data from 2000 on (with the shift towards the Russian data source). While mean values may not be af-fected by changes in the sampling frequency, higher values (like the 99th percentiles) might be slightly modified. The location of the meteorological stations, sources of data and periods of observations have been specified in Table 1. In ad-dition to the usual representations, a quantity more related to dynamics was computed: given a direction of interest, from each observed wind vector a contribution was taken by pro-jection on it, and added if positive.
The Gibraltar-Iceland NAO index, originally produced by Jones et al. (1997) and updated by Osborn (2006), is used. Monthly data until the year 2000 are available via ftp at the url: ftp://ftp.cru.uea.ac.uk/data. 2000-to-present monthly data are available at the url: http://www.cru.uea.ac.uk/∼timo/ projpages/nao update.htm.
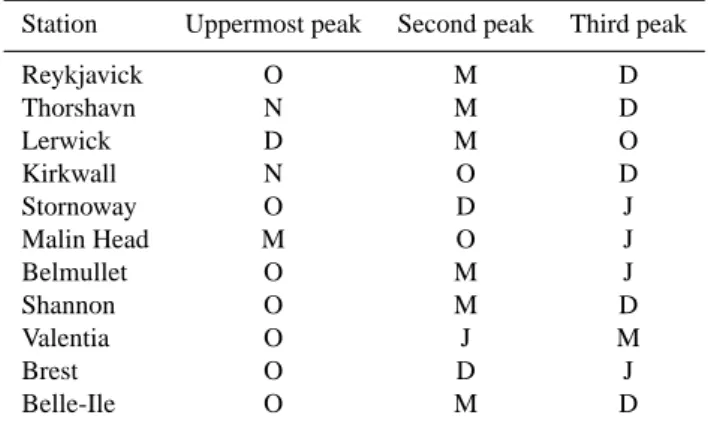
Statistical values were computed for full years as well as for “winter” (boreal cold season: ONDJFM) periods. The period ONDJFM was preferred to the DJFM period, often used for “winter” by Hurrell (1996) or by Osborn (2004), be-cause in the area considered dominant monthly wind peaks are often recorded in October and sometimes also in Novem-ber (Fig. 2, Table 2). In this paper, “Winter”, e.g. for the year 2008, means the period from October 2008 up to and includ-ing March 2009. With the same yearly convention, the cold season NAO indexes used are summarized in Fig. 3.
To identify changes in tendency or evolution in correla-tion coefficients, three periods have been considered: a) from
Fig. 3. Boreal cold season (October to March average) NAO index
from 1950–1951 to 2008–2009.
the beginning of the record to 1975; b) from 1976 to 1992; c) from 1993 to 2008. The 1975 limit has been chosen be-cause a number of studies have suggested that a change in certain climatic trends may have occurred around the mid-1970s in the Northern Hemisphere (e.g., Folland et al., 2001; Pirazzoli and Tomasin, 2003); the year 1992 has the advan-tage to cut the 1976–2008 period into two similar parts.
Linear trends have been determined by regressions with slope uncertainties and the statistical confidence.
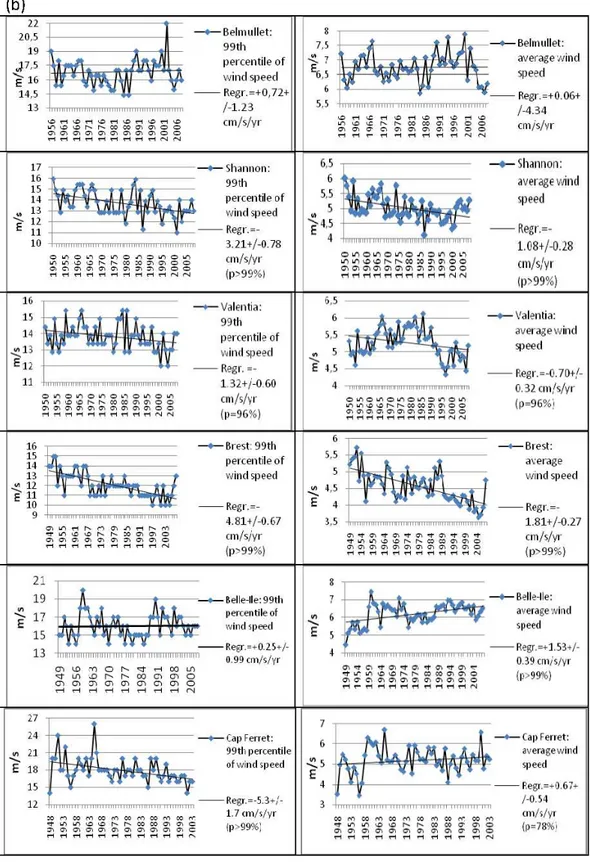
Fig. 4a. Recent changes in extreme (99th percentile) and average wind speed (all directions): (a) at Reykjavick, Thorshavn, Lerwick,
Kirkwall, Stornoway and Malin Head; (b) at Belmullet, Shannon, Valentia, Brest, Belle-Ile and Cap Ferret.
3 Results
3.1 Overall trends for wind speed
Recent changes in extreme (99th percentile) and average wind speeds are reported for all directions in Fig. 4.
Ex-treme wind speed tends to decrease sharply near the northern boundary of the transect considered (at Reykjavick), near the middle of the study area (at Shannon and Valentia) and near the southern boundary (at Brest and Cap Ferret), to increase rapidly at Thorshavn, with less significant trends at the other stations. Average wind speeds confirm the above tendencies,
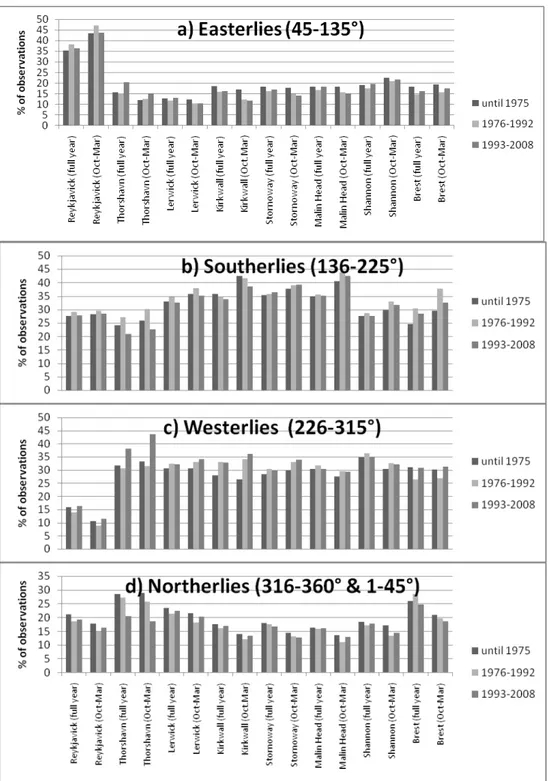
Fig. 5. Frequency of wind measurement in different periods (full year and October to March) at Reykjavick, Thorshavn, Lerwick, Kirkwall,
Stornoway, Malin Head, Shannon and Brest. (a) easterlies, (b) southerlies, (c) westerlies, (d) northerlies.
with additional increasing speeds also at Lerwick, Kirkwall, Malin Head, Belle-Ile and Cap Ferret.
3.2 Direction of wind occurrences
In Fig. 5, the percentage frequency from each quadrant is given for the periods until 1975, 1976–1992 and 1993–2008,
for the full year, and for the October–March periods. Similar frequencies for Belmullet, Valentia and Belle-Ile were sum-marized in a previous publication (Pirazzoli, 2005, Fig. 6).
The wind distribution at Reykjavick is clearly different from that of the other stations considered, with much more frequent easterlies and less frequent westerlies, especially for the winter periods; easterlies generally decrease slightly
Fig. 6a. Distribution of wind directions for October to March measurements of wind speed > 15 m s−1for the periods until 1975, 1976–1992
and 1993–2008: (a) Reykjavick, Thorshavn, Lerwick, Kirkwall; (b) Stornoway, Malin Head, Belmullet and Shannon; (c) Valentia, Brest, Belle-Ile and Cap Ferret.
Fig. 6b. Continued.
during winter and after 1975 in the other stations, except at Shannon, where they show a small increase in winter. Similar winter increases for easterlies have been observed at Belmul-let and Valentia (Pirazzoli, 2005).
Southerlies predominate between Lerwick and Malin Head, especially in winter and generally show an increase be-tween 1976 and 1992. Westerlies represent about 30% of the observations at most stations (except Reykjavick) and tend to increase since 1993 between Thorshavn and Stornoway
Fig. 6c. Continued.
Table 2. Months between October and March, at each station
con-sidered, exhibiting peaks in the angle of wind origin (using sum of speeds).
Station Uppermost peak Second peak Third peak Reykjavick O M D Thorshavn N M D Lerwick D M O Kirkwall N O D Stornoway O D J Malin Head M O J Belmullet O M J Shannon O M D Valentia O J M Brest O D J Belle-Ile O M D
(especially in winter). Northerlies tend to decrease with time in most stations, particularly in winter.
3.3 Temporal variability of strong wind frequency In order to clarify the recent evolution of strong wind oc-currences, the frequency of directions for winds exceed-ing 15 m s−1 during the cold season has been reported in Fig. 6 for the periods before 1976, 1976–1992 and 1993– 2008. It appears that at Reykjavick (Fig. 6a) the frequency of strong wind has been decreasing between 1976 and 1992, then strongly increasing from various directions after 1993.
At Thorshavn, strong wind has been increasing from all di-rections after 1975, with a remarkable recent peak of 14‰ of occurrences for westerlies during the most recent period. At Lerwick the increase after 1975 is general for all strong southerlies and westerlies, with a frequency of occurrences that is almost double of that observed before 1976. Also at Kirkwall strong westerlies have increased substantially after 1975, though the highest peak has been recorded during the 1976–1992 period.
Minor changes can be observed at Stornoway (Fig. 6b), whereas at Malin Head the greatest increase for southerlies and westerlies has occurred during the 1976–1992 period. At Belmullet, the frequency of strong southerlies has almost doubled since 1992, while at Shannon and Valentia the fre-quency of wind speed exceeding 15 m s−1remains low (less than 1.5‰ of the total measurements).
More south, an impressive drop in the frequency of strong westerly wind occurrences has taken place after 1975 along the Atlantic coast of France (Fig. 6c). More detailed informa-tion on wind tendencies at Belmullet, Valentia and Belle-Ile has been reported by Pirazzoli (2005).
4 Correlation with the NAO index
Correlation with the boreal cold season NAO index has been computed at all stations for the periods until 1975, 1976– 1992 and 1993–2008, for several quantiles of wind speed and also for the positive projection upon certain dominant wind directions deduced from angular distribution of energy flux or from certain peaks of Fig. 6. Among the quantiles of wind
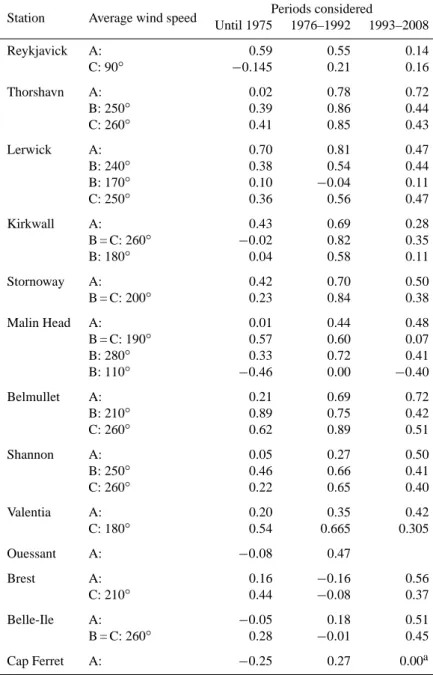
Table 3. Correlation coefficients between wind speed (A: average from all directions; B: the sum of positive projections upon certain
dominant wind directions deduced from Fig. 6; C: the sum of positive projections upon the dominant wind direction deduced from angular distribution of energy flux), and NAO index during the cold season (October to March) along a transect of meteorological stations in the NE Atlantic.
Station Average wind speed Periods considered
Until 1975 1976–1992 1993–2008 Reykjavick A: 0.59 0.55 0.14 C: 90◦ −0.145 0.21 0.16 Thorshavn A: 0.02 0.78 0.72 B: 250◦ 0.39 0.86 0.44 C: 260◦ 0.41 0.85 0.43 Lerwick A: 0.70 0.81 0.47 B: 240◦ 0.38 0.54 0.44 B: 170◦ 0.10 −0.04 0.11 C: 250◦ 0.36 0.56 0.47 Kirkwall A: 0.43 0.69 0.28 B = C: 260◦ −0.02 0.82 0.35 B: 180◦ 0.04 0.58 0.11 Stornoway A: 0.42 0.70 0.50 B = C: 200◦ 0.23 0.84 0.38 Malin Head A: 0.01 0.44 0.48 B = C: 190◦ 0.57 0.60 0.07 B: 280◦ 0.33 0.72 0.41 B: 110◦ −0.46 0.00 −0.40 Belmullet A: 0.21 0.69 0.72 B: 210◦ 0.89 0.75 0.42 C: 260◦ 0.62 0.89 0.51 Shannon A: 0.05 0.27 0.50 B: 250◦ 0.46 0.66 0.41 C: 260◦ 0.22 0.65 0.40 Valentia A: 0.20 0.35 0.42 C: 180◦ 0.54 0.665 0.305 Ouessant A: −0.08 0.47 Brest A: 0.16 −0.16 0.56 C: 210◦ 0.44 −0.08 0.37 Belle-Ile A: −0.05 0.18 0.51 B = C: 260◦ 0.28 −0.01 0.45 Cap Ferret A: −0.25 0.27 0.00a
aincomplete record limited to the year 2003.
speed, the most significant for correlation with NAO is in-deed the average wind speed for all directions. Results are summarized in Table 3.
At Reykjavick, where no wind direction is dominant in a stable manner (Fig. 6a), a sharp decrease in correlation with NAO has occurred since 1993, corresponding to the increase in frequency of strong wind from various directions. The peak of energy flux from 90◦seems unrelated to NAO vari-ability.
At Thorshavn, a marked increase in correlation with the winter NAO index appears after 1975, for the average wind speed from all directions, as well as for projections upon 250◦and 260◦, that reaches a maximum of over 0.86 during the period 1976–1992. The peak of strong westerlies since 1993 (Fig. 6a) was accompanied by a slight decrease in cor-relation with NAO.
At Lerwick, a gradual increase in strong southerlies and westerlies is evident since the beginning of the records
No major changes appear at Stornoway, where the level of correlation with NAO remains relatively high and significant during the various periods considered. Positive correlation is found for all wind directions, with even some improvement, especially between 1976 and 1992, when projections around 200◦are considered.
At the Irish stations, strong wind remains limited at Malin Head until 1975 (Fig. 6b) and there is no correlation between the average wind speed and the NAO index (Table 3). Posi-tive correlation is found for wind projection upon 190◦(that becomes however insignificant after 1992), as well as around 280◦, while a clearly negative correlation exists for projec-tions around 110◦before 1976 and after 1992. At Belmullet, southerly and westerly strong wind peaks appear after 1992 (Fig. 6b). Correlation with NAO is positive for all periods, especially for projections of winds around 210◦. At Shannon, a gradual increase in correlation can be observed throughout the periods considered for the average wind speed. Wester-lies show a strong increase after 1975, followed by a slight decrease after 1992 (Fig. 6b), that may explain the small changes in correlation observed (Table 3). Finally at Valentia correlation with NAO remains limited (between 0.2 and 0.42 for the average wind speed, but some improvement appear for projection upon 180◦.
Along the French Atlantic coast, no clear relationship ap-pears between the drop in the frequency of strong winds after 1975 (Fig. 6c) and the absence of correlation with NAO dur-ing the period 1976–1992, or with the improved correlation after 1993. At Cap Ferret, where our record is limited to 2003, the average wind speed seems anticorrelated to NAO.
In short, it is possible to cut the area considered into two different parts:
1. in the northern part (Northern Atlantic stations and probably also in the North Sea area), changes in cor-relation between wind speed and NAO are usually con-sistent for most winds and also for the dominant ones. When the NAO becomes more positive (negative), the correlation with wind speed increases (decreases), ac-cording to storm track variations;
5 Conclusions
This work considers the “fire front” for storms in the NE area of the Atlantic Ocean, down through the coasts of West-ern Europe, from 1950 to 2008, using a large collection of wind data. It is shown that there is a great difference in the evolution of recent storm frequency between Iceland and the northernmost European islands located a few degrees east-ward. In the former, prevailing winds (especially in win-ter time) are easwin-terlies, whereas in the latwin-ter weswin-terlies or southerlies predominate; in the former, extreme and average wind speed decrease, whereas they increase sharply in Thor-shavn and average wind speed increases moderately also at Lerwick and Kirkwall.
Connection with the values of NAO is unavoidable: the evolution of local winds is compared to the one of this large scale parameter (a lot more robust, being related to the atmo-spheric pressure) and something will be satisfactory, some-thing will not. Over the period 1950–2008, considering the boreal cold season, the NAO pattern shows an important decadal variability and appears to be intense, with its changes in polarity. Observing the three periods of the present study, the central one is impressive with its positive excess (Fig. 3). In this case, the main storm track is displaced more and more northwards. This could be consistent with the decrease of wind speed at Reykjavick, where the speed of the easterlies should decrease. Similarly, Thornshavn increase of wester-lies speed appears fully consistent with the positive polarity of the NAO.
This contrasts with the sharp decrease in extreme and av-erage wind speed along the west coast of Ireland, that seems to extend more south to most Atlantic French coast (Piraz-zoli et al., 2008) and even to the Mediterranean (Piraz(Piraz-zoli and Tomasin, 2003).
Some studies stress the observed correlation with NAO of climate changes over the NE Atlantic or even in western Eu-rope. The present study, based on wind measurements along a transect on the western border of Europe, has shown that even if some recent changes in wind activity indeed exist, they are not always in agreement with NAO. A great tempo-ral and spatial variability can be observed even for stations
that are relatively close to each other and could, therefore, be expected to be affected by similar storm tracks. Of course, local geographical characteristics could play an important role in the discrepancies between close stations.
In short, there is not a uniform tendency, characterised by a general northward shifting of the storm tracks, as claimed by Wang et al. (2006), but a more variable evolution, suggesting rather the occurrence of mutable individual storm trajecto-ries.
With some generalizing, if the average wind speed is con-sidered, it can be said that correlation coefficients above 0.4 for the period between the early 1950s and 1975 are ob-served at Reykjavick and between 60◦(Lerwick) and 58◦N (Stornoway), whereas little positive coefficients are reported more south. During the period 1976–1992, characterised by a clear increase of the NAO index (Fig. 3), positive corre-lation improves southwards as far as 54◦(Belmullet), with some improvement also at Shannon and Valentia, while it re-mains low or even negative near the French Atlantic coast. Finally in the most recent 1993–2008 period, correlation im-proves at all stations south of 55◦N (Malin Head), while it weakens more north (Reykjavick, Kirkwall).
If projections upon dominant wind directions are consid-ered, the variability is even greater, with a general increase in correlation between 64◦and 52◦during the period 1976– 1992 in relation to the preceding period, while a decrease predominates south of Valentia. Lastly, since 1993, a de-crease in correlation between wind activity and NAO is gen-eral, except south of 52◦, where a clear increase is observed at Brest and Belle-Ile.
Though it can be confirmed that station measurements of “winter” pressure increase in Iceland (as reported in the lit-erature) correspond to an overall tendency towards less ex-treme wind events at Reykjavick (Fig. 4a), nevertheless, the frequency of wind > 15 m s−1 from several directions has been increasing from several directions during the 1993– 2008 period (Fig. 5a). Since wind measurements could be quite inhomogeneous, and pressure measurements are usu-ally more reliable, the interpretation of our results should be more focused on pressure analysis: when there is a consis-tency between wind and pressure, it means that the results are robust. To clarify this point a new study of changes in mea-sured air pressure at the same stations of the present study and for the same periods is in preparation by the same au-thors.
Finally this paper shows: (i) the occurrence of average changes in meteorological condition between different lati-tudinal areas, and (ii) that discrepancies may exist between close stations within each of these areas, probably linked with some small variations in storm tracks (especially in the northern part, that is more sensitive to these small variations).
Acknowledgements. We thank R. Barry Hall (Met Office),
St´ephane Costa and Daniel Delahaye (Univ. of Caen) for facilities in meteorological data acquisition.
Topical Editor P. Drobinski thanks one anonymous referee for her/his help in evaluating this paper.
References
Alexander, L. V. and Tett, S. F. B.: Recent observed changes in severe storms over the United Kingdom and Iceland, Geophys. Res. Lett., 32, L13704, 1–4, 2005.
Alexandersson, H., Tuomenvirta, H., Schmith, T., and Iden, K.: Trend of storms in NW Europe derived from an updated pres-sure data set, Clim. Res., 14, 71–73, 2000.
Folland, C. K., Rayner, N. A., Brown, S. J., Smith, T. M., Shen, S. S., Parker, D. E., Macadam, I., Jones, P. D., Jones, R. N., Nicholls, N., and Sexton, D. H.: Global temperature change and its uncertainties since 1861, Geophys. Res. Lett., 28(13), 2621– 2624, 2001.
Geng, Q. and Sugi, M.: Variability of the North Atlantic cyclone activity in winter analysed from NCEP-NCAR reanalysis data, J. Climatol., 14, 3863–3873, 2001.
Gulev, S. K., Zolina, O., and Grigoriev, S.: Extratropical cy-clone variability in the Northern Hemisphere winter from the NCEP/NCAR reanalysis data, Clim. Dynam., 17, 795–809, 2001.
Hurrell, J. W.: Influence of variations in extratropical wintertime teleconnections on Northern Hemisphere temperature, Geophys. Res. Lett., 23(6), 665–668, 1996.
Hurrell, J. W. and Deser, C.: North Atlantic climate variability: the role of the North Atlantic Oscillation, J. Marine Syst., 78, 28–41, 2009.
Hurrell, J. W., Kushnir, Y., Ottersen, G., and Visbeck, M.: The North Atlantic Oscillation. Climatic significance and environ-mental impact, AGU, Washington D.C., USA, Geophysical Monograph 134, viii+279 p., 2003.
Jones, P. D., J´onsson, T., and Wheeler, D.: Extension to the North Atlantic Oscillation using early instrumental pressure observa-tions from Gibraltar and South-West Iceland, Int. J. Climatol., 17, 1433–1450, 1997.
Lambert, S. J.: Intense extratropical northern hemisphere winter cyclone events: 1899–1991, J. Geophys. Res., 101, D1621, 319– 325, 1996.
Lozano, I., Devoy, R. J. N., May, W., and Andersen, U.: Storminess and vulnerability along the Atlantic coastlines of Europe: analy-sis of storm records and of a greenhouse gases induced climate scenario, Mar. Geol., 210, 206–225, 2004.
Osborn, T. J.: Simulating the winter North Atlantic Oscillation: the roles of internal variability and greenhouse gas forcing, Clim. Dynam., 22, 605–623, 2004.
Osborn, T. J.: Recent variations in the winter North Atlantic Oscil-lation, Weather, 61, 353–355, 2006.
Paciorek, C. J., Risbey, J. S., Ventura, V., and Rosen, R. D.: Mul-tiple indices of Northern Hemisphere cyclone activity, winters 1949–99, J. Climatol., 15, 1573–1590, 2002.
Pirazzoli, P. A.: Recent changes in surface air pressure and wind activity on the Atlantic coasts of France and Ireland, J. Coastal Res., SI 42, 236–252, 2005.
Pirazzoli, P. A. and Tomasin, A.: Recent near-surface wind changes in the central Mediterranean and Adriatic areas, Int. J. Climatol., 23, 963–973, 2003.