HAL Id: hal-01521866
https://hal.archives-ouvertes.fr/hal-01521866
Preprint submitted on 12 May 2017
HAL is a multi-disciplinary open access archive for the deposit and dissemination of sci-entific research documents, whether they are pub-lished or not. The documents may come from teaching and research institutions in France or
L’archive ouverte pluridisciplinaire HAL, est destinée au dépôt et à la diffusion de documents scientifiques de niveau recherche, publiés ou non, émanant des établissements d’enseignement et de recherche français ou étrangers, des laboratoires
Dynamic Impacts on Growth and Intergenerational
Effects of Energy Transition in a Time of Fiscal
Consolidation
Frédéric Gonand
To cite this version:
Frédéric Gonand. Dynamic Impacts on Growth and Intergenerational Effects of Energy Transition in a Time of Fiscal Consolidation. 2017. �hal-01521866�
Les Cahiers de la Chaire Economie du Climat
Dynamic Impacts on Growth and Intergenerational Effects
of Energy Transition in a Time of Fiscal Consolidation
Frédéric Gonand
1Social planners in most western countries will be facing two long-lasting challenges in the next years: energy transition and fiscal consolidation. One problem is that governments might consider that implementing an energy transition could get in the way of achieving a fiscal consolidation. If so, interrupting the energy transition in a time of fiscal consolidation would involve significant aggregate impacts on activity and intergenerational redistributive effects. This article tries to assess them empirically. It relies on an overlapping-generations framework in a general equilibrium setting, with a detailed energy module. The model is parameterized on data provided by OECD/IEA for France. Different results emerge. Renouncing to the energy transition would slightly foster the level of GDP during the next 10 to 15 years - depending on the dynamics of the prices of fossil fuels on world markets - but weigh on it more significantly afterwards (up to -1% in 2050). If the prices of fossil fuels keep increasing in the future, implementing an energy transition could have broadly the same favourable effects on the GDP level in the long run as those of a fiscal consolidation diminishing significantly public spending instead of raising taxes. In the long-run, the GDP would be maximized by implementing an energy transition and simultaneously lessening the public deficit by lowering some public expenditure, a policy that would entail an overall gain of around 1,6% of GDP in 2050. Stopping the energy transition would also bring about intergenerational issues. It would be detrimental to the intertemporal wellbeing of almost all cohorts alive in 2010. A fiscal policy with lower public expenditures and frozen tax rates may be still more favourable to young and future generations than implementing an energy transition. However, renouncing to an energy transition would annihilate most of these pro-youth effects.
JEL classification: D58, D63, E62, L7, Q28, Q43
Keywords: Energy transition, intergenerational redistribution, overlapping generations, fiscal
consolidation, general equilibrium
n° 2014-01
Working Paper Series
1. Paris-Dauphine University (LEDa-CGEMP)
Dynamic Impacts on Growth and Intergenerational Effects
of Energy Transition in a Time of Fiscal Consolidation
Frédéric Gonand
University of Paris-Dauphine (LEDa-CGEMP)
January 11, 2014
Abstract
Social planners in most western countries will be facing two long-lasting challenges in the next years: energy transition and fiscal consolidation. One problem is that governments might consider that implementing an energy transition could get in the way of achieving a fiscal consolidation. If so, interrupting the energy transition in a time of fiscal consolidation would involve significant aggregate impacts on activity and intergenerational redistributive effects. This article tries to assess them empirically. It relies on an overlapping-generations framework in a general equilibrium setting, with a detailed energy module. The model is parameterized on data provided by OECD/IEA for France. Different results emerge. Renouncing to the energy transition would slightly foster the level of GDP during the next 10 to 15 years -depending on the dynamics of the prices of fossil fuels on world markets - but weigh on it more significantly afterwards (up to -1% in 2050). If the prices of fossil fuels keep increasing in the future, implementing an energy transition could have broadly the same favourable effects on the GDP level in the long run as those of a fiscal consolidation diminishing significantly public spending instead of raising taxes. In the long-run, the GDP would be maximized by implementing an energy transition and simultaneously lessening the public deficit by lowering some public expenditure, a policy that would entail an overall gain of around 1,6% of GDP in 2050. Stopping the energy transition would also bring about intergenerational issues. It would be detrimental to the intertemporal wellbeing of almost all cohorts alive in 2010. A fiscal policy with lower public expenditures and frozen tax rates may be still more favourable to young and future generations than implementing an energy transition. However, renouncing to an energy transition would annihilate most of these pro-youth effects.
JEL classification: D58 - D63 - E62 - L7 - Q28 - Q43.
Key words: Energy transition intergenerational redistribution overlapping generations -fiscal consolidation - general equilibrium.
E-mail : frederic.gonand@dauphine.fr . I am indebted to Patrice Geoffron, Jean-Marie-Chevalier, the participants of the FLM meeting of the Climate Economic Chair and two of its anonymous referrees, Boris Cournède, Peter Hoeller, Dave Rae, David de la Croix, Jørgen Elmeskov for useful comments and discussions on earlier drafts. All remaining errors are mine.
1
Introduction
Social planners in most western countries will be facing two long-lasting challenges in the next years: energy transition and fiscal consolidation. The former has been progressively implemented in most countries since the middle of the 2000’s. The need for the latter is more recent and dates back only to the aftermaths of the financial crisis. One problem is that governments might consider that implementing an energy transition could get in the way of achieving a fiscal consolidation. If so, postponing or even stopping the energy transition in a time of fiscal consolidation would involve significant aggregate impacts on activity and intergenerational redistributive effects. This article tries to assess them empirically.
Energy transition aims at progressively shifting the main sources of energy from fossil fuels to renewables, along with increasing energy efficiency. Developed countries have been feeling the need for energy transition from the beginning of the 2000’s onwards. Energy transition involves in most cases implementing feed-in tariffs for renewables, a carbon tax, and investments to foster energy efficiency.
Fiscal consolidation refers nowadays to balancing public finances in the aftermaths of the fi-nancial crisis, with ageing already weighing on public accounts. The fifi-nancial crisis that has been developing since 2008 triggered massive fiscal expansions in the short run, with governements trying to avoid a global contraction. Since 2011 however, large public deficits have increasingly brought about the need for fiscal consolidation. The macroeconomic context now remains adverse because the negative supply-side effects of the crisis on GDP are still significant and hinder the economic recovery.
In this context, governments might consider that implementing an energy transition could get in the way of achieving the fiscal consolidation. Indeed, implementing a carbon tax with a significant rate can become uneasy for governements when tax rates and public deficits are already high. Increasing the prices of electricity through higher feed-in tariffs can bring about debates if aggregate demand remains sluggish and aggregate supply suffers from a lower profitability. Raising energy efficiency gains may require additional public spending and/or investment for which financing may no longer be easily available. In brief, an energy transition may push up taxes and public spending, while fiscal consolidation in countries with high tax rates requires at least some lower spending and not too many additional taxes. Implementing an energy transition could thus hinder achieving fiscal consolidation.
Postponing or even stopping the energy transition because of constraints on fiscal policy would involve significant aggregate effects, however. The influence of energy transition on economic growth flow through different channels. Energy transition can shelter the economy from the detrimental effects stemming from the increasing prices of fossil energy ressources on world markets. It impacts the volumes on the energy market by bolstering some technologies of production and fostering energy efficiency. It can modify the private agents’ income for non-energy goods and services, and thus the dynamics of capital accumulation and growth.
The influence of energy transition on activity is interrelated with the impact of fiscal policy on growth. A carbon tax can alleviate pressures for increasing direct taxes by replacing them with less distorsive, indirect taxes, thus allowing for a "double dividend" and modifying the energy mix. It
can contribute significantly to the reimbursement of the public debt accumulated after the financial crisis.
The influence of energy transition on activity may also depend on the time horizon considered. Energy transition can require more capital accumulation in the short run, new subsidizing schemes, temporarily higher prices in some cases. However, it normally fosters gains in energy efficiency in the long run, and alleviates tensions on the average price of energy if the future prices of fossil fuels keep increasing. Accordingly, energy transition might weigh on aggregate activity during some period in the short-run and, depending mainly on the dynamics of the prices of depleting ressources of energy in the long-run, favor GDP after some period.
Eventually, the influence of energy transition lasts over a long period - a few decades. Accord-ingly, implementing or interrupting it may raise intergenerational issues in both cases.
While the litterature about the effects of energy transition on growth is relatively abundant, fewer studies deal with the effects of energy transition in a time of fiscal consolidation. The current relative lack of litterature on this question may stem from the rise of both issues on the political agenda of western countries which is recent and rapid. Up to now, most studies linking energy and public finances have focused on energy-producing countries and the implications of oil revenues on their public accounts.
The litterature is even smaller as concerns the intergenerational redistributive effects of imple-menting or interrupting an energy transition. Back in the 1970’s, though, Solow (1974) adressed the relationship between energy transition and intergenerational equity, in a rather theoretical framework analysing the relevance of Rawls’ (1971) maximin criterion. More recently, Stern (2006) revived concerns for the preservation of the wellbeing of future generations through accurate climate policies. Yet, his study focused mainly of discount rate issues.
The present article simulates the empirical effects on potential (i.e., long-run) growth of scenarios incorporating either a comprehensive policy of energy transition, or stopping it from 2010 onwards, in a context of fiscal consolidation. It also assesses their intergenerational redistributive effects. It relies on a general equilibrium model which encapsulates an overlapping-generations framework and a module representing the energy sector. To our knowledge, no EG model with an OLG framework has been developped to date in order to assess the long run impact of energy transition in a time of fiscal consolidation. A general equilibrium setting seems fitting for analysing long-run growth dynamics of interrelated transitions. The overlapping-generations module involves around 60 cohorts each year and allows for a detailed analysis of intergenerational redistributive effects. The model is parameterized on OECD/IEA data for France, a country with sizeable needs of fiscal consolidation and currently involved in some lively energy transition debates.
In the scenarios modeled, two polar options are considered as concerns energy policy: whether the social planner implements an energy transition or renounces to it from 2010 on. Fiscal con-solidation is either mainly tax-based or incorporates significantly lower public expenditures. The simulations assume that the future prices of fossil fuels on world markets will keep increasing in the future. Sensitivity analysis is carried out in case the prices of fossil fuels on world energy markets experience a significant downward trend in the next decade.
tax, an increase in the percentage of renewables in electricity production to 30% in 2020 (with associated impacts on feed-in tariffs and network costs) and an increase in efficiency energy gains from 1,0% per year to 2,0% per year.
As concerns fiscal policy, all scenarios include an anticipated pension reform from 2010 onwards, increasing the average effective age of retirement of 1,25 year per decade - which, per se, strongly moderates the dynamics of public spending in the future. Tax-based consolidations involves mainly that a) the remaining deficit of the pension regime is covered by increases in the social contribution rate, b) non-ageing related public spendings do not decline, c) a specific tax is levied from 2010 on to 2030 to reimburse part of a public debt, and d) if a carbon tax is implemented, the associated income is used mainly to reimburse public debt up to 2030, but can also be partially redistributed to households through lump-sum public expenditures. The second type of fiscal consolidation contemplated here involves lower public spending, including a) a lower replacement rate for new retirees to cover the remaining deficit of the pension regime, b) a decline in non-ageing related public spendings so that the associated public surplus is affected to reimburse part of the public debt, c) if a carbon tax is implemented, the associated income is mainly used to reimburse public debt up to 2030.
The results show that renouncing to the energy transition would slightly foster the level of GDP during 10 to 15 years depending on the dynamics of the prices of fossil fuels on world markets -but weigh on it more significantly afterwards (up to -1% of GDP in 2050). Simulations also suggest that, if the prices of fossil fuels keep increasing in the future, implementing an energy transition could have broadly the same favorable medium-run effects on the GDP level in the long run as those of a fiscal consolidation diminishing significantly public spending instead of raising taxes. Overall, these results suggest that stopping the energy transition in a time of fiscal consolidation would have detrimental effects on growth from the 2025-2030 onwards, at least on French data. In the long-run, the GDP would be maximized by implementing an energy transition and simultaneously lessening the public deficit by lowering some public expenditures, a policy that would entail an overall gain of around 1,6% of GDP in 2050.
Stopping the energy transition would also bring about intergenerational issues. The OLG module of the model allows for analysing these effects with precision. First, results suggest that stopping the energy transition would be detrimental to the intertemporal wellbeing of almost all cohorts alive in 2010. Accordingly, implementing an energy transition may be close to be a Pareto-improving policy, at least as far as intertemporal wellbeing is concerned.
On the other hand, fiscal policy with lower public expenditures may be more favorable to young and future generations than implementing an energy transition. Lower public spending allows for freezing the levels of taxes in a period when ageing puts Social Security under financial pressure. This effect is especially favourable to young workers who, otherwise, would have paid higher taxes and contributions rates during their whole remaining working life. However, renouncing to implement an energy transition would annihilate most of these favourable, pro-youth effects of a fiscal consolidation with lower spending. These results shed some new light on the possible arbitrage looming between implementing an energy transition and achieving a fiscal consolidation: by renouncing to the former, social planners would undermine most of the pro-youth effects of the latter.
the next 10-15 years, postponing the energy transition may foster somewhat the GDP level during around 15 years without entailing strong intergenerational effects. This does not downplay the need for an energy transition but suggest that the dynamics of its implementation should take account of the dynamics of the prices of fossil fuels on world markets in the future.
These results are relatively robust to alternative assumptions as concerns prices of fossil fuels on world markets. They are not significantly related, either, with the specificities of the energy-mix in France and its relatively prominent role of nuclear in electricity generation. They stem from a model parameterized on OECD/IEA data for a country (i.e., France) which is experiencing fiscal imbalances that are comparable in intensity to those of many other developed countries nowadays - with Germany being a notable exception.
The remaining of this article is organised as follows. Section II reminds of some important results in the litterature focusing on the aggregate effects on activity of energy transition. Section III introduces the model used in this article, which combines an OLG framework with an EG setting. Section IV presents the results obtained as concerns the dynamic impacts on growth of energy transition in a time of fiscal consolidation, and expands on their intergenerational redistributive effects with some possible policy implications they bring about. Section V concludes.
2
Assessing the aggregate impact on activity of energy
tran-sition: brief insights from the litterature
A brief overview of some past debates in energy economics is useful for the modeler contributing to the current debates about energy transition. The oil crisis in the 1970’s prompted a rapid surge in the economic litterature trying to understand and assess the aggregate impact on activity of a hike in energy prices. To simplify, three mains areas of interest of the litterature emerged at that time. The first concerned studies about the "energy intensity", its determinants, its heterogeneity among different countries and its historical - mainly downward - trends (Schurr, 1984). Account-ing methods disintangled different channels of energy intensity broken down by industry branches (Criqui, 1982). Input-output matrices were used to analyse the dynamics of prices involved by an oil shock across different industries through energy intensity coefficients by industry (OECD-IEA, 1979). While interesting, this is not the part of the litterature this article will mainly rely on.
The second area of research focused on the demand of energy, using mainly econometrics to assess, for instance, income-elasticities or price elasticities, in the short run as well as in the long-run; or interfuels substitution of elasticities. It is not the scope either of this article to expand on this issue; though the litterature on energy demand may be helpful when parameterizing the general equilibrium, analytical, model used in this article.
Thirdly, a vast litterature emerged in the 1970’s with production functions enshrining energy as an additional input along with physical capital and labour. Cobb-Douglas production functions with energy, assuming ex-ante and ex-post substituability between labour, physical capital and energy, proved easy to manage - but unsufficiently realistic. In order to simulate more precisely the gradual diffusion of technological progress and higher energy efficiency to the stock of physical
capital, models with generations of capital were developped. However, they were unsufficiently manageable for empirical studies. By contrast, constant elasticity of substitution (CES) functions including energy have been extensively used in the empirical litterature. They were considered as an acceptable compromise between the Cobb Douglas function (which assumes full substituability) and the Leontieff function (which assumes full complementarity) (see, for instance, Solow (1978)). They owed much to Sato (1967) who generalized CES functions incorporating more than two inputs. Hogan and Manne (1977) additionally suggested that the (hard-to-measure) elasticity of substitu-tion between energy and capital in a CES funcsubstitu-tion could be proxied by the price-elasticity of the energy demand, which is easier to assess. Following a debate between Berndt and Wood (1975) and Griffin and Gregory (1976), it is generally agreed nowadays that physical capital and labour are partial substitutes, especially in the long-run.1
All these results have been paving the way for numerous empirical studies relying on EG mod-els with CES production functions including energy as a third input. Energy CGE modmod-els have been commonly used, for example in the energy efficiency and rebound literature (Grepperud and Rasmussen, 2004; Wissema and Dellink, 2007), and have relied routinely on nested CES functions (e.g., Perroni and Rutherford (1995), Böhringer and Rutherford (1997)).
In 2010, the Energy Journal published a special issue presenting a set of models assessing the long-run costs of meeting the 450ppm objective (Knopf et al., 2010), with models such a POLES (Kitous, Criqui, Bellevrat and Chateau, 2010) where GDP remains exogenous; MERGE (Magné, Kypreos and Turton (2010) where GDP is endogenous and technological change includes learning-by-doing effects), E3MG (Barket and Serban Scrieciu (2010) who use a neo-keynesian setting) and REMIND-R (Leimbach, Bauer, Baumstark, Lüken, Edenhofer (2010)).
REMIND-R is a GE-model with a standard nested CES production function including en-ergy and an enen-ergy module distinguishing fuels costs, investment costs and operational costs for each energy. The model maximises aggregate consumption over time on a 5-years to 5-years basis. REMIND-R has thus common features with many standard CGE models applied to energy models (see also Cassen et al. (2010) for the Imaclim model).
Overall, these GE models suggest that meeting with the 450ppm aim may be technologically feasible and would entail a loss of a few percentage points of discounted GDP in the long run (i.e., 2050) (Knopf et al., 2010). Such an order of magnitude at this horizon seems relatively benign to not a small number of analysts. However, it amounts to loosing around -0,1% or -0,2% of GDP growth per year, something which would nowadays seem hardly bearable for not a small number of European decision makers, given the sluggish growth rate in their countries and the deteriorated situation of their fiscal balances. Moreover, to our knowledge, no CGE model with an energy module has been developed to date that includes an overlapping-generations framework, which seems a necessary input for analysing precisely, on the aggregate scale, the intergenerational redistributive effects of policies implemented over a long period of time.
1The use - and even validity - of aggregate production functions has been criticized by some prominent economists
(see Cohen and Harcourt (2003) for an account), raising problems about measurement of capital or factor shares. Other no less prominent economists (as Solow, Stiglitz, Samuelson and Hahn) have been advocating in favor of using aggregate production functions, though. Partially related debates nowadays have arisen concerning the accuracy of using production functions with constant elasticity of substitution when simulating energy transition in the very long-run (for instance, when CO2 prices rise in very important proportions).
Accordingly, some further detailed analysis seems required as concerns the impact of energy transition on the annual GDP dynamics in the next decades and its intergenerational redistributive effects. This is all the more required as, as explained in the introduction, governements might nowadays consider that implementing an energy transition could get in the way of achieving fiscal consolidation. The above quoted GE models, while accurate for assessing the long-run impact and feasibility of energy transition, are not specifically designed to answer the question of the dynamics of the year-to-year effects on growth of implementing - or interrupting - an energy transition in a time of fiscal consolidation, nor the question of the implied possible intergenerational effects. Accordingly, this model benefits from the experience accumulated by GE modelers in energy economics but applies it to somewhat new issues. It adopts more closely the viewpoint of a national policy maker concerned primarily with growth and intergenerational equity at the national level. The aim here is not to minimize the quantity of CO2 produced by the world economy. The objective of the domestic social planner consist in trying to preserve potential GDP growth and intergenerational equity as much as possible.2 Both rank among the main principles guiding economic policy decisions
in practice. Accordingly, the paper introduces some applied normative economic analysis along with EG modeling, a characteristic that may justify the use of a GE model with an OLG framework, which is introduced in the next section.
3
Energy transition in a time of fiscal consolidation: the
model
3.1
An overlapping generation framework in a general equilibrium
set-ting, with a detailed energy sector
The model used in this article is a dynamic general equilibrium model with an overlapping gen-erations framework, a module for energy prices and volumes, a relatively detailed public sector, and private agents belonging to around 60 cohorts of diffent age, optimizing over their life-cycle. It simulates both energy transition in a context of fiscal consolidation so as to compute its impact on GDP growth and its intergenerational redistributive effects. Exogenous energy prices influence macroeconomic dynamics, which in turn affect the level of total energy demand and the future energy mix (as, for instance, in REMIND (Leimbach et al., 2010)).
More precisely, the model encompasses a two-level nested CES production function, a demo-graphic module, different public regimes, an energy module with fossil fuels, electricity and renew-ables, and an OLG framework simulating each year the optimal behaviour of around 60 cohorts of different age. The dynamics of the model is driven by demographics, reforms in the sector of
2In line with most of the literature on dynamic GE-OLG models, the model used here does not account explicitly
for effects stemming from the external side of the economy. First, the main question that is adressed here is: what optimal choice should the social planner do as concerns energy and fiscal transition so as to maximize long-run growth and minimize intergenerational redistributive effects? Accounting for external linkages would not modify substantially the answer to this question. It would smooth the dynamics of the variables but only to a limited extent. Home bias (the “Feldstein-Horioka puzzle”), exchange rate risks, financial systemic risk and the fact that many countries in the world are also ageing and thus competing for the same limited pool of capital all suggest that the possible overestimation of the impact of ageing on capital markets due to the closed economy assumption is small.
Demographics
Labour supply / demand
Capital demand
Interest rate Gross wage
- Health contrib (age-related)
- Debt disimburst tax - Proportional tax financing non-ageing exp
- Pension contrib + Pensions received (variable age of ret., replacement & contribution rates,
« décote »…)
+ Non ageing public lump-sum exp. - Energy expenditures
Net annual income of each cohort
around 60 overlapping cohorts with increasing
life expectancy
Consumption and savings of each cohort Intertemporal utility maximization Profit maximization
Aggregate capital supply per unit of efficient unit CES function
Real end-use price of energy (past and future)
Oil (fuel oil, diesel oil, RON 95)
Past consumption of oil
Natural gas (household & industry) Coal (steam & coking)
Real end-use price of renewables substit. Electricity (households & industry)
Past consumption nat gas Past consumption of coal
Past consumption of biomass, waste, biofuels, biogas
Past consumption of electricity Excise tax and VAT
Carbon tax End-use price excl. taxes Transport, distrib / refining
costs (Real) supply price (Real) imports prices (Real) nal production prices
Imports volume National production volume
Reoptimisation in 2010 if new informational set available
Energy demand (volume)
Public debt reimbursement CES function
Numerical convergence to equalize demand of capital per unit of efficient labour with supply of capital per unit of efficient labour
Optimal capital per unit of efficient labour
(after numerical convergence) Current and intertemporal welfare for each cohort
Intertemporal social welfare GDP (after numerical convergence)
Future energy mix
Excise tax and VAT
End-use price excl. taxes Transport, distrib costs (additional costs for
renewables) (Real) weighted (wholesale) market price
Oil, nat gas & coal prices
Electricity prices
Tax financing feed-in tariffs
Rates of marginality
Clean spark / dark spread (-> main peaker
either coal of nat gas) Feed-in tariffs for wind & PV
Costs of production of electricity
out of coal, natural gas, oil, nuclear, hydro, onshore wind, offwhore wind, PV, biomass.
Fuel costs, thermal efficiency,
carbon price (ETS EU), emission factor, operational costs, overnight investment, cost of capital, lifetime, utilisation rate. For wind and PV: rise in productivity (learning-by-doing). For nuclear: productivity losses (increased safety).
Real weighted end-use prices of…
Future demand for energy (minus hydro,
wind, PV)
Future demand for renewables substitutes Future demand for oil / natural / coal Future demand for oil
Future demand for natural gas Future demand for coal
n-1 Future demand for
electricity Future demand for non
electric energy n
Production function with a CES nested structure
Demand of capital per unit of efficient labour
Figure 1: Summarized structure of the OLG-GE model
energy, reforms of public finances, world energy prices, and optimal responses of economic agents to price signals (i.e., interest rate, wage, energy prices). The final outputs of the model are, for each scenario of reform, annual domestic GDP growth rate and welfare for each cohort, which the national social planner seeks to maximize.
A technical annex presents the model in details. The following paragraphs give the basic insights. Figure 1 delivers a graphic summary of the structure of the EG-OLG model.
3.1.1 The energy sector
The main output of the energy module is an intertemporal vector of average weighted real price of energy for end-users, computed as a weighted average of exogenous end-use prices of electricity, oil products, natural gas, coal and renewables substitutes, where the weighs are the volumes of demand.
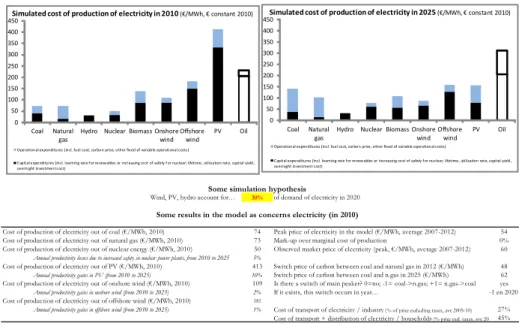
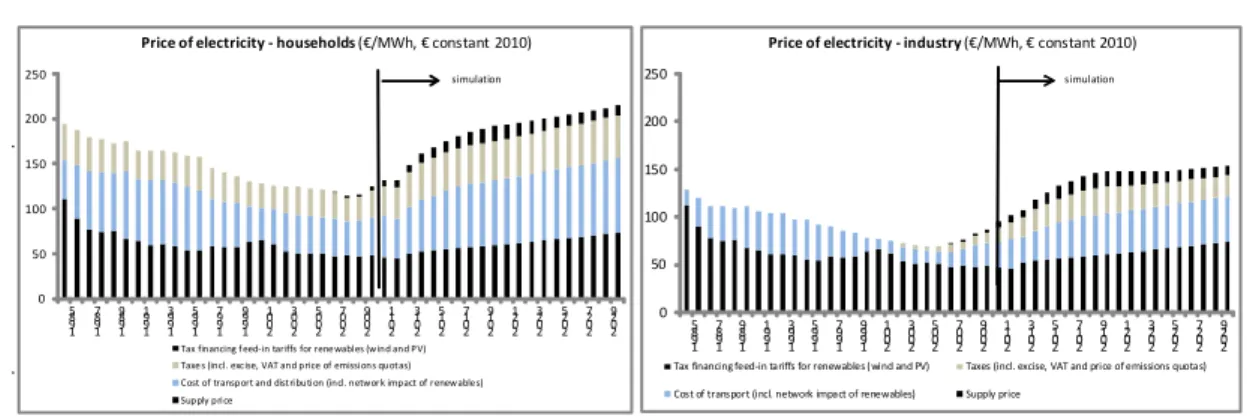
The real end-use price of electricity is a weighted average of prices of electricity for households and industry. In each case, the end-use price is the sum of network costs of transport and dis-tribution, differents taxes and an endogenously generated (structural) wholesale market price of production of electricity. This wholesale market price of production of electricity stems from an endogenous average peak price of electricity and a peak/offpeak spread. The peak market price of production of electricity in turn derives from costs of producing electricity using 9 different tech-nologies3 weighted by the rates of marginality in the electric system of each technology. Costs of
production are the sum of fixed and variables costs. The model computes endogenously the main peaker of the electric system (either coal firing or natural gas firing), depending on CO2 prices, emission factors and fuel costs. It takes account of the impact of the development of fatal produc-ers of electricity4 on market prices of electricity. Network costs of electricity stem from observed
data and take account of supplementary network costs associated with the rise of renewables (IEA, 2012). Taxes on electricity involve VAT, excises, carbon tax and a tax financing feed-in tariffs for renewables. Data for France stem from IEA/OECD databases. This modeling of prices of electricity in the model allows for simulating in a realistic way future end-use prices by making assumptions over a limited set of exogenous variables.5
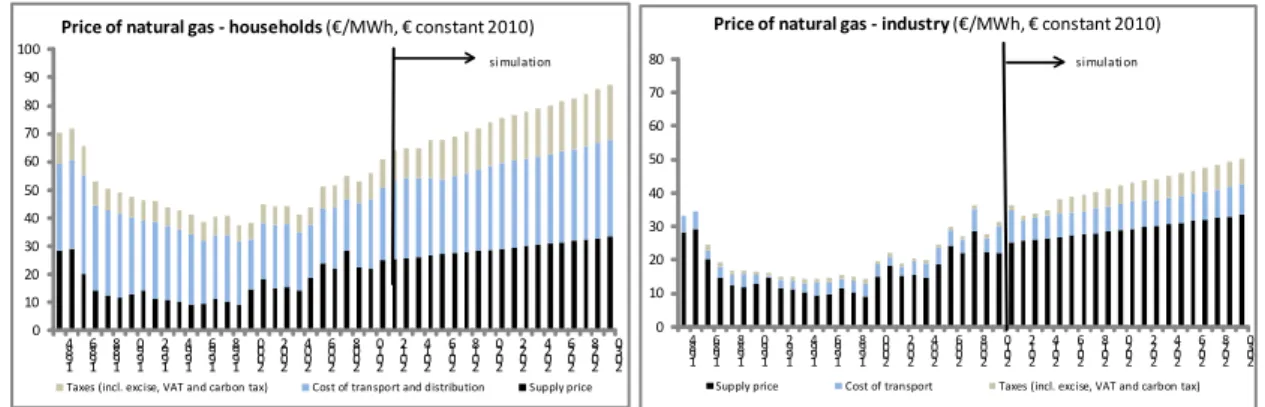
The real end-use prices of natural gas, oil products and coal are weighted averages of end-use prices of different sub-categories of natural gas, oil or coal products.6 The end-use prices of
sub-categories of energy products are in turn computed by summing a real supply price with transport, distribution and/or refining costs, and taxes. The real supply price is a weighted average the prices of domestic production and imports.
Renewables substitutes in the model are defined as a set of sources of energy whose price of production is not influenced in the long-run by an upward Hotelling-type trend; nor by a strongly downward learning-by-doing related trend; and which, eventually, does not contain (much) carbon and/or is not affected by any carbon tax. The demand for these renewables substitutes is approxi-mated, over the recent past, by demands for biomass, biofuels, biogas and waste.7 The real price of
renewables substitutes in the model is assumed to remain constant over time. Such an assumption mirrors two fundamental characteristics of renewables energies: a) they are renewables, hence their price do not follow a rising, Hotelling-type rule in the long-run; b) they are not fossil fuels: hence, the carbon tax does not apply. This assumption of a stable real price of renewables in the long-run also avoids using unreliable (when not unavailable) time series for prices of renewables energies over past periods and in the future. This simplification relies on the implicit assumption that the stock of biomass is sufficient to meet the demand at any time,8 without tensions that could end up in
temporarily rising prices.
3i.e., coal, natural gas, oil nuclear, hydroelectricity, onshore wind, offshore wind, solar photovoltaïc, and biomass. 4Defined as onshore wind, offshore wind and solar PV.
5i.e., mainly, the annual variation of the real prices of fossil inputs; an objective of development for wind and
solar PV in the sector of electricity set by public authorities which in turn requires a tax financing feed-in tariffs and implies rising network costs; rising productivity through learning rate for renewables and productivity loss for nuclear; CO2 prices.
6i.e., natural gas for households, natural gas for industry, automotive diesel fuel, light fuel oil, premium unleaded
95 RON, steam coal and coking coal.
7In the model, wind and solar PV are defined as fatal producers of electricity. The dynamics of their prices is
specific and has been presented above, in the paragraph presenting the prices of electricity.
8On other terms, it is assumed that production of energy out of bioenergies does not trigger any tension on the
Overall, the modeling of prices of natural gas, oil and coal products in the model allows for simulating in a realistic way future end-use prices of energy by making assumptions over a limited set of exogenous variables.9
Energy demand in volume is broken up into demand for coal, oil products, natural gas, electricity and renewable substitutes.10 For future periods, following the litterature (as, for instance, for the
models REMIND or IMACLIM), a CES nest of functions allows for deriving the volume of each component of the total energy demand, depending on total demand, (relative) energy prices, and exogenous decisions of government.
3.1.2 Production function and private agents
The production function is a nested CES one. Caution is required when using constant elasticities of substitution in a GE model with energy. This constancy may bias the results if extreme and/or very long-run scenarios are simulated. For the sake of comparability with most other models existing in the litterature, we abide by the conventional use of nested CES functions. However, we bear in mind that the design of the scenarios should avoid extreme hypothesis as regards, for instance, the rate of the carbon tax or the price of fossil fuels on world markets. Moreover, the results will be commented over a relatively short period (up to 2040-2050 at the maximum) while most GE model with an energy sector comment their results up to 2100.
The nested CES production function has two levels: one linking the stock of productive capital and labour; the other relating the composite of the two latter with energy. The energy mix derives from total energy demand through changes in relative energy prices, which trigger changes in the relative demands for oil, natural gas, coal, electricity and renewables. Accordingly, the modeling allows for a) energy prices to define the total demand for energy, and b) the total energy demand, along with energy prices, to define in turn the demand for different energy vectors.
As concerns private agents, the model embodies around 60 working or retired cohorts each year11,
thus capturing in a detailed way changes in the population structure. Demographic projections flow from a specific simulation model (Gonand, 2005) and rely on official demographic assumptions. Participation rates by age-groups are increasing in line with rising retirement ages (see below, presentation of scenarios). Each cohort is represented by an average individual, with a standard, separable, time-additive utility function and an intertemporal budget constraint. Each average individual of a given cohort decides how much to consume and save so as to maximise the discounted value of his/her lifetime utility subject to his/her intertemporal budget constraint. Households receive gross wage and pension income and pay proportional taxes on labour income to finance a) the PAYG pension regime, b) a health-insurance regime, c) non-ageing related, lump-sum public spendings, and d) in some scenarios, a special tax implemented from 2010 to 2030 in order to reimburse part of a stock of accumulated public debt. Households also pay for energy expenditures, whose amount depends mainly on energy prices, the level of aggregate production and energy efficiency gains.
9i.e., the annual variation of the real import cost of natural gas, the annual variation of the real price of a barel
of Brent, the annual variation of the real import cost of coal, and the implementation, in some scenarios, of a carbon tax.
1 0i.e., mainly, biomass, biofuels, biogas and waste.
3.1.3 Public finances
The public sector is modeled via a PAYG pension regime, a healthcare regime, a public debt to be partly reimbursed between 2010 and 2030; and non-ageing related lump-sum public expenditures.
The PAYG pension regime is financed by social contributions proportional to gross labour income. The full pension of an individual is proportional to its past labour income, depends on the age of the individual and on the age at which he/she is entitled to obtain a full pension. In all scenarios, the legal effective age at which an individual can receive a full pension is raised by 1.25 years every 10 years, from 2010 onwards and until 2050.12 This contributes to lessen sizeably
the imbalances of the PAYG regime in the future. In scenarios with tax-based consolidations, the residual imbalances of the PAYG regime are covered by increases in the tax rate so as to balance the system each year. In consolidations with lower public spendings, the residual imbalances of the PAYG regime are covered by decreases of the replacement rate for future retirees with the taxe rate frozen from 2010 onwards.
The health regime is financed by a proportional tax on labour income and is always balanced through higher social contributions. Health spendings are not modeled as in-cash transfers. They influence favorably the private agents’ utility, however, by contributing to the rise in their life-expectancy in the module for demographics. In other words, the utility associated with the health system is not related with a higher income, but with a longer life.
The non-ageing related public expenditures are financed by a proportional tax levied on (gross) labour income and pensions. Each individual in turn receives in cash a non-ageing related public good which does not depend on his/her age. This is a proxy for public services.
In all scenarios, governement announces in 2010 that the stock of public debt accumulated up to 2009 will start being partly paid back (service included) from 2010 until 2030.13 In tax-based
consolidations, the public debt is paid back thanks to a special, additional proportional tax levied on labour income and pensions between 2010 and 2030. In consolidations with lower public spendings, the reimbursement of the public debt accumulated up to 2009 is financed by lowering non-ageing related public expenditures up to 2030.
3.2
Policy scenarios
This article focuses on simulating the empirical combined effects on potential (i.e., medium-run) growth of different scenarios of energy transition in a context of different possible fiscal consoli-dations, and assesses their intergenerational redistributive effects. In the scenarios modeled, two options are considered as concerns energy policy - whether the social planner implements an energy policy or renounces to it - along with two possible types of fiscal consolidation - whether the con-solidation is mainly tax-based or implements mainly tax restraints -. Sensitivity analysis is carried out in order to assess whether relatively low future prices of fossil fuels on world energy markets in
1 2It is assumed that age-specific participation rates of workers above 50 years of age increase in line with the
changes in the age of retirement. For example, individuals work five years more in 2050 than in 2010.
1 3In the model on French data, the dynamics of the stock of public debt is also influenced by an annual structural
the 2010’s would modify sizeably the results of the model in each scenario (see annex).
In all scenarios, an anticipated pension reform is implemented from 2010 onwards14, with a rise
of the average effective age of retirement of 1,25 year per decade, starting from 61 years in 2010. The health regime remains balanced thanks to increasing social contributions. The public income of a carbon tax (implemented in scenarios 3 and 4 as in Figure 2) increases non-ageing related, lump-sum public expenditures after 2030.
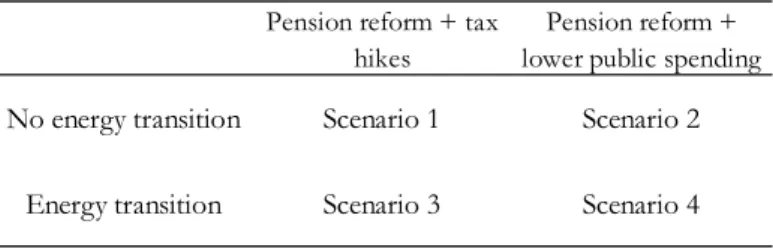
The scenarios simulated with the model are defined as follows:
Pension reform + tax hikes
Pension reform + lower public spending
No energy transition Scenario 1 Scenario 2 Energy transition Scenario 3 Scenario 4
Figure 2: Scenarios of reforms simulated in the model As concerns the two types of energy policy considered:
• Scenarios 1 and 2 assume that the energy transition is interrupted from 2010 onwards. This implies no carbon tax; a percentage of hydroelectricity, wind and PV in electricity demand frozen to its 2011 level15; and no increase in efficiency energy annual gains.16
• Otherwise, in scenarios 3 and 4, the social planner announces in 2010 a reform, non anticipated by private agents, including: a) a carbon tax from 2015 onwards17; b) an increase in
the percentage of hydroelectricity, wind and PV in electricity demand to 30% in 202018, c) a gradual
increase in efficiency energy gains.19
Two types of fiscal consolidation are considered: tax-based consolidations or consolidations relying mainly on lower public spendings:
• first option: a tax-based consolidation involves here: a) the remaining deficit of the pension regime is financed by supplementary increases in the social contribution rate20; b) non-ageing related public spendings do not decline and remain financed by proportional taxes of gross income21; c) a
specific tax is levied from 2010 to 2030 in order to reimburse part of a public debt that amounts
1 4The year 2010 has been selected as the threshold year for simulation in the model mainly because some time
series are not available after this date.
1 5Latest data available.
1 6which remains at 1% per year accordingly.
1 7In the model, the rate of the carbon tax begins at 16€/t in 2015, increases by 5% in real terms per year, until
reaching a cap of 76€/t in 2047 and remaining constant afterwards. The rate of 16€/t stems from a law passed by the French Parliament in late 2013.
1 8With the associated impacts on feed-in tariffs and network costs.
1 9This increase is linear from 1,0% per year in 2010 to 2,0% per year from 2020 on. 2 0On French data, from around 11% in 2010 to close to 15% in 2030.
to around 94% of GDP in 2010 on French data22 and diminishes to 55% of GDP in 2030. Overall,
the total tax rate in the corresponding scenarios rises from 42% in 2009 to 50% in 2029.
• second option: the fiscal consolidation is achieved mainly through significantly lower public expenditures. Government announces in 2010 a reform, non anticipated by private agents, including: a) a lower replacement rate for new retirees to cover the remaining deficit of the pension regime23 ;
b) non-ageing related public spendings declining by more than 3% of gross income in 2010 so that the associated surplus is affected to reimburse part of the public debt.
Scenarios 3 and 4 involve the creation of a carbon tax in 2015. After 2030, when fiscal consoli-dation is achieved, the associated income is entirely redistributed to the households through higher lump-sum public expenditures. Before 2030, when fiscal consolidation is still under way, the income of the carbon tax is shared the between the households and the reimbursement of the public debt, such as the level of public debt reached in 2030 is the same as in the scenarios without carbon tax (i.e., 56% of GDP).24
The four scenarios are simulated assuming relatively high future prices for fossil fuels on world markets. In the model, the price of a barel of oil increases each year, from 2011 onwards, by 3% in real terms (corresponding approximately to the interest on public debt in the model) until 2050, though following a proxy of a Hotelling rule. Prices for a ton of coal and a megawatthour of natural gas rise by 1,5% per year.25 These prices remain constant after 2050 in the model. Sensitivity
analysis is carried out with low future prices of fossil fuels on world markets (see annex).
All the modifications of the informational set of private agents involve a reoptimisation process in 2010, defining new intertemporal paths for consumption, savings and capital supply. The baseline, no-reform scenario is defined as scenario 1. All scenarios rely on an assumption of a total factor productivity (TFP) of 1,5% per year up to 1999, slowing down to 1,0% per year from 2000 to 2020, before going back to 1,5% per year.26 Since the results are expressed as differences between
scenarios, such an assumption does not have any significant influence on the policy implications of the model.
2 2Each year, the interest rate on the debt and 1/41th of the stock are reimbursed. Public deficit before interest
payments is assumed to equal zero. Interest on public debt is 3% lower than the average cost of capital for private agent (i.e., around 3% in the model, in real terms).
The rate of the tax is close to 3%, on average, of gross income (wage and pensions) between 2010 and 2030.
2 3From 62% in 2010 to 47% in 2030.
2 4This ensures comparability among the 4 scenarios modeled here: the intensity of the fiscal consolidation is the
same in all scenarios. This criterion of comparability between the scenarios entails that a) in scenario 3, 100% of the income associated with the carbon tax is affected to the reimbursement of the public debt between 2015 and 2030; b) in scenario 4, around one half of the tax on average over 2015-2030 is affected to the reimbursement of the public debt, the other half being redistributed to households through slightly higher lump-sum public expenditures - especially during the late 2020’s. The difference between both scenarios mirrors the relatively more detrimental impact on tax bases of the tax hikes implemented in scenario 3 (see the presentation of the results, further in this article), which requires that a higher fraction of the income of the carbon tax has to be devoted to the reimbursement of the public debt so as to maintain the same path of the public debt until 2030 as in scenario 4. Had 100% of the carbon tax been affected to the reimbursement of the debt in scenario 4, the debt in 2030 would have been 4 GDP percentage points lower.
The aggregate impact of these hypothesis in the model remains subdued since the level of the carbon tax voted by the French parliament in late 2013 is relatively small (i.e., 16€/t).
2 5Accordingly, the price of a barel of Brent is 157$2010 in 2025; the end-use price of natural gas for household
reaches 75€2010/MWh in 2025; the real supply price of a ton of coal is 99€2010in 2025.
With this setting, the effects of stopping an energy transition can for instance be assessed by computing the differences between the results of scenario 2 and scenario 4 (if governement chooses to implement a fiscal consolidation restraining public spending), or by computing the differences between the results of scenario 1 and scenario 3 (if governement chooses to implement a fiscal consolidation increasing taxes).
4
Results: effects of interrupting or implementing an energy
transition in a time of fiscal consolidation
4.1
Aggregate effects
(The technical annex provides with some additional graphs illustrating the main aggregate effects obtained in the model for some scenarios.)
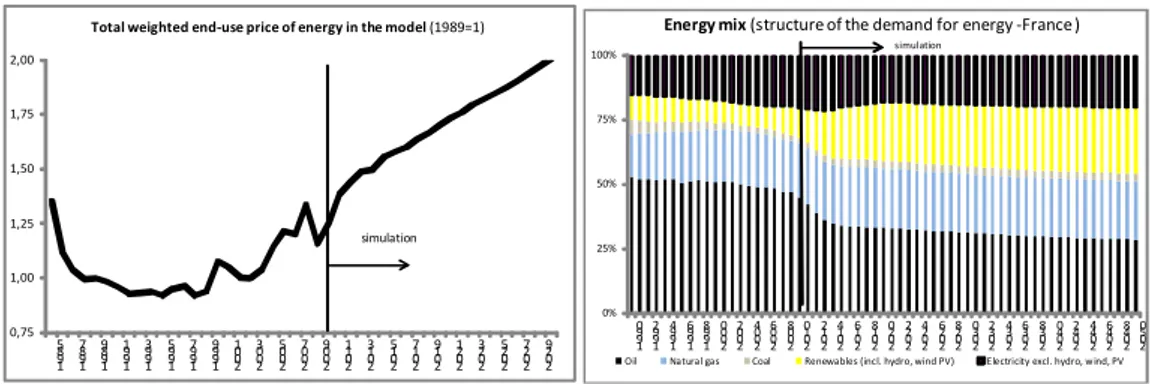
• in the no-reform, baseline scenario 1, the prices of fossil fuels keep increasing over the next decades, by assumption. No specific policy in the 2010’s bolsters the development of the production of electricity out of wind and PV. Accordingly, the amount of the tax financing feed-in tariffs remains subdued - around 4€-5€/MWh. The price of CO2 in the EU-ETS is assumed to remain depressed (at 7€/tCO2). Consequently, coal firing remains the main peaker on the electricity market in the future. The end-use price of electricity for households increases by 26% in real terms between 2010 and 2030. The total weighted end-use price of energy displays an strong upward trend (+44% in real terms from 2010 to 2030). In this context, the total demand for energy does not increase, notably because high prices of fossil fuels weigh on its level. The energy mix displays a rise of the renewable sources of energy mainly because of this surge in the prices of fossil fuels. Since there is no energy policy in favor of energy transition in this scenario, the rise in the percentage of renewables27 in the
mix is subdued, from 12% of total demand in 2010 to 19% in 2025. As concerns public finances, total tax rate increases from 42% of gross income in 2009 to 50% in 202928, which depresses net
income and private capital accumulation. Since the reform of the PAYG pension regime bolsters labour force over the period, the capital per unit of efficient labour unit declines gradually, by 11% between 2009 and 2030.
• in scenario 2 (no energy transition, lower public spending), the energy module displays the same results as in scenario 1, by assumption: high prices fossil fuels, some substitution of renewables, coal remaining as the main peaker on the electricity market. As regards public finances, on the contrary, total tax rate remains broadly stable around 43%-44% of gross income over the next decades - instead of increasing to close to 50% as in scenario 1. Contrary to scenario 1, the capital per unit of efficient labour unit remains almost stable over the next decades.
• in scenario 4 (energy transition implemented, fiscal consolidation with lower public expen-ditures), an energy transition policy is implemented that bolsters the development of renewables
2 7Here defined as encompassing hydroelectricity, wind, PV, biomass, biofuels, biogas.
2 8The year 2029 corresponds to the latest year in the model where a the special tax financing the reimbursement
thanks notably to a carbon tax imposed on fossil fuels. This policy fosters the production of elec-tricity out of wind and PV. By assumption, it doubles the gains of energy efficiency.29 The amount
of the tax financing feed-in tariffs (for wind and PV only) almost doubles from the late 2000’s to 2020, reaching around 15€/MWh. The carbon tax is implemented from 2015 onwards, with a rate of 16€/t. It then increases by 5% in real terms per year and stabilises to 76€/t in 2047. The associated public income increases from around 5bn€ per year to 10bn€. It is shared between the reimbursement of the public debt and the households (through higher public lump-sum expendi-tures) on a 50-50 basis, which ensures to meet a level of public debt of 55% of GDP in 2030. The price of CO2 in the EU-ETS is supposed to be indexed to the rate of the carbon tax and increases thus sizeably. The main peaker on the electricity market remains coal (mainly because the rate of the carbon tax remains low here)30. The end-use price of electricity for households increases by 70%
in real terms between 2010 and 2030, mainly as a consequence of the impact of the development of renewables on taxes and network costs, and the implementation of the carbon tax. The total weighted end-use price of energy displays a very strong upward trend (+60% in real terms from 2010 to 2030). In this context, the total demand for energy remains sluggish over the next decades. Taxation of carbon magnifies the effects on energy demand stemming from high prices of fossil fuels on markets, along with the impact of accelerating gains in energy efficiency. The energy mix displays a rise of the renewable sources of energy31, from 12% of total demand in 2010 to 23% in
2025. As concerns public finances, results are the same as in scenario 2 (i.e., no tax hikes). Capital per unit of efficient labour unit is almost stable over the next decades.
• in scenario 3 (energy transition implemented, fiscal consolidation mainly with tax hikes), the results obtained in the public finance module are very comparable to those presented in scenario 1. The total tax rate increases to 50% of GDP in 2029. In the energy module, results are close to those obtained in scenario 4. The end-use price of electricity displays a very strong upward trend (around +73% in real terms from 2010 to 2030). The energy mix displays a rise of the use of renewables sources of energy32, from 12% of total demand of energy in 2012 to 23% in 2025.
Capital per unit of efficient labour declines significantly over the next decades (-6% between 2009 and 2030). This contrasts with scenario 4 where the capital per unit of efficient labour does not decline in the future decades.33
4.2
Implications on growth dynamics
As suggested in the introduction, the influence of energy transition on activity depends on the time-horizon considered. Energy transition can require new subsidizing schemes, temporarily higher prices in some cases, and more capital accumulation in the short run. In the long-run however, it should foster energy efficiency and allow for lower prices of energy relative to prices of fossil (thus
2 9In the model, efficiency gains in energy increase gradually from +1,0% per year in 2010 to +2,0% per year from
2020 on, by assumption (see supra ).
3 0However, 16€/t is the rate of the carbon tax passed by the French Parliament in late 2013.
3 1This increase mirrors both the effects of the energy transition policy and the increase of the prices of fossil fuels. 3 2This increase mirrors both the effects of the energy transition policy and the increase of the prices of fossil fuels. 3 3This less favourable macroeconomic environment in scenario 3 as compared to scenario 4 explains that the public
income associated with the carbon tax is fully used for reimbursing the public debt in scenario 3, in order for fiscal policy to meet the 55% of GDP target in 2030. In scenario 4, the income associated with the carbon tax is shared between the government (to reimburse the debt) and households (trhough higher lump-sum public expenditures) and the debt target of 55% of GDP in 2030 is still met.
depleting) ressources. Accordingly, energy transition may weigh on aggregate activity during some period on the short-run and favor GDP after some years.
These mechanisms can be quantitatively assessed in the model by comparing the growth rate between different scenarios.34 Results can be summarised as follows: (cf. Figures 3 and 4).
Result 1: the model confirms that stopping the energy transition involves some short-run macro-economic gains but long-run pains, and the higher the market prices of fossil fuels, the lower the macroeconomic gains of interrupting the energy transition. If the prices of fossil fuels keep increas-ing in the future, the defavorable influence of energy transition on GDP could last a little bit more than a decade. The energy transition, as defined in the model on French data, would lessen the GDP level by -0,2% in 2020, before fostering it from 2030 onwards. In 2050, the level of GDP would be 1,0% higher than if energy transition had not been implemented from 2010 on. Would the prices of fossil fuels diminish significantly up to 2020 before rising up again afterwards, then the pain of energy transition would be higher (reaching -0,4% on the GDP level in 2020) and lasts 15 years. This result is intutive. The more expensive fossil energies will be, the more accurate an energy transition would be for future growth, by accelerating the rise of renewables substitutes to fossil fuels. Overall, stopping an energy transition in a time of fiscal consolidation would foster the level of the GDP in the next decade (between +0,2% and +0,4% of GDP in 2020) before depressing it afterwards, up to -1,0% in 2050.
Result 2: a fiscal consolidation diminishing public expenditures instead of raising taxes could trigger, as the implementation of an energy transition, short-term macroeconomic pains but signif-icant long-run gains.35 This is mainly because the latter depresses the accumulation of capital in
the long run whereas the former does not. A permanent rise in social contributions financing PAYG pension regime cannot have any positive effect on savings, while a lower replacement rate strongly encourages agents to increase their saving to maintain their consumption level when retired (Go-nand and Legros, 2009). Reimbursing the public debt by lower public spending between 2010 and 2030 rather than raising new taxes also has a positive effect on capital per unit of labour. Overall, lowering replacement rate of the pension regime and lessening public spending to reimburse the debt weighs on the GDP level by around -1,25% in 2015,36 before fostering it from 2022 onwards.
In 2050, the level of GDP is 0,6% higher than if fiscal consolidation had been achieved through higher taxes. The appropriate conclusion from the model on this specific point is not that public spending is bad per se, but that cuts to - a priori, lower-priority - public spending items might deliver significant gains compared with the alternative of raising taxes.
Result 3: if the prices of fossil fuels keep increasing in the future, energy transition could have broadly the same medium-run effects on the GDP level in the next decades than those of a fiscal
3 4Some remarks may be useful here before commenting on the results. First, when unanticipated reforms are
announced in 2010, each living cohort redefines its optimal intertemporal path for consumption: accordingly, some non-linearities are observed in the endegenous variables of the model, notably GDP. Second, it should be reminded here that all scenarios involve a rise in the effective retirement age of 1,25 year per decade - a framework already slowing significantly the path of public spending. Third, we do not expand here on the dynamics of GDP growth rate in each scenario taken on a one-by-one basis, since these dynamics are influenced by the assumption concerning TFP which is common to all scenarios.
3 5This result stems from the comparison of results between scenario 2 and scenario 1 (cf. Figure 4).
3 6The effects of different types of fiscal consolidation in a context of high energy prices can be computed as the
difference between GDP in scenario 2 and GDP in scenario 1, or by the difference between GDP in scenario 4 and GDP in scenario 3.
Effect on the GDP level 2020 2025 2030 2050
Effect of stopping the energy transition (in a context of fiscal consolidation restraining public spending) (scenario 2 - scenario 4)
(the effect of implementing an energy transition would have the opposite sign)
0,2% 0,1% 0,0% -1,0% Effect of stopping the energy transition (in a context of fiscal consolidation
increasing taxes) (scenario 1 - scenario 3)
(the effect of implementing an energy transition would have the opposite sign)
0,1% 0,0% -0,2% -1,0% Effect of lowering public spending instead of raising taxes, and no energy
transition (scenario 2 - scenario 1) -0,1% 0,2% 0,3% 0,6%
Best policy response as concerns the GDP level: scenario… 1 2 4 4
Effect of stopping the energy transition (with a fiscal consolidation restraining public spending) 0,4% 0,2% -0,1% -1,0% Effect of lower world energy prices with no energy transition and tax hikes 1/ 1,8% 2,2% 2,3% 2,8% Effect of lower world energy prices with no energy transition and lower public spending 1/ 2,4% 2,7% 2,7% 3,3%
Impacts on GDP level of some reform scenarios
All the scenarios include a pension reform increasing the average effective age of retirement by +1,25 year per decade, and the reimbursement of around half the public debt between 2010 and 2030
1/ Hypothesis of lower energy price: from 2010 on, energy prices of world markets (oil, coal, natural gas) diminish in 2010-2020 up to their 30-years average level, before increasing again afterwards to follow a proxy of a Hotelling rule (+3% real per year) until 2050.
Sensitivity analysis with lower prices of fossil energies on world markets 1/
Figure 3: Impact on the GDP level of different reform scenarios
-1,5% -1,0% -0,5% 0,0% 0,5% 1,0% 1,5% 2000 2005 2010 2015 2020 2025 2030 2035 2040 2045 2050
Effect of energy transition with lower public spending (scenario 4 - scenario 2) Effect of lower public spending with no energy transition (scenario 2 - scenario 1)
Impact on the GDP level
2010: private agents reoptimize their intertemporal profile of consumption when the reforms are announced.
consolidation diminishing significantly public spending (cf. Figure 3 and 4). Both transitions lessen GDP during around a decade before fostering it somewhere during the 2020’s. In the long run, the positive effect is close to +0,75% of GDP around 2045 in both policies (see Figure 4).
Result 4: the best policy response in terms of GDP depends on the horizon considered but always encapsulates an energy transition and lower public expenditures in the long run. The best policy response in terms of GDP is defined here as the policy package mixing a fiscal consolidation and an energy policy that maximises their joint impact on GDP. By definition, this optimal policy response depends on the horizon considered. From 2027 onwards, it involves in all cases triggering an energy transition and lessening public spending. Such a package entails a gain of 1,6% of GDP in 2050 in the model on French data.37
Result 5: the effect on GDP of significant variations of market prices of fossil fuels are far higher in the short run than those of the policies analysed here. This stems from the results of the sensitivity analysis as summarized in Figure 3 and detailed in annex. For instance, the effect on the GDP level of unanticipated, sizeably lower prices of fossil fuels during the next decade could be around 2% in 2020.
Result 6: the effects of an energy transition on GDP in the model does not contradict the conventional wisdom of the "elephant and rabbit" tale in energy economics, i.e., the impact on growth of energy transition remains relatively subdued. In the long-run, around 2050, an energy transition is expected to have a favourable impact on the level of GDP of 1%. It could be shown that pension reforms incorporating a significant rise in the age of retirement entail much higher effects on the GDP level. Our results seem to be in line with the so-called tale of the elephant and the rabbit (Hogan and Manne, 1977) according to which the size of the energy sector in the economy bares it to entail very sizeable effects on growth. We only remind here that what was accurate when Hogan and Manne wrote their article, might be less so in our post-financial crises era characterized by very limited growth. Consequently, this result does not downplay the interest of studying the joint impact of energy transition and fiscal consolidation on growth.
Overall, these results suggest that stopping the energy transition in a time of fiscal consolidation would have detrimental effects on growth from the middle of the 2020’s onwards, and that these effects are not negligible - at least on French data (see caveats below). In the long-run, the GDP would be maximised by implementing the energy transition and simultaneously lessening the public deficit by lowering some public expenditures.
Some caveats are in order when commenting on these results:
• in the model, the gains in energy efficiency are exogenous. In practice, they may require costly investments possibly crowding out other private projets. From this point of view, the model may underestimate the negative effects of energy transition on growth, ceteris paribus.
• this version of the model does not encapsulate an endogenous working time. Endogenising the labour market in such models raises specific issues (see Cournède and Gonand, 2006) without modifying strongly the quantitative results. However, it would allow for taking account of the distor-sive effects associated with tax hikes. From this viewpoint, the model might somewhat undermine
3 7Before 2027, the best policy package as defined above does not encapsulate an energy transition. For the next
the favorable effects on growth of lower public spendings compared with higher tax rates, ceteris paribus.
• the model does not take account of the favourable economic effect of energy transition on domestic independance as concerns energy. Developing renewable sources of energy lessens the dependance vis-a-vis foreign producing countries, thus lowering, on average, the price of energy, with the associated favorable impact on growth.
• these results, stemming from a model parameterized on OECD/IEA data for a specific country (France), may apply to other similar European countries. France is now experiencing fiscal imbalances that are comparable in intensity to those of many other developed countries nowa-days, notably in Europe. Whereas public debt, taxes and public spending are slightly higher in France compared to the European average, demographics is slightly more favorable. Overall, our results might also apply to other European countries having a fiscal situation comparable to France. Germany is obviously an exception since its public finances are broadly balanced nowadays.
• the specificities of the energy-mix in France, with the prominent role of nuclear in electricity generation, do not bias significantly our results. The role of nuclear in French electricity production is relatively large. It accounts for a share of electricity in the energy-mix slightly higher (23,5%) than the OECD average (21,9%). It shelters somewhat the economy against large variations of the prices of fossil fuels and lessens the average level of the production price of electricity. However, the difference remains small in absolute terms, and using other assumptions as for the electric-mix would not sizeably modify the main characteristics of the dynamics of the model.
4.3
Intergenerational redistributive effects of stopping an energy
transi-tion
4.3.1 Effects on future annual welfare of each cohort
The influence on economic growth of both reforms last several decades. Accordingly, they are bound to bring about intergenerational issues. The OLG framework of the model allows for studying them with precision.
A first detailed analysis of the cohorts loosing or gaining in different scenarios is possible using Lexis surfaces (Figure 5 and 6). A Lexis surface represents in 3 dimensions the level of a variable associated with a cohort of a given age at a given year. The variable considered here is the gain (or loss) of current welfare of a cohort aged a in a given year t and in a given reform scenario, compared to its current welfare in the baseline scenario.38 Current welfare refers here to the instantaneous
utility function of a private agent in the model.
Before the announcement of a reform package in 2010, annual current welfare of one cohort is by assumption equal in all scenarios. Graphically, this involves a flat portion in the Lexis surface, at value 0. From 2010 onwards, the deformations of the Lexis surfaces mirror the influence of mechanisms of intergenerational redistribution as measured by their influence on current welfare.
3 8Baseline scenario is scenario 1 if world energy prices are high, or scenario 5 if they are relatively low in the next