HAL Id: hal-02329970
https://hal.archives-ouvertes.fr/hal-02329970
Submitted on 23 Oct 2019
HAL is a multi-disciplinary open access
archive for the deposit and dissemination of
sci-entific research documents, whether they are
pub-lished or not. The documents may come from
teaching and research institutions in France or
abroad, or from public or private research centers.
L’archive ouverte pluridisciplinaire HAL, est
destinée au dépôt et à la diffusion de documents
scientifiques de niveau recherche, publiés ou non,
émanant des établissements d’enseignement et de
recherche français ou étrangers, des laboratoires
publics ou privés.
Association of the CpG Methylation Pattern of the
Proximal Insulin Gene Promoter with Type 1 Diabetes
Delphine Fradin, Sophie Le Fur, Clémence Mille, Nadia Naoui, Chris Groves,
Diana Zelenika, Mark Mccarthy, Mark Lathrop, Pierre Bougnères
To cite this version:
Delphine Fradin, Sophie Le Fur, Clémence Mille, Nadia Naoui, Chris Groves, et al.. Association of the
CpG Methylation Pattern of the Proximal Insulin Gene Promoter with Type 1 Diabetes. PLoS ONE,
Public Library of Science, 2012, 7 (5), pp.e36278. �10.1371/journal.pone.0036278�. �hal-02329970�
Proximal Insulin Gene Promoter with Type 1 Diabetes
Delphine Fradin1, Sophie Le Fur1,2, Cle´mence Mille1,2, Nadia Naoui1,2, Chris Groves4, Diana Zelenika3, Mark I. McCarthy4, Mark Lathrop3, Pierre Bougne`res1,2*
1 Institut National de la Sante´ et de la Recherche Me´dicale U986 and Department of Pediatric Endocrinology, Biceˆtre Hospital, Paris Sud University, Paris, France, 2 ISIS-DIAB Cohort, Biceˆtre and Saint Vincent de Paul Hospital, Paris, France,3 Centre National de Ge´notypage, Evry, France, 4 Oxford Centre for Diabetes, Endocrinology and Metabolism, Churchill Hospital, Headington, Oxford, United Kingdom
Abstract
The insulin (INS) region is the second most important locus associated with Type 1 Diabetes (T1D). The study of the DNA methylation pattern of the 7 CpGs proximal to the TSS in the INS gene promoter revealed that T1D patients have a lower level of methylation of CpG -19, -135 and -234 (p = 2.10216) and a higher methylation of CpG -180 than controls, while methylation was comparable for CpG -69, -102, -206. The magnitude of the hypomethylation relative to a control population was 8–15% of the corresponding levels in controls and was correlated in CpGs 19 and 135 (r = 0.77) and CpG -135 and -234 (r = 0.65). 70/485 (14%) of T1D patients had a simultaneous decrease in methylation of CpG -19, --135, -234 versus none in 317 controls. CpG methylation did not correlate with glycated hemoglobin or with T1D duration. The methylation of CpG -69, -102, -180, -206, but not CpG -19, -135, -234 was strongly influenced by the cis-genotype at rs689, a SNP known to show a strong association with T1D. We hypothesize that part of this genetic association could in fact be mediated at the statistical and functional level by the underlying changes in neighboring CpG methylation. Our observation of a CpG-specific, locus-specific methylation pattern, although it can provide an epigenetic biomarker of a multifactorial disease, does not indicate whether the reported epigenetic pattern preexists or follows the establishment of T1D. To explore the effect of chronic hyperglycemia on CpG methylation, we studied non obese patients with type 2 diabetes (T2D) who were found to have decreased CpG-19 methylation versus age-matched controls, similar to T1D (p = 2.1026) but increased CpG-234 methylation (p = 5.1028), the opposite of T1D. The causality and natural history of the different
epigenetic changes associated with T1D or T2D remain to be determined.
Citation: Fradin D, Le Fur S, Mille C, Naoui N, Groves C, et al. (2012) Association of the CpG Methylation Pattern of the Proximal Insulin Gene Promoter with Type 1 Diabetes. PLoS ONE 7(5): e36278. doi:10.1371/journal.pone.0036278
Editor: Francis C. Lynn, University of British Columbia, Canada
Received November 25, 2011; Accepted March 29, 2012; Published May 2, 2012
Copyright: ß 2012 Fradin et al. This is an open-access article distributed under the terms of the Creative Commons Attribution License, which permits unrestricted use, distribution, and reproduction in any medium, provided the original author and source are credited.
Funding: The authors acknowledge the support of ‘‘Alliance Diabe`te de Type 1 NovoNordisk-INSERM,’’ Centre National de Ge´notypage (Evry), Association pour la Recherche sur le Diabe`te, and Programme Hospitalier de Recherche Clinique. The funders had no role in study design, data collection and analysis, decision to publish, or preparation of the manuscript.
Competing Interests: The study was partly funded by NovoNordisk. There are no patents, products in development or marketed products to declare. This does not alter the authors’ adherence to all the PLoS ONE policies on sharing data and materials, as detailed online in the guide for authors.
* E-mail: pierre.bougneres@inserm.fr
Introduction
Type 1 diabetes (T1D) results from the autoimmune destruction of insulin-producing beta-cells caused by yet unknown environ-mental factors in genetically predisposed individuals. While the complexity of T1D causality is yet to be unraveled at the biological and epidemiological levels [1], epigenetics can be suspected to contribute to T1D causality as a reflect of environment-gene interactions.
The current study focuses on the insulin (INS) locus. The genetic polymorphism of DNA sequence at the INS locus has been associated with T1D as the first application of the TDT (Transmission Disequilibrium Test) approach to multifactorial disease genetics [2]. Since then, it has been consistently confirmed that T1D is associated [3,4,5,6] with the A/T SNP called rs689 and located at position +215 bp of the INS gene TSS. The MHC locus being IDDM1, the INS locus was named IDDM2, because it has the second highest odds ratio (OR) for T1D risk [7]. In Caucasians, rs689 is in complete linkage disequilibrium (LD) with the VNTR classes, allele A being associated with short class I
VNTR alleles, more frequent in T1D, while allele T is associated with long class III alleles. Studies of INS gene expression suggested that while given class I alleles are associated with increased INS expression in a rodent ß cell line [8] and human pancreas [9] versus class III alleles, the opposite observation was obtained in whole thymic tissue [9,10]. Since rs689 did not seem to have per se a functional role in the regulation of INS gene transcription, it was proposed that sequence variation at the INS locus could affect INS gene transcription through a tissue-specific functional difference between VNTR classes. Possibly, epigenetic variation at the INS locus could provide an interface between the predisposing rs689 SNP and variation in INS gene transcription. This is because in mammals including humans, the DNA methylation of gene promoter regions is known to play a role in the transcriptional regulation of many genes, most often in a tissue specific manner [11]. This was shown specifically for the INS locus where CpG methylation of the promoter was able to modify gene expression in b cell lines and islets of T2D patients [12,13]. The variation of DNA methylation within the INS gene promoter, a low-CpG containing region, may thus be suspected to regulate INS gene
transcription in pancreatic ß cells and medullary thymic epithelial cells (mTEC), the two tissues that express this gene and are central to the mechanisms of T1D [14]. Since these tissues cannot be studied in T1D patients, we undertook the study of DNA methylation at the INS locus in whole blood cells (WBC) as a possible surrogate of epigenetic marks in INS expressing tissues [15].
To explore if chronic hyperglycemia could be suspected to cause the observed changes in the methylation pattern of the INS promoter, we studied a group of T2D patients compared with age-matched controls.
Results
Using a bisulfite-PCR method [16], we measured DNA methylation of 7 CpGs located in the proximal part of the INS promoter in 485 T1D patients compared with 317 age-matched non diabetic individuals (Table 1).
Association of CpG methylation at the INS locus with T1D
The CpG methylation pattern of the proximal part of the INS gene promoter showed distinctive characteristics in the T1D patients. First, there was no T1D-related global directional change in methylation level that would affect all CpGs equally, nor did neighbouring CpGs adopt systematically the same changes in methylation. Compared with controls, CpGs -19, 2135 and 2234 in T1D patients showed a decrease in methylation (ranging from 210 to 216% of the mean, p,2.10216), while methylation of other CpGs was either unchanged (CpGs -69, 2102, 2206) or slightly increased (CpG -180, +3% of the mean, p = 1.1026) (Table 2, Figure 1). Defining relative hypomethylation of a given CpG as a value below 22SD of the corresponding control level, we found that 70/485 (14%) T1D patients had a simultaneous hypomethylation of CpG -19, -135 and -234, while 0/317 controls showed such triple hypomethylation (p,2.10216). Methylation levels of the four T1D-associated CpGs, although not in immediate vicinity on the DNA phase, were closely correlated (0.40,r,0.77, p,2.10216, Figure 2), suggesting a shared process of regulation of the methylation status of these CpG residues, that is also seen in controls. Methylation levels of other CpGs showed a weaker degree of correlation between them as well as with the T1D associated CpGs (Figure 2).
Age-dependency and stability of DNA methylation in T1D patients
We found no correlation of methylation with T1D duration. We did not find either any trend of correlation with glycated haemoglobin (HbA1c), which reflects the degree of hyperglycemia to which patients WBC are chronically exposed (data not shown). We detected only a small trend of correlation of CpG -180 methylation with age (Figure 3). This may be due to the studied range of ages, which extends only from 1 to 30 years, but we know from analyses in older adult non diabetic subjects of another cohorts that there is a downward age-dependent trend of methylation for all CpGs located in INS promoter (Figure S1). T1D patients who were studied twice at 1 month to 5 years intervals, had consistent methylation values at all CpGs. Again, none of the studied CpGs showed any correlation with intra-individual changes in glycated hemoglobin values (Data not shown).
Influence of rs689 genotype upon CG methylation at the INS locus
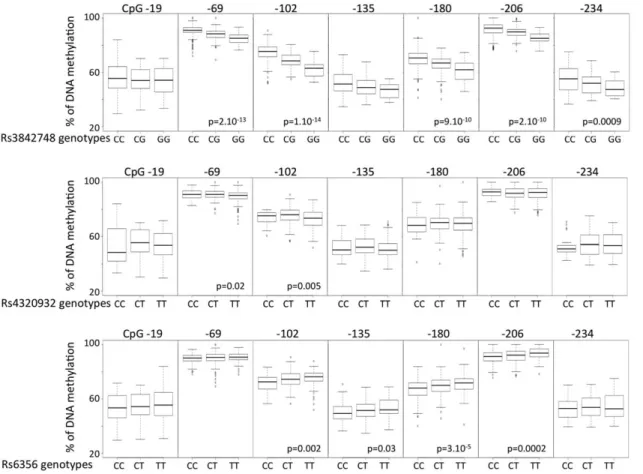
We found a strong and consistent correlation between the methylation status of 4/7 CpGs and the rs689 genotype (Figures 4 and 5), indicating that the T1D-predisposing A allele is consistently associated with higher methylation levels of CpGs -69, -102, -180, -206 (Figure 5). Note that CpG -180 hypermethy-lation is associated with T1D. Not all rs689 neighboring CpGs showed a dependency on this SNP, since rs689 had very little influence on methylation values of CpGs -19, 2135, 2234, the three other CpGs whose hypomethylation was found to be strongly associated with T1D. A comparable genotype-epigen-otype relationship was also observed for rs3842748, a SNP in high linkage disequilibrium with VNTR classes as rs689, but almost disappeared for the more distant SNPs rs4320932 and rs6356 located on either side of the INS locus (Figures 4 and 6). The distribution of genotypes was not different in the patients having a decreased methylation of the 3 CpG -19, -135, -234.
Association of CpG methylation at the INS locus with T2D
Compared with age-matched controls, T2D patients showed a decrease in methylation at CpG -19, and an increase at CpG -234, while methylation of other CpGs showed no or marginal (CpG-102) changes (Table 3). There was no correlation between CpG-19 and CpG-234 changes in the T2D patients. Neither CpG-19 decrease nor CpG-234 increase in methylation were related to T2D duration. None of the T2D patients showed a simultaneous hypomethylation at CpG -19, -135, and -234, the distinctive pattern observed in T1D patients.
Discussion
The current study investigated the DNA methylation pattern of the INS promoter because the common genetic variation at rs689 is known to be strongly associated to T1D, and because no clear functional role could be attributed to this SNP [2,3,4,5,6]. Among the 7 CpGs located within the proximal INS promoter, we found consistent methylation differences between T1D patients and non-diabetic controls at 4/7 CpGs. These 4 CpGs were located 219, 2135, 2180 and 2234 bp from the TSS. Methylation at the other 3 neighboring CpGs showed no difference between T1D patients and age-matched controls. The small magnitude of the differences observed at CpGs -19, -135, -180, -234 is consistent with those reported recently by Rakyan et al in T1D twins studied with a methylation array [17]. By combining the changes in methylation at CpG -19, -135, and -234, it becomes possible to Table 1. Main characteristics of T1D patients and
age-matched non diabetic controls.
T1D Patients T1D Controls
N 485 317
Sex (M/F) 259/226 163/153 Current age (yrs) 12.164.9 11.864.8 BMI (kg/m2
) 18.463.2 23.3610.6 Age at clinical onset (yrs) 6.363.1 -Diabetes Duration 7.568.5 -Hba1c 8.161.4 -Results are expressed as mean 6 sd.
doi:10.1371/journal.pone.0036278.t001
define a 3-CpG-hypomethylation pattern that seems to be present only in T1D patients, thus could be specific and predictive of T1D, if confirmed by follow-up studies. This 3-CpG pattern is present in only 14% of T1D patients, thus is not sensitive as a biomarker.
We found surprising that T1D was associated with a gain of methylation in one CpG (2180) and with a loss of methylation in 3 others, and we have no explanation for this observation. From a general point of view, changes in DNA methylation, whether it is an increase or a decrease for cis-located CpGs, may be related to
precisely located changes in the histone code and chromatin structure, since there are well established interactions between these epigenetic processes and DNA methylation [18]. If they occur commonly, such discrepancies between neighboring CpG of a given locus could be misleading in whole-methylome studies since the methylation of the CpG used to tag the locus may not reflect the methylation of other CpGs located at other positions over the whole locus
Table 2. CpG methylation in the INS promoter in T1D patients and controls.
T1D Patients (N = 485) CONTROLS (N = 317) T1D Patients (n = 485) CONTROLS (n = 317)
DNA methylation (%) p Hypomethylated subjects N (%) p CpG -19 54610 6466 ,2.10-16 190 (39%) 12 (4%) ,2.10216 CpG -69 9064 8966 0.65 CpG -102 7366 7369 0.11 CpG -135 5269 6865 ,2.10216 273 (56%) 12 (4%) ,2.10216 CpG -180 6967 66611 1.1026 CpG -206 9165 9167 0.62 CpG -234 5469 6266 ,2.10216 178 (37%) 8 (2%) ,2.10216 CpGs -19, -135, -180 5369 6466 ,2.10216 70 (14%) 0 ,2.10216
Results are expressed as mean 6 sd. P-values are calculated by Wilcoxon rank sum test. Hypomethylated subject of a given CpG is defined by a methylation value below -2SD of the corresponding control level. We have only shown, for clarity, the hypomethylated subjects in the right part of the table. In contrast, note that methylation of CpG -180 is increased in T1D patients.
doi:10.1371/journal.pone.0036278.t002
Figure 1. Heatmap analysis of the relationship between DNA methylation of the whole proximalINSpromoter and disease status. Each row represents one individual.
Another question encountered by epigenetic epidemiology is whether the observed methylation changes pre-exist or follow the establishment of the disease state. Since this cannot be inferred from the current data, interpretation of the T1D associated changes in DNA methylation should remain open to both hypotheses. We are however encouraged to postulate that the observed epigenetic pattern may contribute to T1D predisposition or autoimmune mechanisms by the recent pioneering study of Rakyan et al., who identified 132 T1D–associated methylation variable positions in 15 T1D discordant MZ twin pairs [17]. This latter approach did not detect the epigenetic pattern that we found associated with T1D at the INS locus. This apparent discordance can be explained by the methods used by these authors. A difference is the greater statistical power of our case-control approach compared to their twin study. While we used a promoter-centered multi-CpG-per candidate region (7 CpGs
within 250 bp) approach, Rakyan et al. used a genome wide one-CpG-per region approach. A following consequence of our observation for the epigenetic epidemiology of T1D, but more generally for the interpretation of epigenetic studies in multifac-torial diseases, is that one CpG may not recapitulate the overall methylation changes in a given genomic region. This may explain why Rakyan et al. also using the CpG -180 as a unique marker of the proximal promoter region have not observed a significant association of this locus with T1D in the studied 15 twin pairs. When methylation arrays bearing for example 27,000 CpGs selected as markers among 28 millions CpGs on the human genome, are used for methylome-wide approaches, these arrays cannot encompass all CpGs of a given region. The high density DNA methylation arrays (Infinium HumanMethylation450 [19] and CHARM arrays [20]) and sequencing based technology, should improve the coverage of the methylome. However, as shown here, CpG residues in a given region may show variable degrees of association between their level of methylation and the disease, ranging from hypo- to hyper-methylation, and from nonsignificant to highly significant levels of statistical association. Thus it may be the heterogeneity of a methylation pattern that turns out to be characteristic of a disease. To further explore if exposure to chronic hyperglycemia could have resulted in the observed changes of CpG methylation, rather than the T1D disease itself, we studied a sample of non-obese patients with T2D that had a somewhat comparable duration of exposure to hyperglycemia. Comparison with age-matched controls revealed that T2D patients share the hypomethylation of CpG-19 with T1D patients, which could reflect a common consequence of the hyperglycemic status. However T2D patients showed no consistent trend for hypomethylation of CpG -135 or -234, a good marker of T1D. Instead, the level of methylation was increased at CpG-135 (non significantly) and at CpG-234 (p = 5.1028). Again, the causality of such changes in T2D escapes the limits of the current report, and will be the matter of further investigation. Age differences could not explain the discordance between T1D and T2D patients. It is noteworthy that the two samples of controls also showed differences in their methylation patterns at the INS locus, as expected from an environmentally and age sensitive process. Further investigations in other groups of T1D, T2D patients, and age- and environmentally matched controls will be necessary to explain these differences.
The current observations raise unresolved questions regarding the functional meaning of the changes in the CpG methylation of
Figure 3. Lack of correlation between age andINSpromoter methylation in T1D patients (green) and Controls (red). Only CpG -180 methylation showed a slight downward trend with age (r = 0.09, p = 0.01). The figure also shows the distribution of individual methylation values, and the differences between T1D and control subjects for CpGs -19, -135, -180, and -234.
doi:10.1371/journal.pone.0036278.g003
Figure 2. Correlation matrix of the methylation values (%) at theINSpromoter CpG sites in T1D patients (R in bold, p-value below). The T1D-associated hypomethylated CpGs -19, -135 and -234 are highly correlated (,10216).
doi:10.1371/journal.pone.0036278.g002
the INS promoter found in the WBC of patients with T1D. For methylated CpGs to contribute to T1D mechanisms, methylation changes modulating INS expression should have occurred in ß cells and/or mTEC, according to our current view of T1D autoim-mune pathogenesis. On the other side, if T1D pre-exist to the changes in methylation, such changes in CpG methylation may be caused by the metabolic perturbations related to the diabetic state. Since WBC are exposed to numerous changes in plasma composition in T1D patients, the DNA methylation at the INS locus could be affected through a dysregulation of the methylation machinery induced by T1D as an epigenetic signature of the diabetic state. If this is the case however, it would be difficult to understand the coexistence of increased and decreased CpG methylation associated with T1D at different CpGs since one would then expect the metabolic dysregulation to affect CpG methylation in a consistent direction. Our T1D patients were studied an average of 7.5 years after clinical diagnosis, a time when ß cell destruction is expected to be largely terminated. Thus we do not think that our observations in WBC interfere with those of Akirav et al., who found an increased proportion of demethylated
DNA in the serum of 5 patients with recent-onset T1D, as a possible index of active ß cell death [21].
We found that CpG methylation was influenced by the rs689 alleles known to be in strong LD with VNTR classes in Europeans [22]. Genotype dependent variations of neighboring epigenotype have been reported for the FTO locus in WBC [23] and for several other loci across the genome (genome research) and called ASM (Allele Specific DNA Methylation, see review [24]). Shoemaker et al. observed ASM on 23% to 37% heterozygous SNPs in several cell lines [25] while Zhang et al. evaluated that ASM is likely to affect 10% of all human genes [26]. The finding of a link between genetic variants and epigenomic marks in T1D patients at the INS locus may provide a more general example of how genetic and epigenetic variation can be related. This may help our future understanding of the ‘‘missing heritability’’ enigma seen with many genome wide association studies of multifactorial traits or diseases, if it proves true that SNPs are only the markers that tag neighboring epigenomic variations. According to this view, certain SNPs showing strong statistical association with complex diseases may not have any functional effects per se, but
Figure 4. UCSC Genome Browser map of theINSlocus : localization of genes, CpG islands (CGI), variants and CpG sites. Genes are represented by blue boxes (exons) and lines (intron). Under genes, CGI are in green. Green intensity and size of the box is function of the size and the number of CpG included in CGI. Polymorphisms are represented by black boxes, under CGI. Below, a zoom of the INS promoter allowing the localization and representation of the isolated CpG sites, according to the TSS, represented by the red arrow.
doi:10.1371/journal.pone.0036278.g004
Figure 5. Boxplot of methylation values of the studied CpGs in the INSpromoter with respect to the rs689 genotype in T1D patients. Except for the CpG -180, the T1D-associated CpGs show no direct association with the genotype. P-values are calculated by Kruskal-Wallis test.
may be associated with epitypes that have functional effects on gene expression.
The CpG -180 is the only one that is both associated to T1D and is influenced by the T1D-associated SNP rs689. The hypermethylation of this CpG methylation has a marked influence on INS gene transcription in vitro [12]. Indeed, Kuroda et al.
showed that methylation of the CpG -180, located in a cAMP responsive element (CRE), suppressed INS promoter-driven reporter gene activity by 50%. In human pancreatic islets, Yang et al. also found that insulin mRNA expression correlated negatively with the degree of methylation of CpG -180 [13]. If such in vitro observations were to be true in the mTEC of T1D patients, this would support that CpG -180 has a functional contribution to the predisposing effect of rs689, a hypothesis consistent with the increased methylation of this CpG in T1D individuals carrying the A allele.
Decreased INS gene expression in the thymus of T1D patients has been suspected to drive the defect of tolerance leading to autoimmunity towards ß cells [9,10].
Whether epigenetic changes pre-exist or are a consequence of T1D can only be established by long-term longitudinal studies of DNA methylation in subjects at risk for the disease. Since it will a priori remain almost impossible to investigate ß cells and mTEC in T1D patients, the question of tissue-specific methylation changes should have to be solved in animal models of T1D, like the NOD mouse. It is possible that the observed pattern of CpG methylation at the insulin locus may vary in other T1D and control populations as a reflect of gene-environment interactions proper to these populations. Until larger studies can be performed in such populations, the observed variations in DNA methylation should be considered restricted to the European people studied here.
Figure 6. Boxplot of methylation values for the 7 CpGs inINSpromoter with respect to SNPs other than rs689 in T1D patients. Methylation at CpGs -69, 2102, 2180 and 2206 are associated with rs3842748. More distant SNPs showed a much weaker correlation with methylation at CpG -69 and -102 for rs4320932 and with methylation at CpGs -102, -135, -180 and 2206 for rs6356. See Figure S1 for SNP locations. P-values are calculated by Krukal-Wallis test.
doi:10.1371/journal.pone.0036278.g006
Table 3. CpG methylation in the INS promoter in T2D patients and controls.
T2D Patients (N = 132) T2D CONTROLS(N = 186) DNA methylation (%) p CpG -19 47611 54610 2.1026 CpG -69 88611 8866 0.22 CpG -102 68618 64613 0.01 CpG -135 58610 55610 0.06 CpG -180 57619 61611 0.14 CpG -206 91610 9367 0.79 CpG -234 5769 5166 5.1028
Results are expressed as mean 6 sd. P-values are calculated by Wilcoxon rank sum test.
doi:10.1371/journal.pone.0036278.t003
Materials and Methods Patients
Non-immortalized whole blood cell (WBC) samples were obtained from 520 participants randomly extracted from the Isis-Diab cohort (T1D cases) and from 317 controls. ISIS-Diab is an ongoing prospective cohort of T1D patients recruited by a French multicenter network composed of 77 diabetic centers (see list in Table S1) supported by the Programme Hospitalier de Recherche Clinique of the French Ministry of Health with the objective of studying gene-environment factors in young patients with T1D. To limit the risk of population stratification, all recruited patients are of Caucasian ancestry assessed by family history and grandparents’ birthplace. Inclusion criteria are diabetes mellitus criteria, signs of insulin dependency, immediate insulin treatment and presence of GAD autoantibodies in serum. For the current study, we selected 317 Caucasian non diabetic controls to be sex and age-matched with the T1D cases.
A sample of 132 non obese T2D patients aged less than 65 years, studied , 7 yrs after T2D diagnosis, as well as 186 age- and BMI-matched controls, was obtained from UK to allow a comparison with the young T1D patients analyzed in the current study (Table S2).
Patients and controls were included in the study according to the French bioethics law with families being carefully informed and having signed a detailed informed consent agreed by CPP (number DC-2008-693; NI 2620, Comite´ de Protection des Personnes).
Isolation of genomic DNA and bisulfite genomic conversion
Nucleic acids were extracted from WBC using the same phenol chloroform technique in French T1D and controls and using the same Promega DNA extraction kit in T2D patients and controls from UK. Genomic DNA was treated with EZ-96 DNA Methylation-Gold Kit, according to manufacturer’s protocol (Zymo Research Corporation).
Pyrosequencing
We PCR-amplified the bisulfite treated genomic DNA using unbiased nested primers (sequences on request) and performed quantitative pyrosequencing. Pyrosequencing was performed using a PyroMark Q96 ID Pyrosequencing instrument (Qiagen). Pyrosequencing assays were designed using MethPrimer (http:// www.urogene.org/methprimer/index1.html). 200 ng of genomic DNA was treated with EZ DNA Methylation-Gold Kit, according manufacturer’s protocol (Zymo Research Corporation) and amplified. Biotin-labeled single stranded amplicons were isolated according to protocol using the Qiagen Pyromark Q96 Work Station and underwent pyrosequencing with 0.5mM primer. The percent methylation for each of the CpGs within the target sequence was calculated using PyroQ cpG Software (Qiagen).
Genotyping
Genotypes were obtained from GWAS data (Illumina Human-Hap300_(v1.0.0), HumanHap300v2_A, HumanCNV370v1_C, Human610-Quadv1_B). GWAS was conducted by the Centre National de Genotypage (CNG, Evry, France).
Statistical analysis
Differences in DNA methylation of the insulin promoter between T1D or T2D patients and non-diabetic controls were analyzed using non-parametric Wilcoxon rank sum test. Correla-tions were calculated as adjusted R square that measures the proportion of the variation in the dependent variable accounted for by the explanatory variables. Methylation data were clustered using the heatmap.2 function of the R statistical computing environment. Differences in DNA methylation of the INS promoter according genotypes were analyzed using non-paramet-ric Kruskal-Wallis test. Methylation analyses adjusted for age were conducted using logistic regression. Results are expressed as mean 6 sd. ‘‘Relative hypomethylation’’ was defined as values of CpG methylation under -2SD of the distribution of values in age-matched controls of the same population of origin.
By default, the smallest p-value obtained by R is ,2.10216. All statistical analysis were conducted using R 2.10.1.
Supporting Information
Figure S1 Correlation between age and INS promoter methylation in two populations of controls, the young controls used in the current T1D study (red) and a cohort of older controls (black).
(TIF)
Table S1 List of the 77 diabetic centers by alphabetic order participating to the ISIS-DIAB network.
(DOCX)
Table S2 Main characteristics of T1D patients and age-matched non diabetic controls. Results are expressed as mean ± sd.
(DOCX)
Acknowledgments
We acknowledge the support of the Centre National de Ge´notypage (Evry). We thank P. Lucchini, B. Aboumrad, C. Hain, and C. Bibal and all the pediatricians of the ISIS network, without whom this study could not have been performed (complete list in Supplement), and A.J. Valleron for co-founding the ISIS study.
Author Contributions
Conceived and designed the experiments: DF PB. Performed the experiments: CM NN DF. Analyzed the data: DF PB. Contributed reagents/materials/analysis tools: SLF DZ ML CG MIMC. Wrote the paper: DF PB MIMC.
References
1. Bougneres P, Valleron AJ (2008) Causes of early-onset type 1 diabetes: toward data-driven environmental approaches. J Exp Med 205: 2953–2957. 2. Cox NJ, Epstein PA, Spielman RS (1989) Linkage studies on NIDDM and the
insulin and insulin-receptor genes. Diabetes 38: 653–658.
3. Barrett JC, Clayton DG, Concannon P, Akolkar B, Cooper JD, et al. (2009) Genome-wide association study and meta-analysis find that over 40 loci affect risk of type 1 diabetes. Nat Genet 41: 703–707.
4. Hakonarson H, Grant SF, Bradfield JP, Marchand L, Kim CE, et al. (2007) A genome-wide association study identifies KIAA0350 as a type 1 diabetes gene. Nature 448: 591–594.
5. Plagnol V, Howson JM, Smyth DJ, Walker N, Hafler JP, et al. (2011) Genome-wide association analysis of autoantibody positivity in type 1 diabetes cases. PLoS Genet 7: e1002216.
6. Todd JA, Walker NM, Cooper JD, Smyth DJ, Downes K, et al. (2007) Robust associations of four new chromosome regions from genome-wide analyses of type 1 diabetes. Nat Genet 39: 857–864.
7. Concannon P, Erlich HA, Julier C, Morahan G, Nerup J, et al. (2005) Type 1 diabetes: evidence for susceptibility loci from four genome-wide linkage scans in 1,435 multiplex families. Diabetes 54: 2995–3001.
8. Lucassen AM, Screaton GR, Julier C, Elliott TJ, Lathrop M, et al. (1995) Regulation of insulin gene expression by the IDDM associated, insulin locus haplotype. Hum Mol Genet 4: 501–506.
9. Vafiadis P, Bennett ST, Todd JA, Nadeau J, Grabs R, et al. (1997) Insulin expression in human thymus is modulated by INS VNTR alleles at the IDDM2 locus. Nat Genet 15: 289–292.
10. Pugliese A, Zeller M, Fernandez A, Jr., Zalcberg LJ, Bartlett RJ, et al. (1997) The insulin gene is transcribed in the human thymus and transcription levels correlated with allelic variation at the INS VNTR-IDDM2 susceptibility locus for type 1 diabetes. Nat Genet 15: 293–297.
11. Eckhardt F, Lewin J, Cortese R, Rakyan VK, Attwood J, et al. (2006) DNA methylation profiling of human chromosomes 6, 20 and 22. Nat Genet 38: 1378–1385.
12. Kuroda A, Rauch TA, Todorov I, Ku HT, Al-Abdullah IH, et al. (2009) Insulin gene expression is regulated by DNA methylation. PLoS One 4: e6953. 13. Yang BT, Dayeh TA, Kirkpatrick CL, Taneera J, Kumar R, et al. (2010) Insulin
promoter DNA methylation correlates negatively with insulin gene expression and positively with HbA(1c) levels in human pancreatic islets. Diabetologia. 14. Todd JA (2010) Etiology of type 1 diabetes. Immunity 32: 457–467. 15. Cui H, Cruz-Correa M, Giardiello FM, Hutcheon DF, Kafonek DR, et al.
(2003) Loss of IGF2 imprinting: a potential marker of colorectal cancer risk. Science 299: 1753–1755.
16. Tost J, Gut IG (2007) DNA methylation analysis by pyrosequencing. Nat Protoc 2: 2265–2275.
17. Rakyan VK, Beyan H, Down TA, Hawa M, Maslau S, et al. (2011) Identification of Type 1 Diabetes-Associated DNA Methylation Variable Positions That Precede Disease Diagnosis. PLoS Genet 7: e1002300.
18. Cedar H, Bergman Y (2009) Linking DNA methylation and histone modification: patterns and paradigms. Nat Rev Genet 10: 295–304. 19. Bibikova M, Barnes B, Tsan C, Ho V, Klotzle B, et al. (2011) High density DNA
methylation array with single CpG site resolution. Genomics 98: 288–295. 20. Irizarry RA, Ladd-Acosta C, Carvalho B, Wu H, Brandenburg SA, et al. (2008)
Comprehensive high-throughput arrays for relative methylation (CHARM). Genome Res 18: 780–790.
21. Akirav EM, Lebastchi J, Galvan EM, Henegariu O, Akirav M, et al. (2011) Detection of beta cell death in diabetes using differentially methylated circulating DNA. Proc Natl Acad Sci U S A 108: 19018–19023.
22. Bennett ST, Todd JA (1996) Human type 1 diabetes and the insulin gene: principles of mapping polygenes. Annu Rev Genet 30: 343–370.
23. Bell CG, Finer S, Lindgren CM, Wilson GA, Rakyan VK, et al. (2010) Integrated genetic and epigenetic analysis identifies haplotype-specific methyl-ation in the FTO type 2 diabetes and obesity susceptibility locus. PLoS One 5: e14040.
24. Meaburn EL, Schalkwyk LC, Mill J (2010) Allele-specific methylation in the human genome Implications for genetic studies of complex disease. Epigenetics 5.
25. Shoemaker R, Deng J, Wang W, Zhang K (2010) Allele-specific methylation is prevalent and is contributed by CpG-SNPs in the human genome. Genome Res 20: 883–889.
26. Zhang Y, Rohde C, Reinhardt R, Voelcker-Rehage C, Jeltsch A (2009) Non-imprinted allele-specific DNA methylation on human autosomes. Genome Biol 10: R138.