Properties of galaxy groups in the Sloan Digital Sky Survey — I. The dependence of colour, star formation and morphology on halo mass
27
0
0
Texte intégral
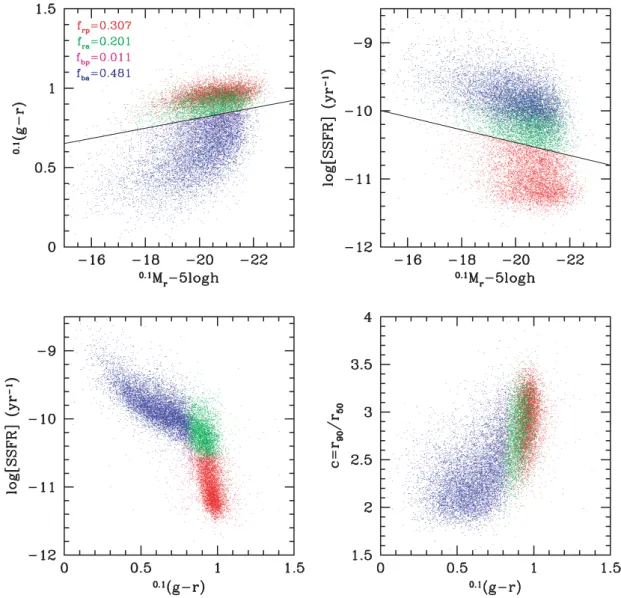
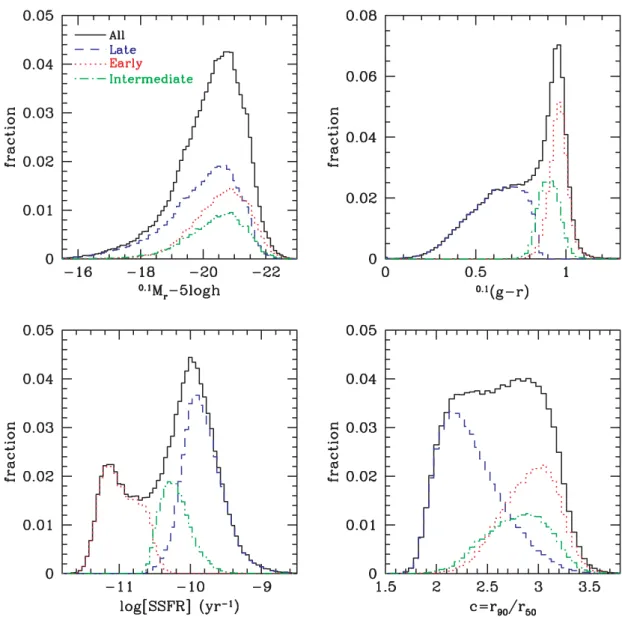
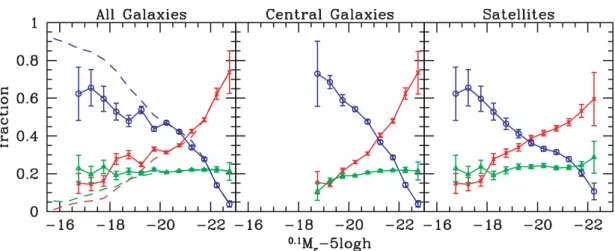
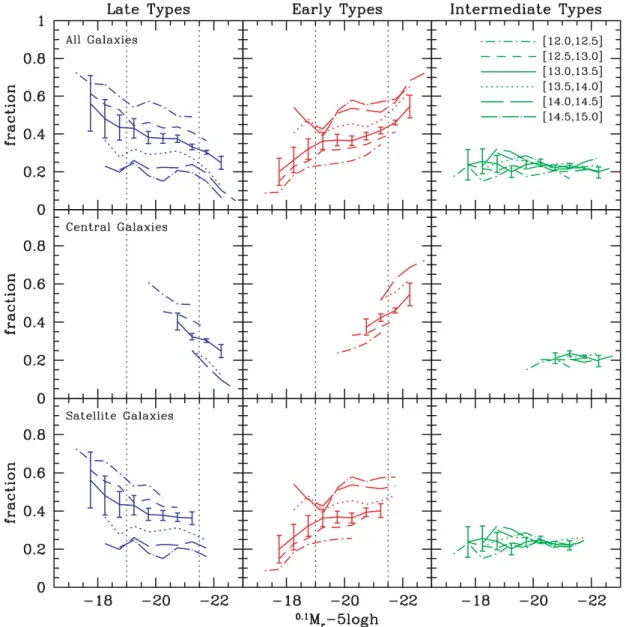
Figure
+7
Documents relatifs
