European Journal of Orthodontics 3 (1981) 205-222 © 1981 European Orthodontic Society
0141-5387/81 /00800205S02.00
Effects of activator treatment — evidence for
the occurrence of two different types of
reaction
H. U. Luder
Department of Orthodontics. University of Zurich, Switzerland.
Summary. A longitudinal cephalometric study was made of 12 boys and 13 girls with Class 11, Division 1 malocclusion treated with activators. The findings were compared with an untreated control group of 24 boys and 15 girls. The children were aged about 9 years at the start of the investigation and they were treated, or observed, for about two years.
Possible alterations of mandibular condylar growth were investigated and the results were compared with previously published hypotheses on the mode of action of the activator.
Since there were significant differences in the growth increments of control boys and control girls, the sexes were treated statistically as separate groups. Mandibular growth was found to be altered by activator therapy; in the boys growth was increased and redirected posteriorly while in the girls growth was only redirected. The maxilla and the dental arches were differently affected by the treatment. The differences in the observed results are probably explained by variation in the amount of vertical activation of the appliance but the possibility that boys and girls generally react differently could not be excluded.
It is also possible that at least some of the differences were due to special growth patterns associated with certain features in the initial cephalometric pattern. There was no indication that modes of appliance action led to the different reactions. The results as a whole support the concept of the activator as an appliance which transduces elastic soft tissue forces to the skeletal and dental units.
Introduction
The effects of the activator (Andresen and Haupl, 1936) have been widely investigated, both cephalometrically and histologicaily. Change in molar relationship is generally considered to result from effects on the maxillary skeletal complex and the upper and lower dentition; whether there is skeletal adaptation in the condyles is still undecided. Whereas most cephalometric studies in humans (Jakobsson, 1967; Trayfoot and Richardson, 1968; Harvold and Vargervik, 1971; Dietrich, 1973; Woodside et al., 1975;
Wieslander and Lagerstrom, 1979) indicate that mandibular growth is not altered by the activator, histological evidence (Stockli and Willert, 1971) and cephalometric evidence (McNamara, 1972) seem to indicate that it can be stimulated in animals.
All but one of the clinical studies cited above, in which there is no evidence of altered condylar growth, were based on measure-ments only of cephalometric angles of the bony profile. Treatment of Class II mal-occlusion with activators is very often Award Winning Essay. Read at the 56th Congress of the European Orthodontic Society, Paris, 1980.
206 EFFECTS OF ACTIVATOR TREATMENT
associated with a considerable opening of the bite, that is a downward and backward rotation of the mandible, and condylar growth effected by treatment could be 'neutralized' by this rotation and would not be measurable in the skeletal profile as an increased forward displacement of the bony chin. The significant increase in total mandibular length during activator treatment shown in studies by Marschner and Harris (1966) and Demisch (1973) could be due to a redirection rather than a stimulation of condylar growth.
The original theory of Andresen and Haupl on the mode of action of the activator was that the masticatory musculature adapts to the altered position of the mandible and exerts active forces, through the appliance, on the skeletal and dental structures. This view was supported by the results of an electro-myographic and cephalometric experiment in monkeys by McNamara (1972). In electro-myographic studies in humans, however, Ahlgren (1960) found no increased muscle activity: his evidence suggested that postural tonus might even decrease when the activator was being worn and he concluded that the elastic properties of the muscles, stretched by the insertion of the appliance, were responsible for the effects of the activator.
One could hypothesize that, as a con-sequence of full functional adaptation, the effects would be secondary and largely restricted to the vertical dimension in the maxilla and the upper and lower dentition, while in the mandibular condyle, they would be substantial and mainly sagittal because functional adaptation of the lateral pterygoid muscle would exert forces almost exclusively on the condyle. On the other hand, if the effects were due only to the elastic forces of the tissues they would be equally distributed on the upper and lower jaws and dental arches and would tend to rotate the upper and lower dentition, moving the maxilla and upper dentition distally and the mandible and the lower dentition anteriorly.
The aims of this study were to measure the effects of activator treatment on the growth and displacement of the maxilla and the mandible and also to check whether the
effects on the skeletal and dental structures confirmed one of the two hypotheses about the mode of action of the appliances.
Material and method
The effects of activator treatment were evaluated by comparing longitudinal cephalometric data derived from an experi-mental group of 25 children (12 boys and 13 girls) with those of a control group of 39 children (24 boys and 15 girls). The control group was selected so that the ages at the beginning of the investigation and the observation period between the two con-secutive cephalograms were similar to those of the experiment subjects.
None of the controls had orthodontic treatment or extraction of deciduous or permanent teeth. All the experimental group had Class II, Division 1 malocclusion and were treated exclusively with activators of the type described by Hotz (1961, 1970) with the bite opened about 2-3 mm from the rest position and the mandible protruded approxi-mately 3—4 mm. In cases with deep overbite and small interocclusal space in the rest position, however, the height of the appliance had to be increased to permit the appropriate forward displacement of the mandible.
Two lateral headfilms taken at the beginning and the end of the treatment or observation period were available for each individual. Tracings of the cephalograms were made using the landmarks and planes shown in Figs 1 and 2.
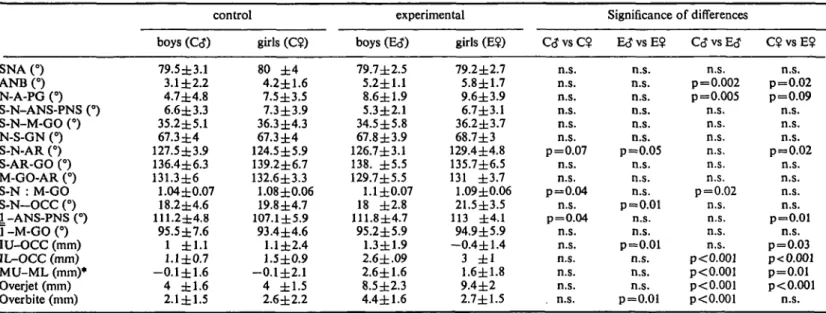
The cephalometric patterns of the experimental and control groups at the beginning of the treatment or observation period were assessed using the angles and linear dimensions shown in Table 2.
Growth changes were recorded by superimposition on structures known to be relatively stable. The amount of change was measured as the distance between the corre-sponding landmarks on the initial and final tracings. Directional changes were expressed as deviations from the polar co-ordinates of the landmarks on the initial cephalograms
EFFECTS OF ACTIVATOR TREATMENT 207
GO
Figure 1 Cephalometric reference points and planes used in this study: PM is located at the anterior border of the symphysis between points B and PG where the curvature changes from concave to convex; OCC, the functional occlusal plane, runs between the inter-occlusal contact areas of the first molars and the cuspids; IU: Incisal edge of the upper central incisor; MU: Distal contact point of the upper first molar; IL: Incisal edge of the lower central incisor; ML: Distal contact point of the lower first molar; DU and DL (not indicated) were the midpoints between IU and MU, and IL and ML, respectively; J^: Axis of the root of the upper central incisor; 7 : Axis of the root of the lower incisor. All other landmarks were used as defined by Salzmann (1966).
Fig. (2). For overall growth changes a clock-wise deviating rotation was recorded as negative and maxillary and mandibular growth changes as positive.
Fig. 2a shows the method of super-imposition for assessment of the overall changes. The growth co-ordinates of points ZM, CD, PM, N and BA were calculated, with S on the initial cephalogram as the centre of the co-ordinate system.
Rotational changes of the maxilla and mandible were established by calculating the differences between the initial and final
direction of the maxillary and mandibular planes. For this purpose, the two planes were transferred from the first to the second tracing using the local superimpositions described below.
Fig. 2b shows the method of super-imposition for assessment of maxillary changes. Growth co-ordinates of points PTM, IU, MU, and DU were calculated with ZM (the tip of the key ridge) as the centre of the co-ordinate system. Rotation of the functional occlusal plane was also measured.
Fig. 2c shows the method of super-imposition to assess mandibular changes. The growth co-ordinates of points CD, IL, ML, and DL were calculated with the co-ordinate system centred on PM. The rotation of the functional occlusal plane was also calculated.
Statistical Analysis
Mean and standard deviations of the angular and linear measurements and of the growth changes were calculated separately for boys and girls (Table 2).
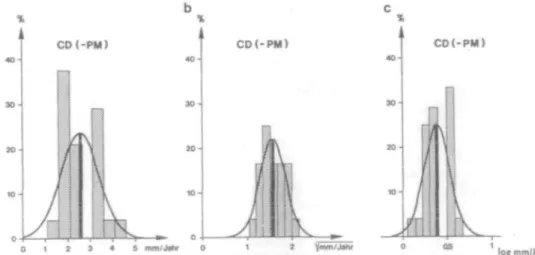
The distribution of the linear growth changes deviated considerably from the normal distribution. Histograms of the data were therefore constructed to find a trans-formation better fitting the normal distribu-tion and thus providing a better descripdistribu-tion of the samples (Fig. 3). This permitted calcu-lation of medians and 66% confidence intervals.
The significance of the differences between the samples of boys and girls, and of control and experimental subjects, was tested with the Wilcoxon rank test.
Growth co-ordinates which differed significantly between control and experi-mental groups were plotted in an average initial cephalometric tracing. The effects of treatment could then be constructed as vectorial differences between the experimental and the control co-ordinates.
To test whether differences in the initial cephalometric pattern could possibly account for the differences in the growth changes, Spearman rank correlations were made
208 EFFECTS OF ACTIVATOR TREATMENT
Figure 2 Method for the assessment of cephalometric growth changes:
a) overall changes: superimposition on the contours of the cribiform plate and the anterior wall of the Sella turcica;
b) maxillary changes: superimposition on the contours of the anterior border and the tip of the'key ridge';
c) mandibular changes: superimposition on PM on the symphysis, and the contours of the mandibular canal.
All growth changes were calculated as vectors, the directions of which were defined as deviations from the polar co-ordinate of the starting points. A positive value for the direction of growth indicates a counter-clockwise deviation in the overall changes and a clockwise deviation in the maxillary and mandibular changes.
CD(-PM) CD(-PM) CO(-PM)
log mm/Jahr Figure 3 Example of a histogram (growth at the mandibular condyle: CD) showing the distribution of a) the original, b) the V-transformed, and c) the log-transformed data for annual linear growth changes (nun).
EFFECTS OF ACTIVATOR TREATMENT 209
Table 1 Age in years at time of initial cephalogram (mean ± standard deviation), and interval in years between the two cephalograms (mean ± standard deviation).
Sample size (N) Initial age
Observation treatment period
control boys (C<J) 24 9.4 ± 1.1 2.2 ± 0.8 girls (C?) 15 8.9 ± 1.1 1.9 ± 0.6 experimental boys (E<?) 12 9 ± 1.4 2 ± 0 . 9 girls (E$) 13 8.2 ± 0.9 2.1 ± 1
between the questionable initial cephalometric measurements and the most interesting growth changes in the control group.
Results
The ages of the control and experimental groups and the observation period between
0
the two cephalograms were deliberately chosen to be similar (Table 1).
There was a significant difference in the initial cephalometric pattern of control boys and control girls and also of control and experimental subjects (Table 2). This applied to measurements describing sagittal inter-maxillary relation (ANB, N-A-PG), the
Figure 4 Average annual growth changes in the boys and 66% confidence intervals for their linear dimensions and directions in the control (solid lines and homogenously shaded areas) and experimental groups (dotted lines and dotted areas): a)overall, b) maxillary, and c) mandibular growth changes. For graphical illustration the lengths of the arrows were enlarged x 10.
Table 2 Means ± standard deviations of the initial cephalometric measurements and level of significance of the difference between the samples SNA (°) ANB(°) N-A-PG (°) S-N-ANS-PNS (°) S-N-M-GO (°) N-S-GN (°) S-N-AR (°) S-AR-GO (°) M-GO-AR (°) S-N : M-GO S-N-OCC (°) 1 -ANS-PNS (°) T-M-GOO IU-OCC (mm) IL-OCC (mm) MU-ML (mm)* Overjet (mm) Overbite (mm) control boys (C<J) 79.5±3.1 3.1 ±2.2 4.7±4.8 6.6±3.3 35.2±5.1 67.3 ± 4 127.5±3.9 136.4±6.3 131.3±6 1.04 ±0.07 18.2±4.6 111.2±4.8 95.5±7.6 1 ±1.1 l.l±0.7 -0.1±1.6 4 ±1.6 2.1±1.5 girls (C<?) 80 ± 4 4.2±1.6 7.5±3.5 7.3±3.9 36.3±4.3 67.3±4 124.5±5.9 139.2±6.7 132.6±3.3 1.08 ±0.06 19.8±4.7 107.1 ±5.9 93.4 ±4.6 1.1±2.4 1.5±0.9 -0.1±2.1 4 ±1.5 2.6±2.2 experimental boys (E<J) 79.7±2.5 5.2±1.1 8.6±1.9 5.3±2.1 34.5±5.8 67.8±3.9 126.7±3.1 138. ±5.5 129.7±5.5 1.1 ±0.07 18 ±2.8 111.8±4.7 95.2±5.9 1.3±1.9 2.6 ±.09 2.6±1.6 8.5±2.3 4.4±1.6 girls (E?) 79.2±2.7 5.8±1.7 9.6±3.9 6.7±3.1 36.2±3.7 68.7±3 129.4±4.8 135.7±6.5 131 ±3.7 1.09±0.06 21.5±3.5 113 ±4.1 94.9±5.9 -0.4±1.4 3 ± 1 1.6±1.8 9.4±2 2.7±1.5 C<J vs C? n.s. n.s. n.s. n.s. n.s. n.s. p=0.07 n.s. n.s. p=0.04 n.s. p=0.04 n.s. n.s. n.s. n.s. n.s. . n.s. Significance EcJvsE? n.s. n.s. n.s. n.s. n.s. n.s. p=0.05 n.s. n.s. n.s. p=0.01 n.s. n.s. p=0.01 n.s. n.s. n.s. p=0.01 of differences C<J vs Erf n.s. p = 0.002 p=0.005 n.s. n.s. n.s. n.s. n.s. n.s. p=0.02 n.s. n.s. n.s. n.s. p<0.001 p<0.001 p<0.001 p<0.001 C$ vs E? n.s. p=0.02 p=0.09 n.s. n.s. n.s. p=0.02 n.s. n.s. n.s. n.s. p=0.01 n.s. p=0.03 p< 0.001 p=0.01 p< 0.001 n.s. n.s.: p>0.1
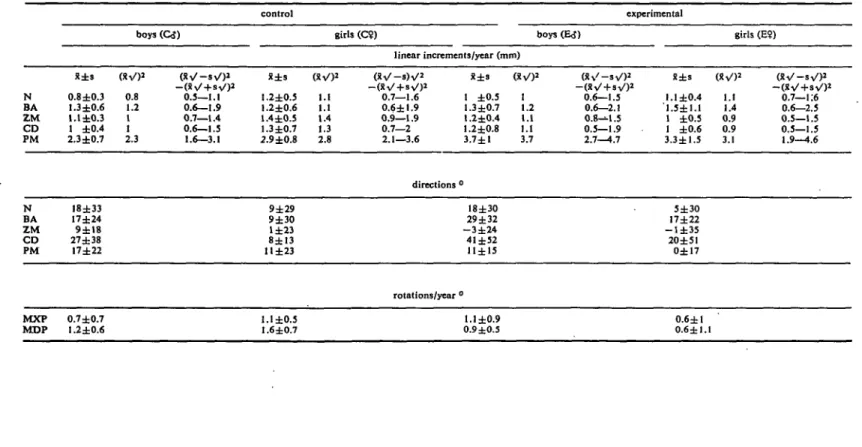
Tablo 3a Overall growth changes (superimposition on anterior cranial base). Means (R) and standard deviations (s) for annual linear increments in mm; directions and annual rotations in degrees; and, Tor the annual linear changes, the results oftheV-transformation of the original data (mm): (x\/)2. corresponding approximately to the median, and (x\/—sV)2—( corresponding approximately to the 66% confidence interval
N BA ZM CD PM N BA ZM CD PM MXP MDP x±s 0.8 ±0.3 1.3 ±0.6 1.1 ±0.3 1 ±0.4 2.3±0.7 18±33 17±24 9±I8 27 ±38 17±22 0.7±0.7 1.2±0.6 boys (QJ) (XV)2 1 0.8 1.2 1 1 2.3 0.5—1.1 0.6—1.9 0.7—1.4 0.6—1.5 1.6—3.1 control x±s 1.2±0.5 1.2±0.6 1.4±0.5 1.3 ±0.7 2.9 ±0.8 9±29 9±30 1±23 8±13 11 ±23 l.l±0.5 1.6 ±0.7 girls (C9) (xV)2 0 1.1 1.1 1.4 1.3 2.8 linear increments/year (mm) lV-s)V2 ZV + sV)1 0.7—1.6 0.6±l.9 0.9—1.9 0.7—2 2.1—3.6 x±s 1 ±0.5 1.3 ±0.7 1.2±0.4 1.2 ±0.8 3.7±1 directions ° 18±30 29 ±32 - 3 ± 2 4 41 ±52 11±15 rotations/year ° l.l±0.9 0.9±0.5 1 1.2 i.l 1.1 3.7 experimental boys (E<J) 2 (xv'-sV)2 0.6—1.5 0.6—2.1 0.8-^1.5 0.5—1.9 2.7—4.7 x±s 1 ,1.1 ±0.4 l' ±0.5 1 ±0.6 3.3±1.5 5±3O 17±22 - 1 ± 3 5 20±51 0±17 0.6±l 0.6±l.l girls (E?) 1.1 0.7—1:6 1.4 0.6—2.5 0.9 0.5—1.5 0.9 0.5—1.5 3.1 1.9—4.6
212 EFFECTS OF ACTIVATOR TREATMENT
Figure 5 Average annual growth changes in the girls and 66% confidence intervals for their linear dimensions and directions in the control (solid lines and homogenously shaded areas) and experimental groups (dotted lines and dotted areas): a) overall, b) maxillary, and c) mandibular growth changes. For graphical illustration the lengths of the arrows were enlarged x 10.
Table 3b Overall growth changes. Levels of significance for the differences between the samples Significance of differences between
N BA ZM CD PM MXP MDP
mean linear increments/year G J v s C ? p=0.01 n.s. p=0.04 n.s. p=0.04 E<J vs E? QJ vs E<J * n.s. n.s. n.s. * n.s. n.s. n.s. • p < 0.001 C? vs E? n.s. n.s. p=0.03 n.s. n.s.
mean directions and C<J vs C? n.s. n.s. n.s. n.s. n.s. p=0.06 n.s. E<JvsE? n.s. n.s. n.s. n.s. p=0.09 * n.s. mean rotations/year C<? vs E<? C$ vs E? n.s. n.s. n.s. n.s. n.s. n.s. n.s. n.s. n.s. n.s. n.s. n.s. n.s. p=0.01 n.s.: p>0.1
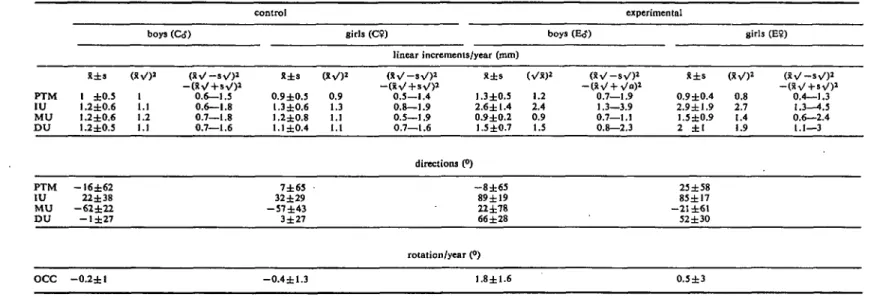
Table 4a Maxillary growth changes (superimposition on the 'key ridge'). Means (x) and standard deviations (s) for annual linear increments in mm; directions and annual rotations in degrees; and, for the annual linear changes, the results of the %/-transformation of the original data (mm); (X%/)2, corresponding approximately to the median, and (XV — sV)2 — (3i \/ + s V )2. corresponding approximately to the 66% confidence interval
boys (QJ) control girls (C9) linear increments/year (mm) boys (E<J) experimental girls (E?) PTM IU MU D U X±s 1 ±0.5 l.2±0.6 1.2 ±0.6 1.2 ±0.5 (XV)2 1 1.1 1.2 1.1 ( X V - s V )2 —(XV+sV)2 0.6—1.5 0.6—1.8 0.7—1.8 0.7—1.6 x±s 0.9±0.5 1.3±0.6 1.2±0.8 1.1 ±0.4 (XV)2 0.9 1.3 1.1 1.1 ( X V - s V )2 —(xV + s V )2 0.5—1.4 0.8—1.9 0.5—1.9 0.7—1.6 X±s 1.3±0.5 2.6±1.4 0.9±0.2 1.5 ±0.7 (Vx)2 1.2 2.4 0.9 1.5 ( X V - s V )2 —(XV + V<")2 0.7—1.9 1.3—3.9 0.7—1.1 0.8—2.3 X±s 0.9±0.4 2.9±l.9 1.5±0.9 2 ±1 (XV)2 0.8 2.7 1.4 1.9 (XV - s V )2 - ( X V + s V )2 0.4—1.3 1.3—4.5 0.6—2.4 1.1—3 PTM IU MU DU OCC —16±62 22 ±38 - 6 2 ± 2 2 - 1 ± 2 7 - 0 . 2 ± l 7±65 32±29 - 5 7 ± 4 3 3±27 - 0 . 4 ± 1 . 3 directions (°) - 8 ± 6 5 89 ±19 22±78 66±28 rotation/year (°) 1.8±1.6 23 ±58 85±17 - 2 1 ±61 52 ±30 0.5±3
214 EFFECTS OF ACTIVATOR TREATMENT
Figure 6 Illustration of the average treatment effects on a) overall, b) maxillary, and c) mandibular growth and development in the boys. The vectors were constructed as resultants between the significantly different average control and experimental growth co-ordinates. Note the lack of inhibition of maxillary displacement, the stimulation and redirectioning of mandibular condylar growth, and the pronounced inhibition of vertical dental develop-ment in the maxilla and in the lower front.
position of the temporo-mandibular joint relative to the cranial base (S-N-Ar), the length of the mandibular corpus (S-N: M-Go) and the vertical and sagittal dental relations.
Cephalometric changes are summarized in Tables 3-5 and illustrated in Figs. 4 and 5. As can be seen from the means and the standard deviations, the linear increments did not follow a normal distribution and histo-grams showed that the distribution in most
instances was more or less positively oblique. This means that the linear growth changes were usually small but that exceptions, with much greater increments, were relatively frequent. Histograms were constructed after a square root a and logarithmic transformation (Figs. 3b and 3c) to see whether such trans-formed data would better fit normal distribu-tion. The square root transformation (Fig. 3b) for the greater part of the linear measurements
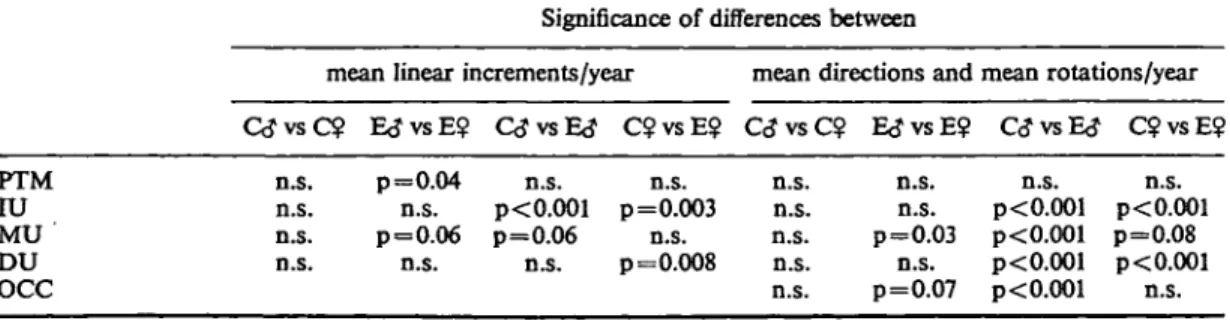
Table 4b Maxillary growth changes. Levels of significance for the differences between the samples Significance of differences between
mean linear increments/year mean directions and mean rotations/year
PTM IU MU DU OCC n.s. n.s. n.s. n.s.
GJvsC? E<JvsE$ QJvsE<? C?vsE$ QJvsC? EtJvsE? C<?vsE<? C?vsE$ p=0.04 n.s. n.s. n.s. p<0.001 p=0.003 p=0.06 p=0.06 n.s. n.s. n.s. p=0.008 n.s. n.s. n.s. n.s. n.s. n.s. n.s. p=0.03 n.s. p=0.07 n.s. p<0.001 p<0.001 p<0.001 p< 0.001 n.s. p< 0.001 p=0.08 p< 0.001 n.s. n.s.: p>0.1
Tnblo 5a Mandibular growth changes (superimposition of on PM and on the contours of the mandibular canal). Means (X) and standard deviations (s) for annual linear increments in mm; directions and rotations in degrees; and, for the annuallinear changes, the results of theV-transformation of the original data (mm): (Xy)2, corresponding approximately to the median and (StV—sV)J—(xV+svO2, corresponding approximately to the 66% confidence interval
boys (C<5) control girls (C9) linear increments/year (mm) boys (Ed1) experimental girls (E9) X±2 (xvO2 CD 1L ML DL 2.6±0.8 2.5 0.7 ±0.6 0.6 0.8±0.5 0.7 0.7±0.5 0.6 ( X V - s V )2 -(XV + sV)2 1.7—3.4 0.2—1.2 0.3—1.3 0.3—1.1 X±s (XV)2 X±s 3.2±1 0.8 ±0.3 1 ±0.4 0.8 ±0.3 3.2 0.7 0.9 0.8 (XV)2 0.4—1.1 0.6—1.3 0.5—1.1 3.5±0.9 1 ±0.7 1.3±0.5 1.1 ±0.4 3.5 0.9 1.2 1.1 2.7—4.4 0.3—1.7 0.7—1.9 0.7—1.5 X±s 3.4±1.1 1.3 ±0.7 1.3 ±0.5 1.1 ±0.4 (XV)2 3.4 1.2 1.3 (Xi/-sV>2 2.4—4.5 0.7—2 0.8—1.9 0.7—1.5 CD 1L ML DL OCC 33±19 47 ±39 89±67 86±24 0.4 ±0.6 38±8 41±39 86±29 75±28 0.1±l.l directions (°) 23±10 83 ±30 92±26 94±24 rotation/year (°) 1.6±1.3 22±20 88 ±37 99±31 105±27 0.7±2.2
216 EFFECTS OF ACTIVATOR TREATMENT
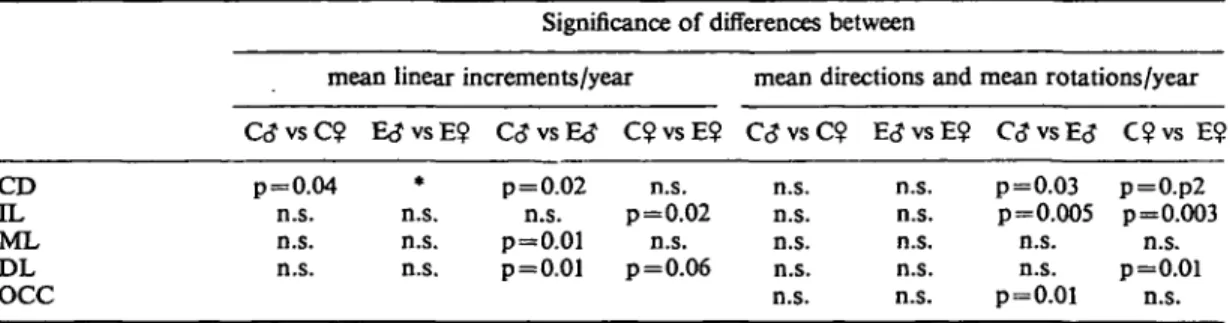
Table 5b Mandibular growth changes. Levels of significance for the differences between the samples Significance of differences between
mean linear increments/year mean directions and mean rotations/year G J v s C ? E<JvsE$ C<JvsE<J C$vsE$ C<JvsC$ E<JvsE°. C\JvsE<J C 9 v s E $ CD IL ML DL OCC p=0.04 n.s. n.s. n.s. * n.s. n.s. n.s. p=0.02 n.s. n.s. p=0.02 p=0.01 n.s. p=0.01 p=0.06 n.s. n.s. p=0.03 p=0.p2 n.s. n.s. p=0.005 p=0.003 n.s. n.s. n.s. n.s. n.s. n.s. n.s. p=0.01 n.s. n.s. p=0.01 n.s. n.s.: p>0.01
•Significant differences between control boys and girls, comparison of experimental boys and girls omitted
corresponded quite closely to a normal distribution, whereas the logarithmic trans-formation produced a negative oblique distribution.
Tables 3-5 show that the annual linear changes of the points N, ZM and PM relative to the anterior cranial base, and the annual condylar growth (CD relative to PM) differed
significantly between the control boys and girls but no significant differences were found in the directions of the growth changes. All statistical procedures were therefore carried out separately for boys and girls. Comparisons between the two experimental groups are of only relative importance because it is possible that differences could be a consequence of
Figure 7 Illustration of the average treatment effects on a) overall, b) maxillary, and c) mandibular growth and development in the girls. The vectors were constructed as resultants between the significantly different average control and experimental growth coordinates. Note the marked inhibition of maxillary displacement, the redirection (without stimulation) of mandibular condylar growth, and, compared with the effects in the boys (Figure 6), the less pronounced inhibition of vertical dental development particularly in the upper molar and lower incisor region.
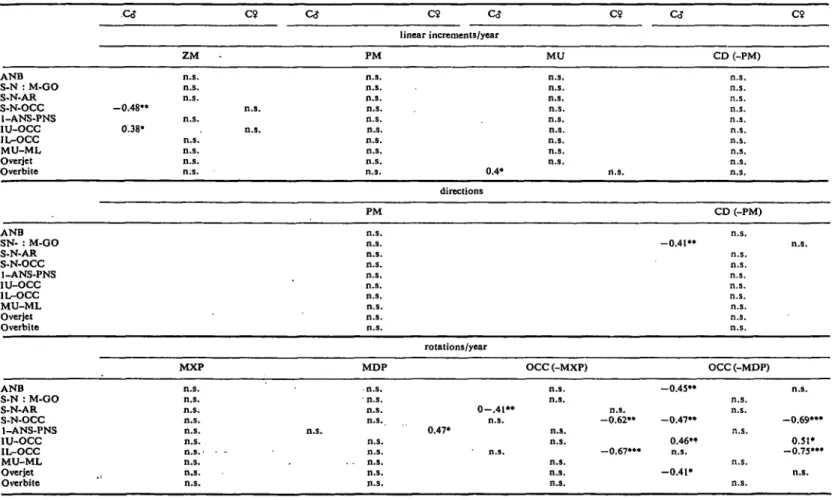
Table 6 Coefficients (r) of correlations between the most interesting growth changes observed in the two control groups (CcJ and C9) and differing initial cephalometric measurements. GJ C9 Co- c? C<J linear increments/year ZM PM MU CD (-PM) C9 ANB S-N : M-GO S-N-AR S-N-OCC I-ANS-PNS 1U-OCC IL-OCC MU-ML Overjet Overbite - 0 . 4 8 " 0.38* n.s. n.s. n.s. n.s. n.s. n.s. n.s. n.s. n.s n.s n.s. n.s. n.s. n.s. n.s. n.s. n.s. n.s. n.s. n.s. n.s. n.s. n.s. n.s. n.s. n.s. n.s. n.s. n.s. 0.4* n.s. n.s. n.s. n.s. n.s, n.s. n.s. n.s. n.s. n.s. directions PM CD (-PM) ANB SN- : M-OO S-N-AR S-N-OCC 1-ANS-PNS IU-OCC IL-OCC MU-ML Overjet Overbite n.s. n.s. n.s. n.s. n.s. n.s. n.s. n.s. n.s. n.s. - 0 . 4 1 " n.s. n.s. n.s. n.s. n.s. n.s. n.s. n.s. rotations/year MXP MDP OCC (-MXP) OCC(-MDP) ANB S-N : M-GO S-N-AR S-N-OCC 1-ANS-PNS IU-OCC IL-OCC MU-ML Overjet Overbite n.s. n.s. n.s. n.s. n.s. n.s. n . s . • n.s. n.s. n.s. n.s. n.s. n.s. n.s. n.s. n.s. n.s. n.s. n.s. 0.47* 0 - . 4 1 " n.s. n.s. n.s. n.s. n.s. n.s. n.s. n.s. n.s. n.s. - 0 . 6 2 " -0.67"* - 0 . 4 5 " - 0 . 4 7 " 0.46" n.s. -0.41* n.s. n.s. n.s. n.s. n.s. n.s. - 0 . 6 9 " ' 0.51* -0.75"* n.s.
n.s.: r not significantly different from 0 (p>0.1) •:0.1>p>0.05
":0.05>p>0.0l •":0.01>p>0.00I
to
00
Table 7 Interpretation of the significant correlations between initial cephalometric measurements and growth changes concerning their ability to explain differences found between experimental boys and girls (E<J/E$) or between experimental and control subjects (GJ/EcJ and C5/E9)
Differences between E(J and E$ in:
Initial cephalometric measurements
S-N-OCC S-N-AR IU-OCC Overbite
help to explain differences in: accentuate differences in:
ZM (mm) OCC (-MXP) OCC (-MDP) OCC (-MXP) ZM (mm) OCC (-MDP) MU (mm)
CcJ and E<J in: ANB S-N : M-GO IL-OCC Overjet Overbite
help to explain differences in:
accentuate differences in: OCC (-MDP)
CD (-PM,
OCC (-MXP) OCC (-MDP) MU (mm) OCC (-MDP)
C$ and E? in: ANB S-N-AR 1-ANS-PNS IU-OCC IL-OCC Overjet
help to explain differences in:
accentuate differences in: OCC (-MDP)
OCC (-MXP) ZM (mm)
MDP OCC(-MDP) OCC(-MXP) OCC (-MDP) OCC (-MDP)
EFFECTS OF ACTIVATOR TREATMENT 219
different growth potential in males and females at about 9 years of age. If significant differences already existed between the controls, these comparisons were omitted in the experimental boys and girls (Tables 3-5).
Skeletal and dental cephalometric changes differed between treated and untreated individuals and there were, at least, qualitative differences between the treatment effects in boys and girls as can be seen in Figs 6 and 7. The dental changes resulting from treatment generally showed greater similarity in boys and girls than did the skeletal changes. Significant differences were found between control and experimental subjects in the movements of the upper incisors, upper molars, the upper dentition as a whole, the lower incisors and the lower dentition as a whole. In comparison with the controls, the upper and lower dentition in experimental boys rotated significantly relative to the skeletal bases, whereas in experimental girls these rotations were not significant. The other dental effects of the appliance, although significant in both males and females, were qualitatively different in the different sexes (Figs. 6 and 7), the vertical development of the upper molars, the upper dentition as a whole and the lower incisors being more inhibited in boys than in girls.
Correlation coefficients between initial cephalometric measurements and certain interesting growth changes in the two control samples are displayed in Table 6. Although some coefficients were significantly different from zero, they were generally low (below 0.5); only those between the rotation of the occlusal plane and S-N-Occ and IL-Occ, respectively, were considerably higher. The findings are interpreted in Table 7.
Discussion
The treatment effects were at least qualitat-ively different in boys and girls. In boys, activator therapy led to a significant increase in the amount and alteration of the direction of growth of the mandibular condyle; forward relocation of the bony chin was greater but the direction was unchanged and the mandible
was not rotated. In girls, only the direction of mandibular condylar growth was changed posteriorly (as in boys) and the mandible was rotated downwards and backwards.
The forward and downward relocation of the maxilla was significantly reduced in girls whereas it remained unchanged in boys.
The dental reactions also differed. In boys, the activator generally had more pronounced vertical effects. The most striking difference was that the occlusal plane rotated significantly in the boys but not in the girls.
The experimental sample of this study exhibited the same inconsistent reaction to activator treatment that is found in reports in the literature. The fact that the differences occurred in the same sample afforded an opportunity to investigate some of the reasons behind these inconsistencies.
The findings do not exclude the possibility that boys and girls react differently. Comparisons with other studies, however, are impossible because no other workers have treated boys and girls statistically as separate groups.
The different reactions could, further-more, result from different growth patterns combined with different initial cephalometric patterns. The correlations made in the control groups between initial measurements and growth changes parallel those reported by Maj and Luzi (1964), Balbach (1969) and 0degaard (1970a, 1970b). Although some differences seen between experimental boys and girls could, at least partly, be accounted for by the different initial cephalometric pattern, no correlation explaining the different condylar behaviour was found.
A third explanation could be different modes of action of the appliances. In boys, the generally more pronounced vertical effects on the dentition and the significant increase of condylar growth are compatible with the hypothesis of functional adaptation, while the girls exhibited the pattern of reaction to be expected if the activator created elastic forces in the soft tissues. However, the considerable distally directed effects in the upper dentition and the pronounced rotation of the occlusal plane in the boys are not consistent with the
220 EFFECTS OF ACTIVATOR TREATMENT
hypothesis of functional adaptation. Further-more, boys and girls followed the same regimen in wearing the appliance and it is extremely unlikely that there are sex-linked differences in muscle behaviour during sleep.
The fourth hypothesis for the difference in the reactions of boys and girls is that differences in the construction of the appli-ances influenced their effects. One respect in which the activators were different in the two experimental groups was that the significantly greater overbite in boys inevitably led to a considerably higher construction bite to permit the required mandibular protrusion. McNamara (1977) showed that, in monkeys, increased height of an intermaxillary appli-ance led to a reduction in the vertical develop-ment and an increase in the forward displacement of the maxilla, and to inhibition of the vertical development of both the upper and lower dentition. In the present study the combination of forces exerted posteriorly by the sagittal activation and anteriorly by the pronounced bite opening could lead to the unaltered maxillary displacement and more pronounced inhibition of the vertical develop-ment of the upper and lower dentition than would result from the smaller amount of bite opening in the other subjects. The increase in condylar growth in boys could then be ex-plained by the fact that the maxilla did not contribute to thecorrection of the Class II relationship.
This interpretation is not in agreement with the views of Harvold and Vargervik (1971) and Woodside et al. (1975) who found an inhibition of maxillary displacement due to activator treatment with greater amounts of bite opening than were used in this study. It is possible, however, that this amount of intermaxillary height could result in the forces created by the forward activation of the mandible being transduced to the upper jaw through a much larger cantilever, thus exerting a much greater moment.
Conclusions
The results of this study allow the following conclusions to be drawn:
It is possible to alter both the amount and direction of mandibular condylar growth to a clinically relevant extent by activator treatment.
Clinically, two types of reaction to treatment have to be distinguished, differing in the extent to which mandibular growth is altered. In one, the amount and direction of condylar growth are altered, the displacement of the maxilla is not influenced but there is pronounced inhibition of vertical dental development so that the bony chin is relocated to an increased extent but its forward direction is unchanged. In the other, condylar growth is redirected more posteriorly but the downward and forward displacement of the maxilla is inhibited. The inhibition of vertical dental development is less marked and so the man-dible is rotated downwards and backwards. These different reactions are probably a result of differences in the appliance con-struction, particularly in the height of the construction bite, a higher activator leading to less maxillary and more mandibular reaction. Comparison of the results with the findings of other workers, however, indicates that still greater vertical increase in the appliance again favours the second type of reaction.
There is no indication that different modes of action of the appliance are respon-sible for the different reactions. The results are on the whole in agreement with the concept that the activator transduces elastic forces, generated through stretching the soft tissues, to the skeletal and dental structures.
However, the possibility that boys and girls generally react differently to activator treatment cannot be excluded. Furthermore, some results of this study may have been a consequence of special growth patterns combined with certain features in the initial cephalometric pattern rather than of the treat-ment. In this case, the inclination of the occlusal plane relative to the cranial base is the most important factor to be taken into account in diagnosis of Class II, Division 1 cases.
Acknowledgements
EFFECTS OF ACTIVATOR TREATMENT 221
Swiss National Foundation for Scientific Research, the Hartmann-Miiller Foundation for Medical Research and the Foundation for Scientific Research of the Swiss Society of Dentists.
Address for correspondence
H. U. Luder, Department of Orthodontics, University of Zurich, Plattenstrasse 11, 8028 Zurich, Switzerland. References Ahlgren, J. (1960). An electromyographic analysis of the response to activator (Andresen-Haupl) therapy. Odont. Rev. 11:
125-151.
Ahlgren, J. (1970). The neurophysiologic principles of the Andresen method of functional jaw orthopedics. A critical analysis and new hypothesis. Svensk. Tandl.
Tidskr. 63: 1-9.
Andresen, V. and Haupl, K. (1936).
Funktions-kieferorthopddie. Hermann Meusser Verlag,
Leipzig.
Auf der Maur, H. J. (1978). Elektromyo-graphische Befunde am Musculus ptery-goideus externus wahrend der Distalbiss-therapie mit dem Aktivator. Schweiz.
Mschr. Zahnheilk. 88: 1085-1099.
Balbach, D. R. (1969). The cephalometric relationship between the morphology of the mandible and its future occlusal position.
Angle Orthodont. 39: 29-41.
Bjork, A. (1955). Facial growth in man, studied with the aid of metallic implants.
Ada Odontol. Scand. 13: 9-34.
Bjork, A. (1963). Variations in the growth pattern of the human mandible: Longi-tudinal radiographic study by the implant method. / . Dent. Res. 42: 400-411.
Bjork, A. and Skieller, V. (1977). Growth of the maxilla in three dimensions as revealed radiographically by the implant method.
Brit. J. Orthodont A: 53-64.
Demisch, A. (1973). Auswirkungen der Distalbisstherapie mit dem Aktivator auf das Gesichtsskelett. Schweiz. Mschr.
Zahnheilk. 83: 1072-1092.
Demisch, A. (1978). Langzeitbeobachtungen iiber die Veranderungeri der Lagebezie-hungen zwischen den Kieferbasen und der Okklusionsebene vor, wahrend und nach Distalbissbehandlung mit dem Aktivator.
Schweiz. Mschr. Zahnheilk. 88: 1059-1069.
Dietrich, U. C. (1973). Aktivator—mandi-bulare Reaktion. Schweiz. Mschr.
Zahnheilk. 83: 1093-1104.
Freunthaller, P. (1967). Cephalometric observations in Class II, Division 1 malocclusions treated with the activator.
Angle Othodont. 37: 18-25.
Harvold, E. P. and Vargervik, K. (1971). Morphogenetic response to activator treatment. Amer. J. Orthodont. 60:478-490. Hotz, R. P. (1961). Orthodontia in everyday
practice. Hans Huber, Medical Publisher,
Berne, Switzerland, p. 134-141.
Hotz, R. P. (1970). Application and appliance manipulation of functional forces. Amer. J.
Orthodont. 58:459^178.
Jakobsson, S.O. (1967). Cephalometric evaluation of treatment effect on Class II, Division 1 malocclusions. Amer. J.
Ortho-dont. 53:446-457.
Maj, G. and Luzi, C. (1964). Longitudinal study of mandibular growth between nine and thirteen years as a basis for an attempt of its predicition. Angle Orthodont. 34:220-230. Marschner, J. F. and Harris, J. E. (1966). Mandibular growth and Class II treatment.
Angle Orthodont. 36: 89-93.
McNamara, J. A., Jr. (1972). Neuromuscular and skeletal adaptations to altered orofacial function. Monograph Number 1, Cranio-facial Growth Series, Center for Human Growth and Development, The University of Michigan, Ann Arbor, Michigan. McNamara, J. A., Jr. (1977a). An
experi-mental study of increased vertical dimension in the growing face. Amer. J.
Orthodont. 71: 382-395.
McNamara, J. A., Jr. (1977b). An experi-mental study of bite plate therapy in adults.
222 EFFECTS OF ACTIVATOR TREATMENT
Meach, C. L. (1966). A cephalometric comparison of bony profile changes in Class H, Division 1 patients treated with extraoral force and functional jaw ortho-pedics. Amer. J. Orthodont. 52: 353-370. Melsen, B. (1974). The cranial base. Ada
Odontol. Scand. 32: Suppl. 62.
0degaard, J. (1970a). Growth of the mandible studied with theaid of metal implants Amer.
J. Orthodont. 57: 145-157.
0degaard, J. (1970b). Mandibular rotation studied with the aid of metal implants.
Amer. J. Orthodont. 58: 448-454.
Salzmann, J. A. (1966). Practice of
Ortho-dontic, Vol. 1. J. B. Lippincott Company,
Philadelphia, p. 487-494.
Stockli, P. W. and Willert, H. G. (1971). Tissue reaction in the temporomandibular joint resulting from anterior displacement of the mandible in the monkey. Amer. J.
Orthodont. 60: 142-155.
Stockli, P. W. and Dietrich, U. C. (1973). Experimental and clinical findings following functional forward displacement of the mandible. Trans. Europ. Orthod. Soc. 49: 435^42.
Trayfoot, J. and Richardson, A. (1968). Angle Class II, Division 1 malocclusions treated by the Andresen method. Brit. Dent.
J. 124: 516-519.
Wieslander, L. and Lagerstrom, L. (1979). The effect of activator treatment on Class II malocclusions. Amer. J. Orthodont. 75: 20-26.
Woodside, D. G., Reed, R. T., Doucet, J. D. and Thompson, G. W. (1975). Some effects of activator treatment on the growth rate of the mandible and position of the midface.
Trans. Europ. Orthod. Soc. (J. T. Cook, ed.),
Crosby Lockwood Staples, London, p. 459-480.