Chemical Senses vol.16 no. 1 pp.81-93, 1991
Analysis of a system of description of odors by means of
four different multivariate statistical methods
Maurice Chastrette, Jean-Yves de Saint Laumer and Philippe Sauvegrain1
Laboratoire de Chimie Organique Physique, University Lyon 1, 43 Boulevard du 11 Novembre 1918, 69622 Villeurbanne Cedex, France and 'Firmenich SA, Case Postale 239, CH-1211, Geneve 8, Switzerland
Abstract. In order to analyze the relationships among 32 descriptors of odors (notes), similarity coefficients
were calculated using a data bank of 628 odoriferous products. The simple examination of the similarity matrix (32,32) has shown notes selectively and strongly associated (e.g. camphoraceous — pincy and musky—powdery) and others less selectively associated (e.g. floral, green and herbaceous). This analysis was completed by four multivariate statistical methods. Non-linear mapping (NLM) proved to be more efficient than principal coordinates analysis for planar representation of olfactory notes, and has given results similar to those previously obtained using other data and other methods (similar disposition of notes around the central note 'floral'). Furthermore, the ascending hierarchical taxonomy and the minimal spanning tree were coherent with the NLM representation. These three methods complete each other and constitute a convenient system to analyze odor descriptions.
Introduction
Perfumers use a relatively small number of words or notes to describe odors (Jaubert
el al., 1987; Randebrock, 1985; Elmouaffek, 1988). In a previous paper Chastrette et al. (1988) analyzed 24 notes frequently used by Arctander (1969) to describe odors.
Using principal coordinates analysis, based on similarities among notes, they have shown that the corresponding olfactory space was not strongly structured. They distinguished three kinds of notes: those which are isolated (no strong association), those which are selectively associated (one or two strong associations) and those which are associated with a large number of notes (several associations). Isolated notes are favorable to the structure-activity analysis, unlike those which are not selectively associated and which correspond to a large range of chemical structures.
In this paper, another system of odor description, designed by Firmenich SA, is analyzed by means of four different statistical methods: principal coordinates analysis (PCA), (Massart and Kaufman, 1983), non-linear mapping (NLM) (Sammon, 1969), ascending hierarchical taxonomy (AHT) (Dagnelie, 1984) and minimal spanning tree (MST) (Lee et al., 1977). The two objectives of these analyses are: (i) to confirm or modify the results concerning Arctander's odor description system (1969), or another description system, and (ii) to compare the four statistical methods and find those which are the most consistent, in agreement with the empirical rules of perfumery. Materials and methods
Data
A data bank of 628 pure odorous substances, commonly encountered in perfumery and compiled by Firmenich SA, has been analyzed. Each product is described by a team of seven perfumers by two, three or four words called notes and chosen among 32 81
M.Cbastrette et at.
possible descriptors. The descriptors, which may be repeated, are cited in order of decreasing intensity. Only the first three descriptors have been used in the present work.
Construction of the similarity matrix
The 628 pure substances of the data bank are considered as individual entities defined by the 32 variables which are associated with notes and which take the values 1 or 0. Let X(32 X 628) be the data matrix. The value of xij corresponding to the jth compound and to the Jth note, is either 1 if the note '/' is present in the description of the yth compound or 0 otherwise. Then, the matrix of occurrence/co-occurrence C(32 x 32) is calculated as the product of the matrix X by its transpose matrix 'X. From matrix C, the similarity matrix S(32 X 32) is calculated using several similarity coefficients proposed in the literature (Iglesias, 1975; Sokal and Sneath, 1963). In a recent study, Chastrette et al. (1988) have selected the similarity coefficient proposed by Ochiai (1957) as it does not take into account a situation where the substances present neither the i note nor they note. This similarity coefficient, si,j, which is an element of the similarity matrix S, is then defined by:
sij = cijl(ci,i X cjj)m, 0 <, sij ^ 1
cij = element of the matrix of occurrence/co-occurrence C Test of significance of associations
The analysis of similarity between two notes i and j must be completed by a test of significance. Such a test in a 2 X 2 contingency table is easily performed (Lamont, 1949), by means of the x2 test, with a single degree of freedom. For each couple of
notes, we determine a similarity coefficient si,j and a \2 value which measures the
significance of this similarity. The level of 90% significance corresponds to a x2 value
equal to 2.7 (Wine, 1964).
Different methods of analysis
A: principal coordinates analysis (PCA). The similarity matrix S is transformed into
a matrix T suitable for PCA (Gower, 1966), according to the equation: tij = si,j — si — sj + s
where tij = element of the transformed matrix T; sij = element of the similarity matrix S; si = mean of row i; sj = mean of column j ; s = mean of all the elements of the matrix S.
During a second stage, PCA is performed on the transformed matrix T and several factorial planes are used to represent the relationships among the 32 descriptors used in the data bank.
B: non-linear mapping (NLM). Multidimensional scaling has been used by Schiffman
(1974) to classify odorous chemical substances and to represent them on a map. Here, we have used a slightly different method, the non-linear mapping (NLM), to obtain a planar representation of the descriptors. In both methods, projections are made in order to preserve the distances between descriptors, considered as points in an L-dimensional space, as well as possible.
Analysis of odor description Sammon (1969) has described an algorithm based on a point mapping of N L-dimensional vectors from the L-space to a lower-dimensional space so that the inherent data 'structure' is approximately preserved.
Let Xi (i = 1, . . .,N) be N points defined by L coordinates in an L-space and let the distance between the points Xi and Xj in the L-space be defined by dij = dist (Xi,Xj).
Let Yi (i = 1, . . . ,N) be N points corresponding to the Xi points and defined by D coordinates in a D-space (D = 2 or D = 3) and the distance between the points Yi and Yj in the D-space be defined by d i j = dist (Yi,Yj).
An initial configuration is randomly chosen for the Yi points. Next, all the D-space distances dij are computed and used to define an error E. E indicates how well the present configuration of the N points in the D-space fits the N points in the L-space.
1 N
E = - D [dij - dij]2/dij
c i < j where c = £ [dij]
The next step in the NLM algorithm consists of adjusting the Yp,q coordinates of the points Yi to decrease the error E. A steepest descent procedure is used to search for a minimum error.
As this method is based on distances, the similarity matrix S has been transformed into a distance matrix D in the following way:
dij = ((1/sij) - 1)/100 and d i j = 1 if si j <0.01
This relation has been chosen to ensure that the ratio between the larger and the smaller distances is significant (=100) and that the larger distances are limited to 1 in order to avoid too strong an influence of those distances on the NLM construction.
C: ascending hierarchical taxonomy (AHT). In hierarchical clustering methods, several
clusters of a set of objects are obtained and are ranked in such a way that smaller clusters are included in larger clusters.
In AHT (Benzecri, 1980) one starts with m objects to be classified, and at each step the two objects (or clusters) which are the most similar are merged into a single cluster. After m — 1 such steps, all objects belong to one large cluster. There are many AHT methods, differing in the criteria used to decide which individual elements or clusters should be merged and the way in which the similarity between a newly obtained cluster and other clusters or objects is defined.
Let A,B, C be three objects or clusters and G a cluster constituted by A and B. Let d(X,Y) be the distance between X and Y. Let nA and nB be respectively the number of objects of the clusters A and B. The three aggregation methods commonly used are the following:
Single linkage: d(G,C) = min (d(A,C), d(B,C)) Complete linkage: d(G,C) = max(d(A,C), d(B,C))
. .. . ,._ _, [nA X d(A,C) + nB X d(B,C)l Average linkage: d(G,C) = i s ' ' ^ ' n
nA + nB
M.Chastrette el at.
The distance between two i and j notes is usually taken as 1 - sij (Dagnelie, 1984). The structure of the classification can be represented graphically by linking the elements together in a dendrogram.
D: minimal spanning tree (MST). This method gives a graph in which no attempt is
made to preserve all the distances. Only the distances to the nearest neighbors are preserved accurately.
Given a set of points, a spanning tree is a connected graph that satisfies the following conditions: (i) every point is on the graph, (ii) there is no loop on the graph, and (iii) the MST is a tree, the total length of which is minimum.
If there are no two links of the MST with equal length, there is only one MST solution. This solution only contains all the information about the distances of the nearest neighbor of every point.
Lee et al. (1977) have proposed building this spanning tree using a triangulation method in which the distance of each point on the graph to two previously mapped points is exactly preserved.
Let Pi and Pj be points already mapped. Let Pk be directly linked to Pj on the MST. Pk is mapped on the 2-space in such a way that its distances to Pi and Pj are exactly preserved. Pi is either the point linked to Pj and preceding Pj in the MST (second nearest neighbor approach) or a central reference point (reference point method).
It is impossible to use the same distance calculation as in NLM because of the triangular inequality (it is not always possible to draw three points while keeping their relative distances). In order to obtain a more readable representation, differences between the distances have been increased by transformation of the usual distance calculation: d i j = 0.55 — Sij instead of d i j = 1 - S i j . These transformations do not modify either the distance ranks or the links between notes. As in this case the reference point method has not proved to be suitable, owing to the large number of notes (32), we have used the second nearest neighbor approach for the MST construction.
Results
Analysis of similarities
To analyze the similarities among descriptors we have to consider three factors: the similarity coefficient, the x2 value and the total number of occurrences for each
possible association. The Sij coefficients, elements of the matrix S (Table I), are often very low. If the limit of similarity is set to s > 0.08 [as in (4)], only 107 associations (21.5%) have to be considered. However, only 26 are significant at a 90% level, i.e. have x2 ^ 2.7.
In short, an association corresponding to high values of s and x2 is both strong and
significant. Examples of this kind are the camphoraceous-piney (s = 0.48; x2 = 72.9)
and ethereal - fruity (s = 0.43; x2 = 65.3) pairs.
On the contrary, some pairs correspond to lower values of s and x2 and can be
considered as not associated. For example, while each descriptor could be involved in 31 associations, musky has 27 association coefficients equal to 0, and amber has 22. Their rare associations are often very significant. Actually, musk is associated
Tabk I. Similarity matrix S calculated using Ochiai's coefficient AMXBXO I.OD 0 . 0 ] 1.00 0.7J 0.03 I . t o •MCY C . O O 0 . 0 0 0 , 1 1 I . t o » W I T Y o . o ? o . « j O . J I o . o i i . o o r i i * i R m i t f i f c j a o . o o o . o i o . o t 0 . 0 3 O . O J 1 . 0 0 ^ ^ • • V 0 . 0 0 0 . 0 7 0 . 0 0 0 . 0 0 0 , 0 3 0 , « t 1 . 0 0 1 ' " " ' • ' O . I ? 0 . 0 0 O . J I 0 . 1 1 O.OI 0 . 0 0 O.OI 1 . 0 0 F A T T Y 0 . 0 0 0 . 1 0 0 . 1 1 0 . 0 ? O . O I 0 . 0 . 0 . 0 7 O . O J 1 . 0 0 C t T m j a ° - » ' 0 . 0 3 0 . 1 1 0 . 0 ? O . O I 0 0 . 0 I . 0 0 1 0 7 1 I 0 0 ~ > m * c n u , o . , 3 o . o o 0 . 7 0 0 . 0 ? o . , j . . , ? o . , j , » 0 ! . . . . , . , . 0 0 ««™ O . O J 0 . 0 3 O . O J 1 . 0 0 1 . 0 ? 0 . 1 1 0 . 0 0 0 . 0 3 1 . 0 0 0 . 0 0 0 . 7 3 1 . 0 0 0 . 0 0 0 . 0 7 0 , 0 7 0 . 1 2 1 , 0 0 O . O t 0 , 1 1 0 . 2 3 0 . 0 0 0 . 0 * O . O I 0 . 0 0 1 . 0 0 0 . 0 0 0 , 0 0 0 , 0 f t 0 , 1 0 0 . 0 0 0 , 0 0 0 , 0 * 0 , 0 7 0 . 0 0 O . O t 0 0 0 0 0 1 I 0 0 0 . 0 0 0 . 0 0 0 . 0 7 0 . 0 0 0 . 1 7 0 . 0 0 0 . 0 1 0 . 0 0 0 . 0 0 0 . 0 3 O . O S O . t O 0 . 0 0 0 . 7 3 1 , 0 0 v . D u Q . Q 7 0 , / 1 0 . 7 t t , 0 1 0 . 0 7 0 * 0 1 0 . 7 3 0 . 0 0 0 . 0 7 O . t l 0 . 0 0 0 , 0 7 0 , 0 0 0 , 0 0 1 . 0 0 C.OD 0 . 0 0 O.LO 0 , 0 0 O . l t 0 , 0 0 0 , 0 0 0 . 0 7 0 , 0 ) 0 , 1 7 0 , 1 0 0 , 0 0 0 , 0 0 0 0 0 0 00 0 Oft 1 0 0 C . 0 3 0 . 0 1 0 . I I 0 . 0 ) 0 . 0 f t 0 , 1 ) O . l f t 0 , 0 * 0 , 0 3 0 . 0 3 0 . 1 0 0 . 0 0 O . I ) 0 . 0 7 0 . 0 0 0 . 0 2 0 , 0 0 1 . 0 0 C . C 1 0 . 1 1 0 , 2 f t 0 . 0 3 0 . 7 1 0 . 0 1 O . t 7 0 . 0 * 0 . 1 1 0 . 1 7 0 . 7 7 0 . 0 7 0 . 0 1 0 . 1 B 0 . 0 7 O . O I 0 . 1 1 0 . 7 2 I . O f t O . l i 0 . 0 0 Q , 0 0 0 , 0 0 • , 0 * 0 , 0 0 0 . 0 0 0 , 0 ) 0 . 0 ) 0 , 0 0 0 . 0 * 0 . 0 0 0 . 0 0 0 , 1 2 0 . 0 0 O.OB 0 . 0 3 0 , 0 0 O . O I I . 0 0 • I • 0 1 0 * 1 0 0 , 0 0 0 , 0 f t 0 . 0 ) O i l O 0 . 0 0 0 . 0 2 0 . 0 0 0 , 0 0 0 0 0 0 00 0 0 0 0 0 0 0 0 0 0 I t 0 00 I 0 0 0 . 0 7 0 , 0 7 O . O I 0 , 0 3 0 * 0 3 0 . 0 7 0 , 0 0 0 , 0 2 0 , 1 0 0 . 0 0 0 , 0 3 0 , 0 0 0 . 0 0 0 0 ) 0 0 0 0 10 0 0 7 Q 0 * 0 0 0 1 0 0 * v , D O D . l l 0 . 0 0 0 . 0 0 0 . 0 7 0 , 1 0 0,0) 0,01 0.00 0,03 0 0 0 0 0 1 0 0 3 0 O f t 0 0 0 0 1 2 0 0 0 0 0 0 0 0 0 1 O D 0 . 0 0 0 . 0 * O . l f t 0 . 0 0 0 . 1 1 0 . 0 0 1 , 0 0 0 . 0 * O . O i 0 . 0 0 0 . 0 ) 0 . 0 0 0 . 0 3 0 . 0 0 0 . 0 0 0 . 0 7 0 . 0 ) 0 . 0 7 0 . 0 f t 0 . 0 1 0 , 0 1 0 , 7 1 0 , 0 0 1 . 0 0 • ' • " w « G 9 i » B w • , I I O . O O 0 , 0 0 0 , 0 7 0 , 0 ) 0 . 0 0 0 . 0 f t 0 , 0 0 0 , 0 3 O . l t 0 . 0 0 0 , 0 f t 0 0 0 0 0 0 0 , 0 0 0 . 0 ) 0 0 0 0 0 0 0 . 0 ) 0 . 0 1 0 0 0 1 . 0 0 * • * • i t v . v v I • v o 0 , 1 ) 0 , 0 0 O . O t 0 . 0 0 0 . Q 3 9 . 0 ) 0 . 7 0 0 . 0 0 0 . 0 0 0 . 0 0 0 , 0 * 0 . 0 0 0 . 0 7 0 . 0 ) 0 . 0 0 0 . 0 f t t 1 1 O . t O 0 . 0 0 0 , 0 0 0 » t 7 1 0 0 * * * * M i M . C . 3 3 0 . 0 0 O . I ) 0 . 0 3 0 . 0 3 0 . 0 0 O . t O 0 . 1 1 O . O t O . O i 0 . 0 7 t . 0 0 0 , 0 0 0 , 0 3 0 . 0 ) 0 . 0 0 0 . 0 7 0 . 0 ) 0 . 0 3 0 . 0 0 0 , 0 0 0 , 2 0 0 , 1 0 0 , 0 3 0 . 0 0 0 , 0 0 0 , 0 ) 0 , 0 7 O . l t 1 . 0 0 © ' • • • • • • • • • • « • • • • * • • • • • • • • • • o C < l° ° "0 1 ° '0 1 ° '0 0 ° ' °G ° 'G G ° '2 1 G' ° ° ° ' ' ° ° ' ° ° * * •00 * • '00 ° -0 0 '•00 Q ^ ___^^_ "l
t
DM.Chastrette et al.
significantly only with the note powdery (s = 0.33; x2 = 95.1), and amber with
animal (s = 0.19; x2 = 3.72) and woody (s = 0.32; x2 = 55).
Between these extreme cases, descriptors such as floral, fruity, herbaceous and green present numerous associations when only sij is taken into account. For example, floral appears as associated with 17 other descriptors (15 for fruity, 13 for herbaceous and 14 for green). The four descriptors are involved in 59 of the 107 pairs with s £ 0.08. However, these apparent associations are produced by the high number of occurrences and consequently of co-occurrences of those notes. In fact, floral has significant associations with anisic only (s = 0.25; x2 = 7.0).
These observations can be compared with the conclusions of a previous study (Chastrette et al., 1986) in which 24 notes were analyzed by means of PC A and AHT, from the description of 2467 chemical substances by Arctander (1969). A similarity matrix was used in a PCA and in an AHT. The main results were as follows. The camphoraceous — minty pair has the strongest association (in our study s = 0.18 and X2 = 7.82). The most frequently associated notes were floral, fruity and green. The
less frequently associated notes were musky, amber and anisic. In this previous study, the notes powdery and piney were not analyzed because they were not used in the odor description by Arctander.
Principal coordinates analysis
The principal coordinates analysis (PCA) of the matrix T (the latter is the result of the transformation of the similarity matrix S) gives a representation of the olfactory space defined by the 32 notes of the Firmenich data bank. The results of the PCA are given in Table II.
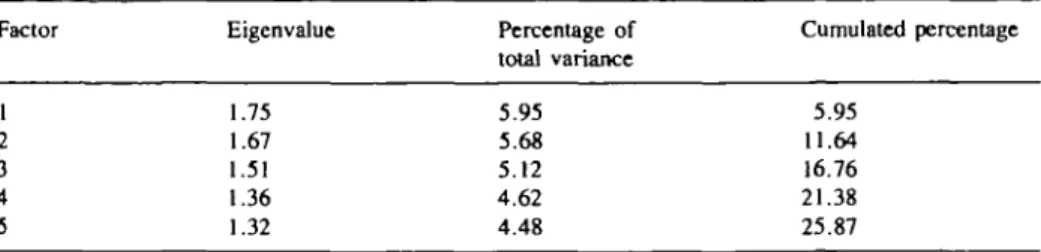
The eigenvalues decrease slowly, and the first two axes account for only 11.64% of the total variance. Five axes are needed to represent 25% of the information.
If all the factors were equivalent, each of them would represent —3% of total variance. Here the total variance contributed by the first axis is only 6%. These results reflect the loose structure of the olfactory space. A similar study of Arctander's data has led to the same conclusion (Chastrette et al., 1986). Figure 1 shows the projection of the olfactory notes on the first two factorial axes. This graph brings out associations between camphoraceous-piney, animal-musky, green-fruity, woody-amber. Such associations are interesting, but the very small percentage of total variance contributed by each axis does not allow us to use this representation only. The other projections on factorial axes 1-3 or 2 - 3 are not presented here because none of them gives interpretable structures. Each of these representations accounts for a limited percentage of the total variance. In all these projections, some associations are preserved while
Table II. Percentage of total variance contributed by each eigenvalue Factor 1 2 3 4 5 Eigenvalue 1.75 1.67 1.51 1.36 1.32 Percentage of total variance 5.95 5.68 5.12 4.62 4.48 Cumulated percentage 5.95 11.64 16.76 21.38 25.87 86
Analysis of odor description PYROtEHOUB . POHDERY . AMDUL . «J«" . « . PHCMC . — » a WOODY . ALMOND • . C ( A L I C Y L A T I . , . BALBAMIC LACTONIC . 0«U> • ICY L I C F2 . FLORAL U L I N*B Y VIOLET 1MISIC . .HONEY . A C I D I C . " ™ . * " •C-FLOMR • ™ " . SULFURY . CITRUS H . HUM* , MDfrr PINEY . CAMPHORACIOUS . FRUITY . tnEEN CREAL F1 IHBAC1OU1
Fig. 1. Projection of the 32 olfactory notes on the first two factorial axes (Fl and F2).
. AMBCR • MOODY . • • I C Y . PIHEY . MUSKY . ANIMAL P O M L V I T . CAM-HORACEOUS . . ^ ^ ' H U M U» . aALSAMIC I l l l l — PI HMtD * • CXTTUB t lffmn*fTfWW •FLOftAL HC . «0» . SHEEN * FATTY ACIDIC . LACTONIC CULINARY • • VIOLET . SULFURY • MEY . BALICYLATE III! . ALMOND . PYRCMCH0U1
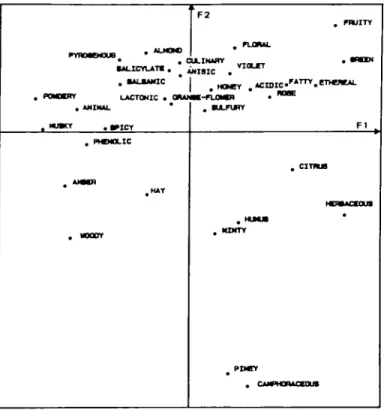
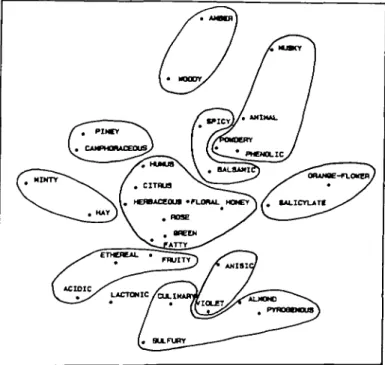
Fig. 2. Non-linear mapping of the 32 olfactory notes.
M.Chastrette el al.
others are not shown. For these reasons it is difficult to distinguish the real associations from the superpositions due to projection and PCA appears to be poorly adapted to our problem.
Non-linear mapping
Non-linear mapping (NLM) is also a global analysis and gives graphic solutions after a quick convergence of the error coefficient E (often less than 300 iterations).
Two-hundred random initial configurations were used in the NLM algorithm. All the solutions which were obtained after 300 iterations are very similar and are representative of the local minima of the E coefficient. The solution presented in Figure 2 was obtained many times (allowing for rotation and symmetry) and corresponds to the best solution according to the criterion defined by NLM.
Comparison between PCA and NLM
PCA shows some of the strongest associations, but the positions of some notes are incorrect. So, one of the less associated notes, anisic, appears in the middle of Figure 1, clustered with many notes. On the contrary, floral, the most frequently associated note, is far from the center of the figure.
The low association of anisic is represented by its isolated position on the NLM (Figure 2) and most of the perfumers' remarks are respected by the NLM: the minty-camphoraceous—piney- woody series is easily seen on the NLM but this is not the case on the PCA graph. The clustering of floral, honey and rose notes constitutes a central nucleus. On the contrary, in the PCA representation, acidic is inside a triangle constituted by these notes. This is contrary to the perfumers' experience. According
FATTY tCRSACCOUS CITRUS CAWHORACEOm I . PIICY VANILLIC COUHARIHIC
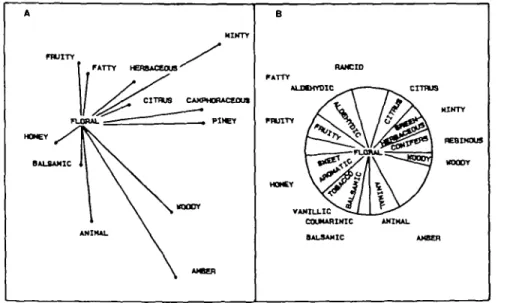
Fig. 3. Representation of the olfactory space centered on the note floral. (A) From our results. (B) Inside, from Haarman and Reimer. (C) Ouside, from Jaubert.
Analysis of odor description
to perfumers, acidic can be considered as the next element of the series fruity—ethereal, as represented on the NLM.
The only disagreement between perfumers and the NLM graph (Figure 2) is the
SIMILARITY 0.2 0.3 0.4 0.5 1 2 3 4 S e 7 8 10 -)a.= 1 1 0-\2 a0 9 O.IG 0.291 1 ° 'I i a29( i 0»0, • ^ 0.331 0.2II 1 aw ajii . i*H , . on, • — 0 ABI ACIDIC ETICPXAL FRUITY LACTONIC HOWY met gRECN FLORAL HEB1AC10U1 CITIUB HAY NIMTY CAHPHORACEOUS
if
!
MUSKY POWXRY AHDUL PHENOLIC •JLFURY CULINARY PYROaeNOUB ALMOHD • P I C T •ALSAMIC SALICYLATI ORANoe FLO«en VIOLETFig. 4. Dendrogram of the 32 olfactory notes obtained using mean aggregation techniques.
ORAHSC-FUMH
rTHEREAL PINEY CAHPHORACtOUS
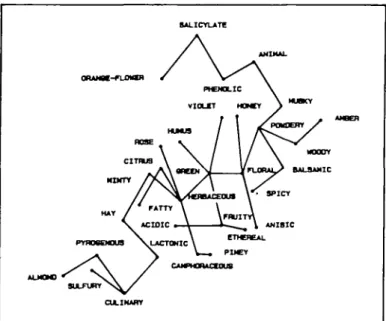
Fig. 5. Minimal spanning tree of the 32 olfactory notes obtained using the second nearest neighbor method.
M.Chastrette el al.
position of some notes of flowers such as orange-flower and violet which are a long way from the floral note. This could be explained by the fact that the floral note is not used to describe odors such as orange-flower and violet.
The NLM is more compatible with the perfumers' observations than the PCA. The differences between both methods could result from the differences in computation of distances. To test this hypothesis we performed a PCA using the same distance calculations as in NLM. We have found that the PCA does not give better results than previously.
We have observed that floral has a central position on the NLM. Haarman and Reimer (1979) using empirical results, and Jaubert et al. (1987) using PCA, have obtained circular graphs (perfumers' rosace) representing the olfactory space centered on the same floral note. In order to compare these graphs with our results we drew a graph based on NLM (Figure 3). We have noticed that the order of the notes in the three representations is the same, except for the minty — citrus inversion. These results are similar to a perfumers' rosace drawn a few years ago by Firmenich SA perfumers.
Ascending hierarchical taxonomy
Analysis of similarity matrix S by ascending hierarchical taxonomy (AHT) gives two dendrograms using two aggregation techniques (Elmouaffek, 1988). The graph (Figure 4) obtained by the mean aggregation techniques allows us to divide notes into ten groups comprising two to eight notes. Only the lactonic note is not included in a group. These groups are the following:
1. Acidic, ethereal, fruity
2. Herbaceous, citrus, fatty, humus, green, floral, rose, honey 3. Minty, hay
4. Camphoraceous, piney 5. Amber, woody
6. Phenolic, animal, musky, powdery 7. Culinary, sulfury, pyrogenous, almond 8. Balsamic, spicy
9. Orange-flower, salicylate 10. Violet, anisic
Figure 4 shows that these groups do not present a strong hierarchy and confirms the results obtained in a previous AHT (Chastrette et al., 1988; Elmouaffek, 1988), as well as PCA and NLM.
Minimal spanning tree
The minimal spanning tree (MST) has been drawn using the second nearest neighbor approach and starting from green as the central note because this note is linked to the three most frequently associated notes (floral, fruity and herbaceous). This choice has given the best legibility on the graph (Figure 5).
On this figure, the 14 distances between green and its five neighbors (violet, humus, fruity, floral, herbaceous) and the neighbors of these notes (honey, powdery, anisic, ethereal, acid, citrus, rose, minty, camphoraceous) are shown without deformation (i.e.
Analysis of odor description 14 notes from the 32 analyzed). However, the MST gives no information about the distances between green and the other 17 notes.
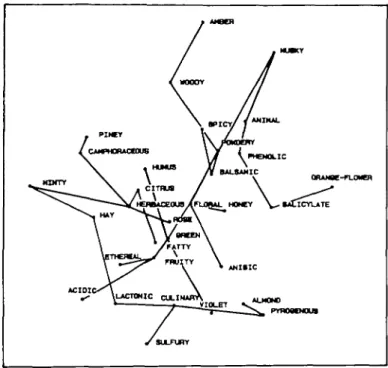
A combination of AHT, MST and NLM
The results obtained by the three methods are different but complete each other. The clustering of notes obtained by AHT, completes the NLM results as shown in Figure 6. A group of eight strongly associated notes is located in the middle of the graph. Around them are the more selectively associated notes such as camphoraceous — piney-amber or phenolic-animal-musky. The observed agreement between two fundamentally different methods increases the credibility of the results obtained by both methods. On the whole, our groups correspond to the perfumers' point of view. However, to be in exact agreement with them, the sulfury-culinary—almond — pyrogenous group should be separated in two, as suggested by the NLM. In the same way, perfumers would put the lactonic note in the fruity-ethereal group. On the contrary, the violet-anisic association is not satisfactory but can be explained by the low occurrence of the violet note (18) which is associated with anisic because of a co-occurrence of only 3. Here we are limited by the data bank size.
MST does not allow us to distribute notes into groups but, for each note, it describes its close neighborhood correctly. Figure 7 shows the MST drawn on the NLM graph. This superposition leads to a very consistent system which shows the privileged relationship between notes and groups of notes clustered using the AHT techniques. The fruity-ethereal-acidic group is linked to the tree by the green note. The three
Fig. 6. The 10 groups of olfactory notes obtained using ascending hierarchical taxonomy drawn on the
non-linear map.
M.Chastrette et al.
Fig. 7. Linkages of the minimal spanning tree drawn on the non-linear map.
amber-spicy-balsamic and musky-animal—phenolic-powdery groups are all linked to the same note floral. Minty-hay and camphoraceous-piney are linked to the tree by the herbaceous note. On the contrary, the anisic —violet group is not respected by the MST. This is consistent with the perfumers' remarks.
Conclusion
Among the four reported methods, PC A is obviously the least suitable for analyzing the relationships among descriptors of odors, due to the low percentage of total variance accounted for by the first axes. This is a consequence of the weak structure of the olfactory space in the Firmenich bank, previously observed in Arctander's description system. On the contrary, the three other methods are coherent and complete each other as shown in Figures 6 and 7 (except for local aberrations for the lactonic, violet and orange-flower notes).
NLM leads to results similar to those previously obtained by Jaubert et al. (1987), Haarman and Reimer (1979) and Chastrette et al. (1988) using other data and other methods.
The association of these three methods constitutes a convenient system for analysis of odor descriptions. A study of a much larger data bank is in progress to improve our results for the notes which have too small an occurrence in this bank.
Acknowledgements
We thank Firmenich SA for help during this work and financial support.
Analysis of odor description References
Arctander.S. (1969) Perfume and flavor chemicals. Montclair, NJ. Benzecri.J.P. (1980) L'anatyse des donnies. 1. la taxinomie. Dunod, Paris.
Chastrette.M., Elmouaffek.A. and Zakarya.D. (1986) Etude statistique multidimensionnelle des similarites entre 24 notes utilisees en parfumerie. C. R. Acad. Sci. Paris, 303, Se'rie II, 1209-1214.
Chastrette.M., Elmouaffek.A. and Sauvegrain.P. (1988) A statistical study of notes used in perfumery. Chem. Senses, 13, 295-305.
Dagnelie.P. (1984) Analyse statistique aplusieurs variables. Presses Agronomiques de Gembloux, Belgique. Elmouaffek.A. (1988) Etude statistique multidimensionnelle des proximites entre notes odorantes utilisees
en parfumerie. Lyon, These de doctorat, no. 56-88.L.
Gower,J.C. (1966) Some distance properties of latent root and vector methods used in multivariate analysis. Biomctrika, 53, 325-338.
Haarman and Reimer (1979) Le discodor. H et R Contact, 23, 19.
Iglesias.A. (1975) Contribution a l'analyse des tableaux de distances et de similarity. Application a la biologic Lyon, These de 3e cycle, no. 444.
Jaubert,J.N., Gordon,G. and Dore.J.C. (1987) Une organisation du champ des odeurs. Parf. Cosm. Ardm., 78, 7 1 - 8 1 .
Lamont.C.C. (1949) The measurement of interspecific association. Ecology, 30, 411-424.
Lee.R.C.T., Slagle.J.R. and Blum.H. (1977) A triangulation method for sequential mapping of points from N-space to two-space. IEEE Trans. Comput., A-25, 288-292.
Massart.D.L. and Kaufman,L. (1983) The interpretation of analytical chemical data by the use of cluster analysis. Wiley, New York.
Ochiai.A. (1957) Zoogeographic studies on the soleoid fishes found in Japan and its neighboring regions. Bull. Jap. Sci. Fish, 22, 526-530.
Randebrock.R.E. (1985) Geruch und Konstitution: Eine Beweisfuhrung fur die Molekulartheorie des Geruches. ParfUm. Kosmel., 66, 435-443.
Sammon J.V/. (1969) A non-linear mapping for data structure analysis. IEEE. Trans. Comput., c-18, 401 -409. Schiffman.S.S. (1974) Physicochemical correlates of olfactory quality. Science, 185, 112-117. Sokal.R.R. and Sneath.P. (1963) Principles of numerical taxonomy. Freeman, San Francisco. Wine,R.L. (1964) Statistics for scientists and engineers. Prentice-Hall, Englewood Cliffs, NJ. Received on June 27, 1990; accepted on October 29, 1990
![Tabk I. Similarity matrix S calculated using Ochiai's coefficient AMXBXO I.OD 0 . 0 ] 1.00 0.7J 0.03 I](https://thumb-eu.123doks.com/thumbv2/123doknet/14930134.664743/5.991.86.926.127.521/tabk-similarity-matrix-calculated-using-ochiai-coefficient-amxbxo.webp)