Effect of altered loading conditions during haemodialysis on left
ventricular filling pattern
J. SZTAJZEL*, P. RUEDINt, C. MONIN*, C. STOERMANNt, M . LESKlt, W. RUTISHAUSER* AND R. LERCH*
*Cardiology Center, University Hospital, Geneva; ^Division ofNephrology, University Hospital, Geneva
KEY WORDS: Doppler, left ventricular filling, preload, haemodialysis.
Changes in the circulating volume associated with haemodialysis result in modification of left ventricular loading conditions. To determine the influence of haemodialysis on Doppler indices of left ventricular filling, 12 patients (mean age 40-8 ±2-7 (SEM) years) with renal insufficiency but without overt heart disease were studied by Doppler-echocardiography immediately before and after haemodialysis. Haemodialysis resulted in a decrease in body weight from 680 +3-8 kg to 650 ±3-7 kg (P< 0-01). Heart rate and blood pressure did not change significantly during haemodialysis. Left ventricular diastolic dimension (M-mode) decreased from 53-5 ±11 mm to 49-5 ±1-9 mm (P < 005), whereas the shortening fraction did not change. Haemodialysis elicited marked changes in the early diastolic rapid filling wave (E wave) recorded by pulsed Doppler at the level of the mitral annulus. Peak velocity of the early rapid filling phase (peak E) decreased significantly from 95-3 ± 8-2 cm .s~' to 63-0 ±5-7 cm .s~' (P< 0001) and mid-diastolic deceleration of transmitral velocity decreased from 437-3 ±54-2 cm . s^2 to 239-7 ±54-4 cm . s~2 (P<001). The peak filling velocity during atrial contraction (peak A)
did not change (79-7 ±6-3 cm .s~' vs 74-1 + 4-7 cm .s~';P = NS). The ratio peak E/peak A decreasedfrom 1-19±006 to 0-85 ± 004 (P < 001) during haemodialysis. The results provide further evidence for the pronounced preload-dependence of Doppler indices of left ventricular diastolic function.
Introduction
Assessment of the rate of left ventricular filling by moni-toring blood velocity across the mitral valve has been proposed for the non-invasive detection of left ventricular diastolic dysfunction'1'21. In a variety of physiologically and clinically important conditions, slowing of left ven-tricular relaxation is associated with a reduction in both peak velocity and the deceleration slope of the early diastolic filling component (E wave). These conditions include ageing'341, myocardial ischaemia'51 and left ven-tricular hypertrophy'61. However, left ventricular filling is not exclusively dependent on diastolic properties of the left ventricle but may be influenced by a number of haemo-dynamic variables, including left atrial pressure'781, heart rate'91, and the atrioventricular conduction interval'101.
Several studies have investigated the effect of altered left atrial pressure on the transmitral flow velocity pattern in animal models. Ishida et a/.'71 observed in conscious dogs instrumented with a flowmeter sewn onto the mitral annulus that volume overload produced by saline infusion increased the early diastolic filling rate despite a concomi-tant augmentation of the time-consconcomi-tant of left ventricular relaxation. The increase in peak left ventricular filling rate correlated with the increase in left atrial pressure at the moment of mitral opening. In anaesthetized dogs, Courtois et a/.'"1 found a reduction of peak early left ventricular filling velocity measured by pulsed Doppler at the level of the mitral annulus, and slower acceleration and deceleration of blood flow during this phase after
Submitted for publication on 5 May 1992, and in revised form 5 November 1992.
Correspondence' Rene Lerch, MD, Cardiology Center, University Hospital,
CH-1211 Geneva, Switzerland.
reduction of left atrial pressure by balloon occlusion of the inferior vena cava.
Information on the effect of acute changes in left ven-tricular preload on the Doppler-derived left venven-tricular filling pattern in humans is less readily accessible. A reduction in peak early filling velocity has been observed in humans during lowering of left ventricular preload by Valsalva manoeuvre'121, head-up positioning'121 and infusion of nitroglycerin1'3141.
Because haemodialysis results in marked changes of circulating volume and left ventricular filling pressure, the present study was undertaken to examine the effect of haemodialysis on Doppler-derived left ventricular filling velocity.
Patients and methods
PATIENT POPULATION
The study group consisted of 12 patients (four women and eight men; aged 22 to 54 years, mean 40-8 ± 2-7 (SEM) years) treated by haemodialysis for 3 to 4 h three times per week for 3 to 176 months (mean 61 -3 ± 20-8 months). The inclusion criteria were: (1) age <55 years; (2) absence of history or clinical evidence of angina pectoris, congestive heart failure, myocardial infarction, valvular disease or cardiomyopathy; (3) normal 12-lead electrocardiogram (ECG); (4) absence of wall motion abnormality or valvular disease at Doppler-echocardiography.
All patients were treated for hypertension and all patients but one received recombinant human erythro-poeitin (Eprex, Cilag, Switzerland)'151. The underlying renal disease, duration of haemodialysis and antihyper-tensive treatment are summarized in Table 1. The study
Table I Clinical characteristics of study population Patients Age (years) Sex Diagnosis of underlying renal disease Dialysis duration (h) Antihypertensive therapy (mg.day ') 1. 2. 3. 4. 5. 6. 7. 8. 9. 10. II 12. 29 49 34 54 22 43 44 35 47 49 44 39 M F F M M F M M M M M F Chronic glomerulonephntis Interstitial nephritis Chronic glomerulonephritis Chronic glomerulonephritis Chronic glomerulonephritis Lupus nephritis Chronic glomerulonephritis Chronic glomerulonephritis Chronic glomerulonephritis Nephrosclerosis Nephrosclerosis Chronic pyelonephritis 3 0 3-5 3 0 3-5 3 0 3 0 3 0 3-5 3-5 3 0 3-5 4 0
atenolol 100/enalapril 10/minoxidil 30 atenolol 100
isradipine 5 atenolol 50
clonidineO-30/minoxidil 30 bopindolol 2/isradipine 5
atenolol 100/enalapril 10/nifedipine 30 propranolol 240/minoxidil 15 clonidine 0-45/minoxidil 7 5
bopindolol 2/enalapnl 10/minoxidil 30 propanolol 320/enalapril 10/nifedipine 60 bopindolol l/nitrendipine40
Peak E
E-slopc
Peak A
Time
Figure 1 Schematic representation of Doppler indices computed
from digitized mitral velocity tracings. Peak E: peak velocity during the early rapid filling component; peak A: peak velocity during atrial contraction; E-area ( 0 ) : time-velocity integral of the early diastolic filling phase; A-area (H): time-velocity integral during atrial contraction; E-slope: deceleration rate of the early rapid filling component.
protocol was approved by the Ethical Committee of the Geneva University Hospital and written informed consent was obtained from each patient before the study.
HAEMODIALYSIS
All patients underwent standard bicarbonate haemo-dialysis with a dialysate containing 30 mM of bicarbonate and 4 mM of acetate'16'. The mean duration of the dialysis sessions was 3-3 ±0-1 h. Arterial cuff blood pressure and heart rate were recorded in the supine position just before, every 15min during, and immediately after dialysis by an automatic recorder (Accutorr 2, Datascope Corp. Paramus, NJ, U.S.A.). Blood samples were withdrawn from the arterial side of the haemodialysis circuit immediately before and after each dialysis session for determination of pH, arterial blood gases, plasma electro-lytes, urea and creatinine. Ionized plasma calcium was measured by an electrode-specific radiometer (ICA 1
Ionized Calcium Analyzer, Radiometer, Copenhagen, Denmark)1'7'. Plasma acetate concentration was measured with an enzymatic assay (Boehringer, Mannheim, Germany)"81.
ECHOCARDIOGRAPHIC AND DOPPLER RECORDINGS
Patients underwent Doppler-echocardiography 30 min before beginning and again 30 min after termination of the haemodialysis session. The examination was performed with a Hewlett-Packard ultrasound system (model Sonos 1000, Andover, Massachussetts, U.S.A.) equipped with a 2-5 or 3-5 MHz wide-angle phased-array transducer for imaging and using 20 or 2-5 MHz for Doppler studies. Patients were examined in the left lateral recumbent position for the standard parasternal long axis and short axis views and in the dorsal supine position for the apical four-chamber view and the suprasternal view.
Two-dimensional echocardiograms were recorded on a 0-5 in videotape (Panasonic Video Recorder, model No. AG 7330 E-A, Matsushita Electric Ind Co Ltd, Japan). M-mode and Doppler tracings were recorded by a strip-chart recorder at a paper speed of 50 mm . s"' and
100 mm . s ', respectively.
End-systolic and end-diastolic left ventricular dimen-sions were measured on M-mode recordings'1920'. The left ventricular ejection fraction was determined by the single plane area-length method from digitized end-systolic and end-diastolic frames of the left ventricle obtained in the apical four chamber view'21-22'.
Cardiac output was calculated from the continuous-wave velocity-time integral of aortic flow, recorded from the suprasternal notch and the aortic valve opening area, estimated from the maximal cusp separation of the aortic valve in the parasternal long-axis or short-axis view, assuming circular geometry123'.
Transmitral flow velocity was monitored in the apical four-chamber view by pulsed-wave Doppler. The beam direction was aligned with the transmitral inflow as close as possible and a sample volume with an axial length of approximately 10 mm placed at the level of the mitral annulus. Pulsed Doppler velocity profiles were digitized
Table 2 Effects of haemodialysis on body weight, blood pressure and heart rate' Before haemodialysis After haemodialysis Body weight (kg) Blood pressure (mmHg) systolic diastolic
Heart rate (beats. mirr')
680 + 3-8 144 + 6 85 + 4 70-4 + 31 650±3-7 132 + 6 80 + 4 73-6 + 31 < 0-001 ns ns ns All values are mean + SEM
Table 3 Pre- and post-dialysis haematocrit and serum chemistry
Normal range Before After
haemodialysis haemodialysis Hematocrit (vol %) Sodium (mM I"1) Potassium (mM. 1"') Creatinine (mM . 1 ') Urea(mM 1"') Ionized calcium (mM . 1 ') Acetate (mM .1 ') (38-52)* (133-142)* (3-5-4-7)* (0-059-0-116)* (2-9-7-7)* (1 06-1 26)t (0-03-0-ll)t 30-2+1-1 1 4 0 + 1 0 5-3 + 0-3 1-10+ 0 0 6 31-2 + 5-0 1 08+ 0 0 3 0-25 + 0-10 34-1 + 1-2 139 + 0-1 3-8 + 0-1 0-45 ± 0 0 3 12-6 + 0-8 1-27 + 0-04 0-43 + 0-07 < 00001 ns < 0-001 < 00001 < 0-001 <001 < 0 0 5 All values are mean + SEM
•Reference values applied at the University Hospital Geneva; tSiggaard-Andersen O et a/.1"1; |Bergemeyer HU and Mollering H'181.
Table 4 Effects of haemodialysis on M-mode parameters, ejectionfraclion and aortic Doppler-derived cardiac output LVDD(mm) LVSD (mm) SWT (mm) Shortening fraction (%) Ejection fraction (%)
Cardiac output (1. min ')
Normal range (=£56)* (=£34)* (<11)* (>25)* (>55)t (>44)t Before haemodialysis 53-5+1-1 30-5+1-1 120 + 0-4 42-8+1-7 66-7 + 3-1 7-0 + 0-9 After haemodialysis 49-5+1-7 27-9+1-8 12-0 + 0-4 440 + 2-0 65-5 + 2-8 6-1+0-7 P < 0 0 5 < 0 0 5 ns ns ns < 0 0 5 All values are mean + SEM
LVDD = left ventricular end-diastolic dimension; LVSD = left ventricular end-systolic dimension; SWT = septal wall thickness.
•Feigenbaum H'20"; tKan G et a/.'2"; Jlhlen H et a/.'2"
by a graph pen system (model GP-8 Sonic Digitizer, Science Accessories Corporation, U.S.A.) for computer calculation of the following variables (Fig. 1): (1) peak early diastolic velocity (peak E); (2) deceleration rate of the early diastolic wave (E-slope); (3) peak late diastolic velocity (peak A); (4) time-velocity integral of the early diastolic filling phase (E-area); (5) time-velocity integral of the late diastolic filling phase (A-area); (6) the total area under the diastolic velocity profile (E-area + A-area).
The following three ratios were calculated: (1) peak E/ peak A; (2) E-area/A-area; (3) A-area/total area (atrial filling fraction). Values represent the mean of eight to 10 cycles.
STATISTICAL ANALYSIS
Results are expressed as mean + SEM. Statistical comparison between the data before and after haemo-dialysis were made by two-tailed paired Student's t-test. Differences were considered significant if P<005.
Results
BODY WEIGHT, ARTERIAL BLOOD PRESSURE AND HEART RATE (TABLE 2)
Haemodialysis resulted in a reduction in body weight by an average of 3-0 + 0-1 kg. Heart rate did not change significantly after haemodialysis. Although mean values
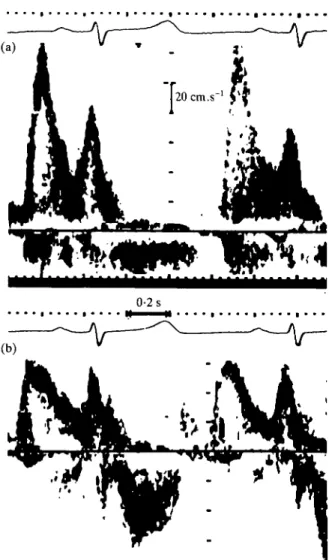
0-2 s
Figure 2 Mitral pulsed Doppler recording from a 39-year-old
woman with renal insufficiency before (a) and after (b) haemo-dialysis. After haemodialysis peak velocity of the early rapid filling component is markedly decreased and the deceleration rate of velocity reduced when compared to the tracing obtained before haemodialysis.
of blood pressure decreased slightly, the changes did not achieve statistical significance. There were no hypotensive episodes during haemodialysis.
ARTERIAL BLOOD VALUES (TABLE 3)
Haematocrit increased significantly after haemodialy-sis, indicating reduction of the circulating plasma volume. Serum concentrations of potassium, creatinine and urea decreased markedly after haemodialysis. Both ionized calcium and serum acetate concentration increased slightly after haemodialysis (/><0-01).
LEFT VENTRICULAR DIMENSION, EJECTION FRACTION AND CARDIAC OUTPUT (TABLE 4)
Left ventricular end-diastolic and end-systolic dimen-sions decreased significantly after haemodialysis, indi-cating a preload-induced reduction in cardiac volumes.
Neither the shortening fraction of the left ventricular diameter, obtained from M-mode tracings, nor the left ventricular ejection fraction, calculated from two-dimensional images, changed significantly. The average cardiac output decreased by 13% (P<005).
EFFECT OF HAEMODIALYSIS ON THE TRANSMITRAL VELOCITY PATTERN
Figure 2 shows representative pulsed-Doppler tracings of mitral velocity recorded in the same patient, before (a) and after (b) haemodialysis. There is a marked decrease in peak early velocity, whereas there is only a slight decrease in peak late diastolic velocity.
The changes in Doppler-derived indices during haemo-dialysis for all patients are summarized in Figs 3 to 5. The peak early velocity (peak E) decreased during haemo-dialysis in each case, with an average reduction from 95-3±8-2cm.s~' to 630 +5-7 cm . s"1 (i><0-01). The deceleration rate of the early diastolic filling phase also decreased significantly, from 437-3 ±54-2 cm . s~2 to 239-7 ±54-4 cm. s"2 (/><0-01). The average peak late velocities (peak A) remained unchanged after haemo-dialysis (79-7 + 6-3 cm . s"1 vs 74-1 +4-7 cm . s~'; P=ns). The time-velocity integral of transmitral velocity (total area) decreased significantly during haemodialysis from 250+ 1-7 cm to 19-7+1 -7 cm (P< 001) with a significant decrease in E-area, from 15-8 ± 1-2 cm to 11-9+1-4 cm (F<001). The slight decrease in A-area was statistically not significant (9-3 + 0-8cm vs 7-8 + 0-6cm; P = ns). Finally, the ratio peak E/peak A was significantly decreased after haemodialysis from 1-19 + 0-06 to 0-85 + 0-04 (/><001), whereas the ratios E-area/A-area (1-79 + 0-17 before haemodialysis vs 1-57 + 0-18 after haemodialysis; P=ns) and A-area/total area (0-37 + 002 before haemodialysis vs 0-41 +0-03 after haemodialysis;
P — ns) remained unchanged after haemodialysis.
Discussion
The observations in this study demonstrate that haemo-dialysis results in substantial modification of the trans-mitral velocity pattern in patients with renal failure. The most pronounced changes were observed during the early rapid diastolic filling component, the E-wave, with a sig-nificant reduction in peak velocity, slowing of mid-diastolic deceleration and reduction in velocity-time integral. The left ventricular filling component during atrial contraction, the A-wave, did not change signifi-cantly. Consequently, the ratio peak E/peak A decreased substantially during haemodialysis.
The transmitral velocity pattern may be influenced by a number of factors which include the rate of left ventricular relaxation'8-241, left atrial pressure7-8"-'3-241, heart rate'91, and the atrio-ventricular conduction interval'10'. Because heart rate and atrio-ventricular conduction did not change appreciably during haemodialysis, the delay of early diastolic filling observed after haemodialysis may essentially reflect two mechanisms: reduction in left atrial pressure or impairment of left ventricular relaxation.
Before After Haemodialysis Before After Haemodialysis Before After Haemodialysis
Figure 3 Peak velocity of the early rapid left ventricular filling phase (peak E), deceleration slope of the early rapid filling phase and
peak velocity of the filling phase during atrial contraction (peak A) before and after haemodialysis. Open circles denote mean values + SEM. **P<00\ compared to value before haemodialysis.
Before After Haemodialysis Before After Haemodialysis Before After Haemodialysis
Figure 4 Time-velocity integral of the early diastolic filling phase (E-area), the filling phase during atrial contraction (A-area)
and of the entire diastolic filling phase (total area) in patients before and after haemodialysis. Open circles denote mean values + SEM. **P<00\ compared to value before haemodialysis.
Before After Haemodialysis Before After Haemodialysis Before After Haemodialysis
Figure 5 Ratio of peak E/peak A velocity, E-area/A-area and A-area/total area before and after haemodialysis. Open circles
With respect to the first mechanism, ultrafiltration during haemodialysis results in a marked reduction in circulating blood volume with a concomitant reduction in left atrial pressure. Stiller et a/.'25' observed during ultrafil-tration of an average of 3 1 within 3 h, which is comparable to ultrafiltration in the present study, a reduction in plasma volume of 17%. Lowering of left atrial pressure during haemodialysis has been documented directly by Kinet et cilP6\ who observed a reduction in pulmonary capillary wedge pressure from an average of 12-5 mmHg to 31 mmHg.
With respect to the second mechanism, to our knowl-edge, no current evidence exists indicating that left ventricular diastolic properties are influenced by haemo-dialysis. Indices of overall left ventricular contractility have been found to remain unaltered1271 or rather to improve during haemodialysis128291. However, myocardial relaxation may undergo deterioration with unaltered systolic function by mechanisms including ischaemia1301 or increase in ionized calcium13'1. There were no clinical or electrocardiographic signs of ischaemia in the second Doppler study. Furthermore, observations in isolated muscle preparations suggest that the small increase in ionized serum calcium of 019 mM . 1 " ' observed during dialysis in the present study should not appreciably affect left ventricular relaxation1321. Thus, although impairment of left ventricular relaxation cannot be entirely excluded, available information on haemodynamic changes during haemodialysis suggests that the reduction in peak velocity and in the deceleration slope of the early diastolic filling component reflects reduction in left atrial pressure.
Although a decrease in the atrial filling component dur-ing lowerdur-ing of left atrial filldur-ing pressure by haemodialysis is expected, mean values of both peak A and A-area did not change significantly. Similarly, in a previous study, Choong et a/.1'31 observed, during nitroglycerin infusion, a reduction in peak E without modification of the A-wave. However, in the present study there was considerable inter-individual variation in the behaviour of the A-wave during haemodialysis, most likely reflecting the fact that the response of the atrial filling component to decreased left atrial filling may vary depending on factors includ-ing left ventricular stiffness and left atrial contractile function181.
After haemodialysis 9 of the 12 patients exhibited a ratio peak E/peak A ^ 1 which is considered to indicate abnormal left ventricular diastolic function in patients younger than 50 years. Two factors may have contributed to this abnormality. First, because haemodialysis may result in a lower left ventricular filling pressure than is observed in healthy individuals of comparable age, the normal range for peak E/peak A values may not be appli-cable to the situation after haemodialysis. Second, all patients had documented hypertension treated medically at the time of the study. Hypertension is known to result in a reduction in the peak E/peak A ratio by alteration of left ventricular diastolic properties'61. The increase in the peak E/peak A ratio to values > 1 during the interval between the haemodialysis sessions may, therefore, reflect 'pseudonormalization'1"1 of this index by the increase
in left atrial pressure associated with expansion of the circulating blood volume during fluid retention.
The main limitation of this study is the omission of left ventricular filling pressure and left ventricular relaxation measurements to directly validate the hypothesis that left atrial pressure plays a predominant role in the observed changes in the left ventricular filling pattern. However, cardiac catheterization without clinical indication was not felt justifiable in these patients. Finally, it needs to be emphasized that myocardial diastolic function in the patients in this study may have been compromised to a variable extent by factors including hypertension, silent coronary artery disease, uraemia and negative inotropic drugs. This may explain, in part, the inter-individual vari-ations in the changes in Doppler indices during haemodi-alysis. Therefore, the observed response of the transmitral flow velocity pattern to changes in the loading conditions cannot be directly extrapolated to the situation in normal individuals.
At least three clinical implications can be inferred based on the present study. First, the results of this study pro-vide further epro-vidence that there is a pronounced preload dependence in the transmitral flow-velocity pattern which advises caution in the interpretation of Doppler indices in terms of left ventricular diastolic function. Second, Doppler-echocardiographic studies in patients treated by haemodialysis should be performed at identical time intervals after the last haemodialysis session, because of the phasic changes in echocardiographic and Doppler measurements. Third, Doppler-echocardiography may prove useful for the assessment of the effects of different protocols of haemodialysis on left ventricular filling and ejection in patients with and without heart disease1341.
We are indebted to Mrs M. Boullie, BSc, for the biotechnical analyses. Dr P. Ruedin was a recipient of a grant from Cilag (Schaffhausen, Switzerland).
References
[1] Rokey R, Kuo LC, Zoghbi WA, Limacher MC, Quinones MA. Determination of parameters of left ventricular diastolic filling with pulsed Doppler echocardiography: Comparison with cineangiography Circulation 1985; 71: 543-50.
[2] Labovitz AJ, Pearson AC. Evaluation of left ventricular diastolic function: Clinical relevance and recent Doppler echocardiographic insights. Am Heart J 1987; 4: 836-51. [3] Miller TR, Grossman SJ, Schechtman KB, Biello DR,
Ludbrook PA, Ehsani AA. Left ventricular diastolic filling and its association with age. Am J Cardiol 1986; 58: 531-5. [4] Bryg RJ, Williams GA, Labovitz AJ. Effect of aging on left
ventricular diastolic filling in normal subjects. Am J Cardiol 987; 59:971-4.
[5] De Bruyne B, Lerch R, Meier B, Schlaepfer H, Gabathuler J, Rutishauser W. Doppler assessment of left ventricular diastolic filling during brief coronary occlusion. Am Heart J 1989; 117: 629-35.
[6] Douglas PS, Berko B, Lesh M, Reichek N. Alterations in diastolic function in response to progressive left ventricular hypertrophy. J Am Coll Cardiol 1989; 13:461-7.
[7] Ishida Y, Meisner JS, Tsujioka K el al. Left ventricular filling dynamics: Influence of left ventricular relaxation and left atrial pressure. Circulation 1986; 74: 187-96.
[8] Thomas JD, Weyman AE. Echocardiographic Doppler evaluation of left ventricular diastolic function. Phys Physiol Circulation 1991:84:977-90.
[9] Iliceto S, D'Ambrosio G, Marangelli V, Amico A, Di Biase M, Rizzon P. Echo-Doppler evaluation of the effects of heart rate increments on left atrial pump function in normal subjects. Eur Heart J 1991; 12: 345-51.
[10] Pearson AC, Janosik DL, Redd RR, Buckingham DA, Blum Rl, LabovitzAJ. Doppler echocardiographic assessment of the effect of varying atrioventricular delay and pacemaker mode on left ventricular filling. Am Heart J 1988; 115:611-21.
[11] Courtois M, Vered Z, Barzilai B, Ricciotti NA, Perez JE, Ludbrook PA. The transmitral pressure-flow velocity relation. Circulation 1988; 78:459-68.
[12] Downes TR, Nomeir A-M, Stewart K, Mumma M, Kerensky R, Little WC. Effect of alteration in loading conditions on both normal and abnormal patterns of left ventricular filling in healthy individuals. Am J Cardiol 1990; 65: 377-82.
[13] Choong CY, Herrmann HC, Weyman AE, Fifer MA. Preload dependence of Doppler-derived indexes of left ventricular dias-tolic function in humans. J Am Coll Cardiol 1987; 10: 800-8. [14] Stoddard MF, Pearson AC, Kern MJ, Ratcliff J, Mrosek DG,
Labovitz AJ. Influence of alteration in preload on the pattern of left ventricular diastolic filling assessed by Doppler echocardi-ography in humans. Circulation 1989; 79: 1226-36.
[15] Eschback JW, Egrie JC, Downing MR, Browne JK, Adamson JW. Correction of the anemia of end-stage renal disease with recombinant human erythropoietin: Results of a combined phase I and II clinical trial. N Engl J Med 1987; 316: 73-8. [16] Van Stone JC, Cook J. The effect of bicarbonate dialysate in
stable chronic hemodialysis patients. Dial Transpl 1979; 8' 703-9.
[17] Siggaard-Andersen O, Thode J, Wandrup J. The concentration of free-calcium ions in the blood plasma: "ionized calcium". In: Siggaard-Andersen O, ed. Blood, pH, carbon dioxide and calcium ion. Copenhagen: Radiometer, 1981; 163-90. [18] Bergmeyer HU, Mollering H. Acetate determination. In:
Bergmeyer HU, ed. Methods of enzymatic analysis. Vol. 3, 2nd edn. New York: Academic Press, Inc., 1974: 1520-8.
[19] Roelandt J, Gibson DG. Recommendations for standardiz-ation of measurements from M-mode echocardiograms. Eur Heart J 1980; 1- 375-8.
[20] Feigenbaum H. Echocardiography, 4th edn. Philadelphia: Lea and Febiger, 1986.
[21] Kan G, Visser CA. Lie KI, Durrer D et al. Left ventricular volumes and ejection fraction by single plane two-dimensional echocardiography. Eur Heart J 1981; 2: 337.
[22] Schnittger I, Fitzgerald PJ, Faughters GT el al. Limitations of comparing left ventricular volumes by two dimensional echo-cardiography, myocardial markers and cineangiography. Am J Cardiol 1982; 50: 512-9.
[23] Ihlen H, Amlie JP, Dale J et al. Determination of cardiac output by Doppler echocardiography. Br Heart J 1984; 51: 54-60. [24] Choong CY, Abascal VM, Thomas JT, Guerrero JL, McGlew
S, Weyman AE. Combined influence of left ventricular loading and relaxation on the transmitral flow velocity profile in dogs measured by Doppler echocardiography. Circulation 1988; 78: 672-83.
[25] Stiller S, Thommes A, Konigs F, Schallenberg U, Manix H. Characteristic profiles of circulating blood volume during dialysis therapy. Trans Am Soc Artif Intern Organs 1989; 35: 530-2.
[26] Kinet J-P, Soyeur D, Balland N, Saint-Remy H, Collignon P, Godon J-P. Hemodynamic study of hypotension during hemodialysis. Kidney Int 1982; 21: 868-76.
[27] Cohen MV, Diaz P, Scheuer J. Echocardiographic assessment of left ventricular function in patients with chronic uremia. Clin Nephrol 1979; 12: 156-62.
[28] Hung J, Harris PJ, Uren RF, Tiller DJ, Kelly DT. Uremic cardiomyopathy — effect of hemodialysis on left ventricular func-tion in end-stage renal failure. N Engl J Med 1980; 302: 547-51. [29] Nixon JV, Mitchell JH, McPhaul JJ, Henrich WL. Effect of hemodialysis on left ventricular function. Dissociation of changes in filling volume and contractile state. J Clin Invest
1983,71:377-84.
[30] Apstein CS, Grossmann W. Opposite initial effects of supply and demand ischemia on left ventricular diastolic compliance: The ischemia-diastolic paradox. J Mol Cell Cardiol 1987; 19: 119-28.
[31] Henrich WL, Hunt JM, Nixan JV. Increased ionized calcium. N Engl J Med 1984; 310: 19-23.
[32] Gwathmey JK, Morgan JP. Altered calcium handling in exper-imental pressure-overload hypertrophy in the ferret. Circ Res 1985; 57: 836-43.
[33] Feigenbaum H. Echocardiographic evaluation of left ventricu-lar diastolic function. J Am Coll Cardiol 1989, 13: 1027-9. [34] Sztajzel J, Ruedin P, Monin C et al. Effects de l'hemodialyse
a l'acetate (HDA), bicarbonate (HDB) et biofiltration sans acetate (BFSA) sur la fonction du ventricule gauche en hemodialyse chronique (abstract). Schweiz Med Wschr 1992; 122 (Suppl 46/1): 11.