Relation of BMI to a dual-energy X-ray absorptiometry measure of fatness
Alfredo Morabia
1*, Alan Ross
2, Franc¸ois Curtin
1, Claude Pichard
3and Daniel O. Slosman
41
Division of Clinical Epidemiology,3Division of Nutrition and
4Division of Nuclear Medicine of the University Hospital of Geneva, Switzerland
2Department of Biostatistics, The Johns Hopkins School of Hygiene and Public Health, Baltimore, MD, USA
(Received 7 July 1997 – Revised 17 December 1998 – Accepted 23 February 1999)
Dual-energy X-ray absorptiometry (DXA) is a valid technique for measuring the fat, bone and lean (muscle, organs and water) masses of the body. We evaluated relationships of BMI (kg/m2) with independent measurements of fat and lean masses using DXA in 226 adult volunteers. The evaluation was an application of a general approach to compositional data which has not previously been used for describing body composition. Using traditional regression analyses, when lean mass was held constant, BMI varied with fat mass (men r 0⋅75, P, 0⋅05 ; women r 0⋅85, P, 0⋅05); when fat mass was held constant, BMI varied with lean mass (men r 0⋅63, P, 0⋅05 ; women r 0⋅47, P, 0⋅05). In contrast, a regression model for compositional data revealed that BMI was: (a) strongly associated with log fat mass in both sexes (b14⋅86, P,
0⋅001 for all women and b1 5⋅96, P, 0⋅001 for all men); (b) not associated with bone mass,
except in older men; (c) related to lean mass in women but not in men (b3−4⋅04, P, 0⋅001
for all women and b1−2⋅59, P, 0⋅15 for all men). Women with higher BMI tended to have more
fat mass and more lean mass than women with lower BMI. Men with higher BMI had more fat mass but similar lean mass to men with lower BMI. Investigators need to be alert to the inaccuracy of BMI to assign a fatness risk factor to individuals, especially among women.
Body composition: BMI: Dual-energy X-ray absorptiometry
Weight-for-height ratios (e.g. weight/height2=BMI) are often used in clinical and epidemiological studies as surro-gate measures of fatness (Keys et al. 1972; Garrow & Webster, 1985; Wellens et al. 1996), either because only weight and height are measured or because the study design requires recalled information of past weight and height. Bioelectrical impedance analysis (BIA) is now being used increasingly in epidemiological and clinical studies to determine the respective contributions of fat and lean tissues to overall body mass. BIA measures electrical character-istics of the human body and then extrapolates to the fat and lean masses using formulas that assume a constant hydration level (73 %) of the lean mass (Chumlea et al. 1996; Hendel et al. 1996; Kushner et al. 1996; De Lorenzo et al. 1997; Jensen et al. 1997). The accuracy of BIA formulas has been questioned (Pichard et al. 1997) and they are thought to underestimate obesity (Piccoli et al. 1998).
The advantage of methods such as dual-photon absorp-tiometry (DPA) and dual-energy X-ray absorpabsorp-tiometry (DXA) over BIA is that they yield direct measurements of lean mass (including soft tissues) and bone mass in each pixel of body surface (Slosman et al. 1992). Fat mass can then be derived from these two measures. Therefore, these
methods offer a new opportunity to evaluate the validity of BMI as a proxy measure of fatness. Previous studies that have compared BMI with fat mass or percentage fat meas-ured using DXA or DPA have all found strong statistical correlations between these variables (Wang et al. 1994; Hannan et al. 1995; Gallagher et al. 1996; Goran et al. 1996; Goulding et al. 1996; Gutin et al. 1996; Daniels et al. 1997; Abbasi et al. 1998; Pietrobelli et al. 1998). However, these analyses have not taken into consideration the information on lean and bone masses even though these measures were also provided by DXA or DPA. Because the human body is composed mostly of fat and lean tissues (muscle, organs, connective tissues and water), a strong correlation of BMI with fat mass does not rule out an equally strong correlation with lean mass. For instance, an athlete with a very large muscle mass and an obese person can both have high BMI values.
The aim of the present study was to evaluate the validity of BMI in terms of a measure of fatness obtained by DXA, adjusted for lean mass and bone mass. The evaluation was an application of a general approach to compositional data which has not previously been used for describing body composition.
Abbreviations: BIA, bioelectrical impedance analysis; DPA, dual-photon absorptiometry; DXA, dual-energy X-ray absorptiometry. * Corresponding author: Dr Alfredo Morabia, fax:+41 22 372 9565, email [email protected]
Materials and methods
From September 1990 to July 1991, we enrolled 153 female and seventy-three male Caucasians, aged 15–86 years, in Geneva, Switzerland. These were either healthy volunteers without risk factors for osteoporosis or chronic diseases recruited among the hospital employees, or patients admitted for acquired immunodeficiency syndrome, osteoporosis or other conditions which may lead to DXA examination. Thus, subjects represented a wide range of body mass compositions and ages (Table 1). Height (m;6 5 mm) and weight (kg;6 100 g) were measured, using a medical gauge and scales, on subjects without shoes or outer clothing.
Bone, fat and lean masses were determined by DXA. All DXA measurements were conducted by two trained opera-tors. Inter-observer agreement was not checked. The tech-nique combined a total body scanner (model QDR-1000/W; Hologic Inc., Waltham, MA, USA) using software version v-5.35, an X-ray source, an internal wheel to calibrate the bone mineral component and an external lucite–aluminium phantom to calibrate the fat compartment. Subjects lay in dorsal decubitus on the scan table for 12–18 min, a longer time being needed for larger subjects. According to the manufacturer, the radiation dose was small, that is, 0⋅1 mSv. DXA determines body composition by measuring the attenuation of an X-ray beam for every pixel of the entire body surface scanned from head to toe.
Technical aspects of DXA have been described in detail elsewhere (Heymsfield et al. 1989; Mazess & Barden, 1989; Slosman et al. 1992; Svendsen et al. 1993). In short, an X-ray generator emits a beam with a lower and a higher intensity (70 and 140 kVp). This beam is attenuated as it passes through the body, the degree of attenuation being relative to the body components absorbing the beam. Attenuated beams are detected for every pixel of the entire scan. DXA systems solve for two components in each pixel, fat+lean or soft tissue+bone minerals. This is the first step in a complex development measurement approach (Mazess et al. 1990; Pietrobelli et al. 1996a). The non-bone mass is subsequently divided into its fat and lean compo-nents on the basis of the absorption coefficient of fat derived from the lucite–aluminium phantoms. Integration over all pixels yields bone, fat and lean masses (g) for the total body.
The sum of bone, fat and lean masses equals total body mass (Slosman et al. 1992).
Bone mass is calcium hydroxyapatite, that is, largely Ca and P. Fat mass is triacylglycerol. Lean mass comprises what is neither bone mineral nor triacylglycerol, that is, total body water, organs, muscle, connective tissues, fat cell walls, osteoid water and organic components of the skeleton (Haarbo et al. 1991). Lean mass assessed with DXA is highly correlated with lean mass derived from total body K (Slosman et al. 1992). DXA measurements of bone, lean and fat masses are reproducible: CV range from 1⋅1 to 2 % according to body compartment (Slosman et al. 1992). Measures of precision of the various DXA body com-position estimates were similar to those given in a previous report (Slosman et al. 1992).
Scales weight, which was used for BMI, was recorded to 0⋅1 kg. It varied slightly from total mass given by DXA: the standard error of the estimate of the DXA weight by scales weight was 0⋅760 kg. The study received the approval of the Ethical Committee of the Department of Medicine.
Statistical analysis
Compositional data analysis. Problems of analysis and interpretation of body composition data stem from the truism that weight (or total body mass) is the sum of fat, bone and lean masses:
fat mass1 bone mass 1 lean mass 5 weight: Dividing this expression by weight gives the unit-sum constraint on the proportions (denoted by capital letters) of fat, bone and lean:
FAT1 BONE 1 LEAN 5 1⋅0:
Warnings about difficult analyses and spurious correlations of variables subject to the unit-sum constraint date from an 1897 paper by Karl Pearson (Pearson, 1897). According to Aitchison (1986): ‘... right up to the present day, there has been no other form of data analysis where more confusion has reigned and where more improper and inadequate statistical methods have been applied’.
One consequence of the unit-sum constraint is a negative bias afflicting the covariance-correlation structure of body
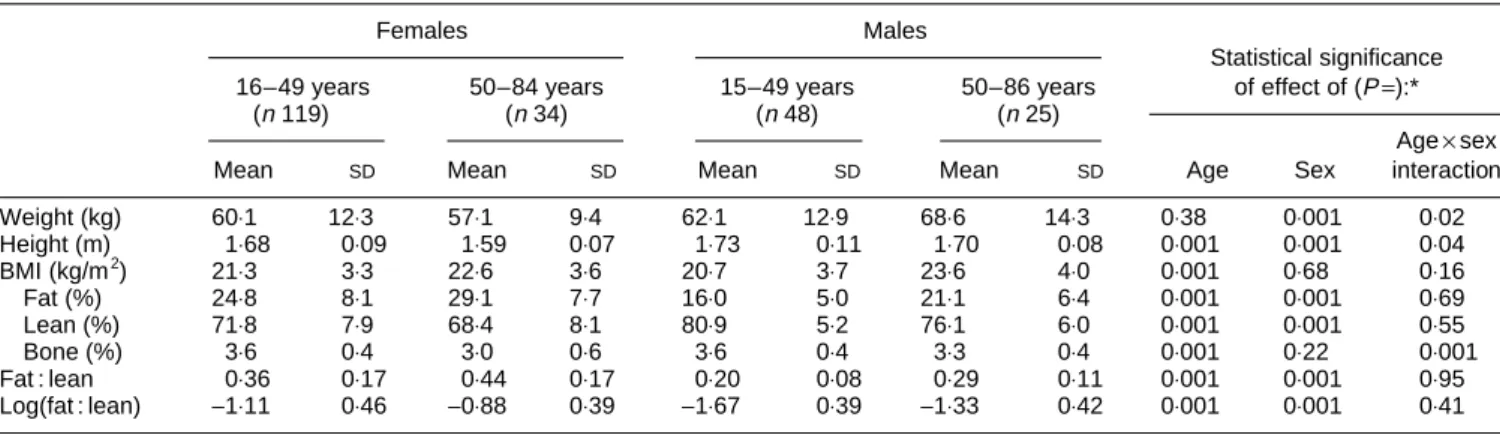
Table 1. Description of the study population
(Mean values and standard deviations)
Females Males
Statistical significance 16–49 years 50–84 years 15–49 years 50–86 years of effect of (P=):*
(n119) (n34) (n48) (n25)
Age×sex
Mean SD Mean SD Mean SD Mean SD Age Sex interaction
Weight (kg) 60⋅1 12⋅3 57⋅1 9⋅4 62⋅1 12⋅9 68⋅6 14⋅3 0⋅38 0⋅001 0⋅02 Height (m) 1⋅68 0⋅09 1⋅59 0⋅07 1⋅73 0⋅11 1⋅70 0⋅08 0⋅001 0⋅001 0⋅04 BMI (kg/m2) 21⋅3 3⋅3 22⋅6 3⋅6 20⋅7 3⋅7 23⋅6 4⋅0 0⋅001 0⋅68 0⋅16 Fat (%) 24⋅8 8⋅1 29⋅1 7⋅7 16⋅0 5⋅0 21⋅1 6⋅4 0⋅001 0⋅001 0⋅69 Lean (%) 71⋅8 7⋅9 68⋅4 8⋅1 80⋅9 5⋅2 76⋅1 6⋅0 0⋅001 0⋅001 0⋅55 Bone (%) 3⋅6 0⋅4 3⋅0 0⋅6 3⋅6 0⋅4 3⋅3 0⋅4 0⋅001 0⋅22 0⋅001 Fat : lean 0⋅36 0⋅17 0⋅44 0⋅17 0⋅20 0⋅08 0⋅29 0⋅11 0⋅001 0⋅001 0⋅95 Log(fat : lean) −1⋅11 0⋅46 −0⋅88 0⋅39 −1⋅67 0⋅39 −1⋅33 0⋅42 0⋅001 0⋅001 0⋅41 * Two-way ANOVA.
composition data. Correlations of the proportions FAT with LEAN, FAT with BONE or LEAN with BONE are not free to realize all values in the interval (−1⋅0,+1⋅0): at least two of the correlations must be negative. This is an artifact of the unit-sum constraint; it is not a reflection of the biology of body composition. The bias may cause usual regression and correlation analyses involving FAT, BONE and LEAN to give: ‘inadequate or irrelevant analysis with a doubtful or distorted inference’ (Aitchison, 1986).
A general solution to this problem has been proposed by Aitchison (1986) in which a key element is, in this example, the transformation of the three component masses (lean, fat and bone) to the two log ratios:
f5 logðfat : leanÞ; and
b5 logðbone : leanÞ:
Aitchison’s (1986) approach enables valid analyses of compositions. Expressing the three body composition masses (or proportions) in terms of two log ratios preserves all of the information in the composition, and it reduces three constrained variables to two that are not compelled structurally to be dependent.
The regression model is:
BMI5 a 1 b1 log fat : lean
1 b2 log bone : lean1 g age: (1) Equation (1) can be re-expressed as:
BMI5 a 1 b1 log fat1 b2 log bone 2 ðb11 b2Þ log lean1 g age:
Thus, the coefficient for log lean mass is−(b1+b2) and the variance (var) of the sum of the coefficient (b1+b2) is: var b1+var b2+2×covariance (b1,b2).
Our choice of lean as a divisor, rather than using, say, log(fat : bone) and log(lean : bone), does not influence conclu-sions drawn from the analyses presented here (Aitchison, 1986) since an equation equivalent to (1) would also be obtained. The choice was made because the ratio fat : lean, and its natural logarithm (f), directly express the notion of fatness. Body composition is then represented by the two unconstrained log ratios, f and b, rather than by the three structurally dependent proportions, FAT, BONE and LEAN. Variable definition. The three body mass compartments (fat mass, bone mass, lean mass) were transformed to the two log ratios f=log(fat mass : lean mass) and b = log(bone mass : lean mass) (Aitchison, 1986). Analyses were stratified by sex and by age category: 15–49 years, and 50–86 years. The cut-off of 50 years was chosen because it is the age at which the distribution of BMI increases by about 1 kg/m2 in the female population of Geneva (Morabia et al. 1997). In contrast, at a population level, male BMI varies only modestly between the ages of 35 and 75 years (Morabia et al. 1997).
The results are given as means, standard deviations, and a box plot diagram. To describe the relationship of BMI to body composition and to fatness in particular, we employed ANOVA, multiple regression and partial correlation methods. Within age category, age was adjusted for as a continuous variable.
Results
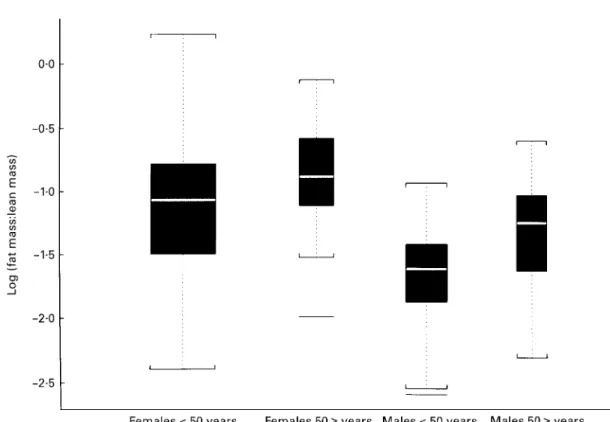
The 226 subjects were not ‘representative’ of any particular broader population. Table 1 displays mean values and standard deviations of variables measured in this study. BMI increased with age (P=0⋅001) but was, on average, not different between males and females (P=0⋅68). Women had a greater percentage fat mass and smaller percentage lean mass than males, but the increases in percentage fat mass and decreases in percentage lean mass with age were similar for both sexes (age×sex interaction P=0⋅69 for % fat and 0⋅55 for % lean). Percentage bone mass decreased with age in both sexes (P=0⋅001), more so in females than in males (age×sex interaction P=0⋅001). The fat : lean ratio was larger in men (sex P=0⋅001), and similarly increased with age (age P=0⋅001) in both sexes (age×sex interaction P= 0⋅95). The distributions of the log(fat : lean) ratios in Fig. 1 are consistent with what one would expect in a general popula-tion: older persons and females tend to have more body fat than younger persons and males.
Table 2 shows the correlation structure of BMI with fat mass and lean mass when other variables were held con-stant. All partial correlation coefficients (r) were statisti-cally significant. As desired if BMI is used as a proxy for fatness, BMI and fat mass were highly correlated for constant lean mass (r 0⋅85 for all females; r 0⋅77 for all males). However, BMI and lean mass were also positively correlated for constant fat mass, but to a lesser degree (r 0⋅47 for all females; r 0⋅63 for all males). As expected, BMI was strongly correlated with total mass, that is, with weight, for constant age (last column of Table 2).
Table 3 presents the correlation structure of BMI with the two log ratios f = log(fat mass : lean mass) and b = log(bone mass : lean mass). BMI was positively correlated with f, the fatness aspect of body composition, in all age and sex categories. The relationship of BMI and f was system-atically stronger in women than men (r 0⋅59 for all females; r 0⋅54 for all males). Except for older men, BMI was essentially uncorrelated with the bone component of body composition (r−0⋅07 for all women; r−0⋅03 for all men). Among men , 50 years, BMI depended in part on age for body composition held constant (r 0⋅36). At best, body composition and age explained (in the sense of multiple regression) between one-third and two-thirds of the varia-tion in BMI (R2varied between 0⋅35 and 0⋅67).
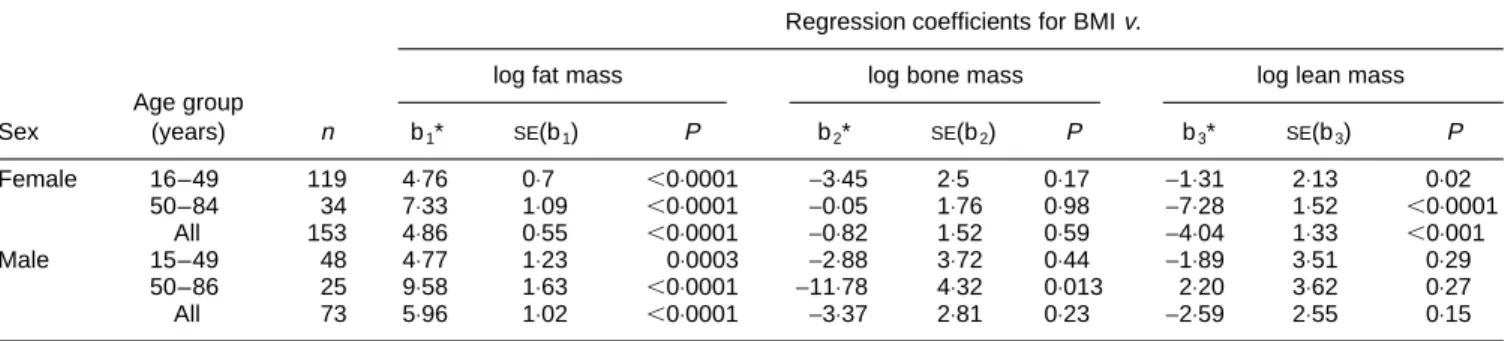
Table 4 presents the regression coefficients for the three body compartments. BMI was strongly associated with log fat mass in both sexes (b14⋅86, P, 0⋅001 for all women and b15⋅96, P, 0⋅001 for all men). BMI was not associated with bone mass, except in older men for whom there was a strong negative association (P=0⋅013). However, this age-and-sex category had a small sample size. Finally, BMI was related to lean mass in women but not in men (b3 −4⋅04,
P, 0⋅001 for all women and b1−2⋅59, P, 0⋅15 for all men).
Discussion
In the present study, separate correlations of BMI with either percentage fat mass or percentage lean mass showed that BMI was strongly related to fat mass but also
Fig. 1. Box-plot of log(fat mass : lean mass) by sex and age. The upper and lower edges of the box are at the 25th and the 75th percentiles of the
number of points in the data respectively. The middle line is the median. The whiskers extend to data values outside the box and within 1⋅5 times the spread between the top and the bottom of the box. Data (—) beyond box edges61⋅5 spread are outliers.
Table 2. Partial correlations (r) of BMI with fat, lean and total masses determined by dual-energy X-ray absorptiometry in male and female subjects of different ages
Partial correlation (r) of BMI with:
Sex Age (years) n Fat mass† Lean mass‡ Total mass§
Female 16–49 119 0⋅81* 0⋅44* 0⋅81* 50–84 34 0⋅93* 0⋅43* 0⋅85* All 153 0⋅85* 0⋅47* 0⋅81* Male 15–49 48 0⋅76* 0⋅63* 0⋅78* 50–86 25 0⋅83* 0⋅75* 0⋅90* All 73 0⋅77* 0⋅63* 0⋅84*
*P,0⋅05 for hypothesis thatr=0.
† Holding lean mass, bone mass and age constant. ‡ Holding fat mass, bone mass and age constant. § Holding age constant.
Table 3. Partial correlations (r) and multiple correlation (R2) of BMI with relative fatness (f†), relative boniness (b‡) (both determined from dual-energy X-ray absorptiometry analysis) and age
Age group
Sex (years) n rBMI f§ rBMI bk rBMI age¶ R2††
Female 16–49 119 0⋅54* −0⋅13 −0⋅01 0⋅35* 50–84 34 0⋅78* −0⋅06 0⋅04 0⋅67* All 153 0⋅59* −0⋅07 0⋅01 0⋅41* Male 15–49 48 0⋅50* −0⋅12 0⋅36* 0⋅40* 50–86 25 0⋅65* −0⋅10 −0⋅03 0⋅45* All 73 0⋅54* −0⋅03 0⋅19 0⋅44* *P,0⋅05 for hypothesis thatr=0 orR2
=0. † f=log(fat mass : lean mass).
‡ b=log(bone mass : lean mass). § Holding b and age constant.
kHolding f and age constant.
¶ Holding f and b constant
to lean mass in both sexes. These findings are consistent with those from studies that have compared BMI with a DXA measure of body fat (Wang et al. 1994; Hannan et al. 1995; Goran et al. 1996; Goulding et al. 1996; Gutin et al. 1996; Pietrobelli et al. 1996b, 1998; Abbasi et al. 1998; Taylor et al. 1998). For example, Abbasi et al. (1998) reported Pearson correlation coefficients (r) of 0⋅87 and 0⋅83 respectively, in a sample of 118 women and 144 men aged 60–80 years. However, it is well known that a correlation coefficient is not necessarily a measure of agreement between two methods: two variables can be highly correlated but this does not mean that the intercept is constant and the slope is equal to 1. This is illustrated by the report of Daniels et al. (1997) who found that for an equivalent BMI, DXA-measured percentage body fat was greater in girls than in boys, in whites than in blacks, and among those with central obesity than among those with peripheral obesity. Gallagher et al. (1996) also observed a dependence on age and sex (but not on ethnicity) when BMI was used as an indicator of total body fat calculated from DPA and tritium dilution.
Studies that have gone beyond simple correlation analysis have reached contrasting conclusions with respect to the validity of BMI as a proxy for body fat (Wang et al. 1994; Hannan et al. 1995). Goran et al. (1996) evaluated the accuracy of BMI for the assessment of body fat in forty-nine boys and forty-nine girls. Percentage body fat measured by DXA was correlated with BMI (r20⋅45) but proposed anthropometric equations predicting DXA-fat mass included body weight but not BMI. Wang et al. (1994) demonstrated that BMI was not a good indicator of percen-tage fat measured by DPA in 445 white and 242 Asian adults aged 18–94 years. Although Asians had lower BMI, they were fatter than whites of both sexes. Hannan et al. (1995) showed in 233 adolescent schoolgirls and 179 adult women that, when taking the 95 % CI on the prediction, a BMI of 20 kg/m2could correspond to a range of 18–33 % body fat in adolescents and 13–32 % in adults. In attempting to assess the validity of BMI, Taylor et al. (1998) found that the 75th percentile for BMI had a sensitivity of 83 % and a specificity of 94 % compared with the 75th percentile of either total body fat in kg or percentage fat measured by DXA. However, the relationship of BMI to fat measured by DXA may vary according to the leanness of the subjects (Curtin et al. 1997). In the paper by Wang et al. (1994), the
correlations between percentage fat and BMI varied by sex and race, but their discordance was stronger in leaner subjects.
Compared with previous validation studies of BMI, the present study went further in assessing the relationship of BMI to fat mass while controlling for the importance of the two other compartments, bone mass and lean mass. We expressed fatness as the ratio fat mass : lean mass. This ratio can be measured exactly using DXA. This DXA-based definition of fatness satisfies necessary conditions for a standard to evaluate obesity in adults: (1) the ratio is a natural expression of fatness: obese persons are those who have an excess of fat mass relative to their lean mass; (2) its distributions on the log scale are roughly symmetrical with comparable spread in four sex–age groups and reveal clearly the associations of fatness that one would expect (Fig. 1); (3) it allows a statistically sound analysis of the relationship of BMI with fatness controlling for lean and bone masses.
The regression analysis revealed very different associa-tions of BMI with fat, bone and lean masses in men and women (see Table 4). BMI appears to be a more specific indicator of body fatness in men than in women. Women with higher BMI tended to have higher fat mass but also higher lean mass compared with women with lower BMI. In contrast, men with higher BMI had more fat mass than, but similar lean mass to, men with lower BMI. This result could not be expected when we only performed separate regres-sions or correlations of BMI with fat, bone or lean mass. Even though the partial correlations were stronger for fat than for lean mass in both sexes, they were all positive and statistically significant.
It is important to note that it is not always possible to replace BMI with more accurate measurements of fatness independently of issues such as cost and complexity. For example, BIA is an alternative to DXA that is simple, relatively rapid, applicable to large epidemiological studies and more valid than BMI (Lukaski, 1987; Roubenoff et al. 1995; Kushner et al. 1996; De Lorenzo et al. 1997). Epidemiological studies have also used anthropometric measures of body composition such as skinfold thickness (Bishop et al. 1981; Gillum et al. 1998). Since these measures usually assess current fatness, they are adequate for surveys, prospective studies or nested case–control studies in which fatness is measured before disease occurrence, but these methods are not optimal in traditional case–control studies
Table 4. Regression coefficients for BMIv. log fat mass, log bone mass and log lean mass (from dual-energy X-ray absorptiometry analysis) using compositional data analysis
Regression coefficients for BMIv.
log fat mass log bone mass log lean mass
Age group Sex (years) n b1* SE(b1) P b2* SE(b2) P b3* SE(b3) P Female 16–49 119 4⋅76 0⋅7 ,0⋅0001 −3⋅45 2⋅5 0⋅17 −1⋅31 2⋅13 0⋅02 50–84 34 7⋅33 1⋅09 ,0⋅0001 −0⋅05 1⋅76 0⋅98 −7⋅28 1⋅52 ,0⋅0001 All 153 4⋅86 0⋅55 ,0⋅0001 −0⋅82 1⋅52 0⋅59 −4⋅04 1⋅33 ,0⋅001 Male 15–49 48 4⋅77 1⋅23 0⋅0003 −2⋅88 3⋅72 0⋅44 −1⋅89 3⋅51 0⋅29 50–86 25 9⋅58 1⋅63 ,0⋅0001 −11⋅78 4⋅32 0⋅013 2⋅20 3⋅62 0⋅27 All 73 5⋅96 1⋅02 ,0⋅0001 −3⋅37 2⋅81 0⋅23 −2⋅59 2⋅55 0⋅15 * b1and b2are derived from the equation: BMI=a+b1log fat+b2log bone+b3log lean, where a is the intercept and b3= −(b1+b2).
when past measures of fatness are needed, since subjects are examined for the first time after diagnosis and their fatness may have changed as a consequence of the pathological process.
As BMI will remain an index widely used in epidemio-logical studies, investigators need to be alert to the inaccu-racy of BMI in assigning a fatness risk factor to individuals, especially women.
References
Abbasi AA, Mattson DE, Duthie EH Jr, Wilson C, Sheldahl L, Sasse E & Rudman IW (1998) Predictors of lean body mass and total adipose mass in community-dwelling elderly men and women. American Journal of Medical Science 315, 188–193. Aitchison J (1986) The Statistical Analysis of Compositional Data.
New York, NY: Chapman & Hall.
Bishop CW, Bowen PE & Ritchey SJ (1981) Norms for nutritional assessment of American adults by upper arm anthropometry. American Journal of Clinical Nutrition 34, 2530–2539. Chumlea WC, Guo SS, Cockram DB & Siervogel RM (1996)
Mechanical and physiologic modifiers and bioelectrical impe-dance spectrum determinants of body composition. American Journal of Clinical Nutrition 64, 413S–422S.
Curtin F, Morabia A, Pichard C & Slosman DO (1997) Body mass index compared to dual-energy x-ray absorptiometry: evidence for a spectrum bias. Journal of Clinical Epidemiology 50, 837–843.
Daniels SR, Khoury PR & Morrison JA (1997) The utility of body mass index as a measure of body fatness in children and adoles-cents: differences by race and gender. Pediatrics 99, 804–807. De Lorenzo A, Andreoli A, Matthie J & Withers P (1997)
Predicting body cell mass with bioimpedance by using theoretical methods: a technological review. Journal of Applied Physiology 82, 1542–1558.
Gallagher D, Visser M, Sepulveda D, Pierson RN, Harris T & Heymsfield SB (1996) How useful is body mass index for comparison of body fatness across age, sex, and ethnic groups? American Journal of Epidemiology 143, 228–239. Garrow JS & Webster J (1985) Quetelet’s index (w/h2) as a
measure of fatness. International Journal of Obesity 9, 147–153. Gillum RF, Mussolino ME & Madans JH (1998) Body fat distribution and hypertension incidence in women and men. The NHANES I epidemiologic follow-up study. International Journal of Obesity and Related Metabolic Disorders 22, 127–134.
Goran MI, Driscoll P, Johnson R, Nagy TR & Hunter G (1996) Cross-calibration of body-composition techniques against dual-energy x-ray absorptiometry in young children. American Journal of Clinical Nutrition 63, 299–305.
Goulding A, Gold E, Cannan R, Taylor RW, Williams S & Lewis-Barned NJ (1996) DEXA supports the use of BMI as a measure of fatness in young girls. International Journal of Obesity and Related Metabolic Disorders 20, 1014–1021.
Gutin B, Litaker M, Islam S, Manos T, Smith C & Treiber F (1996) Body-composition measurement in 9–11-y-old children by dual-energy x-ray absorptiometry, skinfold-thickness measurements, and bioimpedance analysis. American Journal of Clinical Nutri-tion 63, 287–292.
Haarbo J, Gotfredsen A, Hassager C & Christiansen C (1991) Validation of body composition by dual energy x-ray absorptio-metry (DEXA). Clinical Physiology 11, 331–341.
Hannan WJ, Wrate RM, Cowen SJ & Freeman CP (1995) Body mass index as an estimate of body fat. International Journal of Eating Disorders 18, 91–97.
Hendel HW, Gotfredsen A, Hojgaard L, Andersen T & Hilsted J (1996) Change in fat-free mass assessed by bioelectrical impe-dance, total body potassium and dual energy x-ray absorptio-metry during prolonged weight loss. Scandinavian Journal of Clinical and Laboratory Investigation 56, 671–679.
Heymsfield SB, Wang J, Heshka S, Kehayias JJ & Pierson RN (1989) Dual-photon absorptiometry: comparison of bone mineral and soft tissue mass measurements in vivo with established methods. American Journal of Clinical Nutrition 49, 1283–1289. Jensen MB, Hermann AP, Hessov I & Mosekilde L (1997) Components of variance when assessing the reproducibility of body composition measurements using bio-impedance and the Hologic QDR-2000 DXA scanner. Clinical Nutrition 16, 61–65. Keys A, Fidanza F, Karvonen MJ, Kimura N & Taylor HL (1972) Indices of relative weight and obesity. Journal of Chronic Diseases 25, 329–343.
Kushner RF, Gudivaka R & Schoeller DA (1996) Clinical char-acteristics influencing bioelectrical impedance analysis meas-urements. American Journal of Clinical Nutrition 64, 423S–427S.
Lukaski HC (1987) Methods for the assessment of human body composition: traditional and new. American Journal of Clinical Nutrition 46, 537–556.
Mazess RB & Barden HS (1989) Bone densitometry for diagnosis and monitoring of osteoporosis. Proceedings of the Society for Experimental Biology and Medicine 191, 261–271.
Mazess RB, Barden HS, Bisek JP & Hanson J (1990) Dual-energy x-ray absorptiometry for total-body and regional bone-mineral and soft-tissue composition. American Journal of Clinical Nutrition 51, 1106–1112.
Morabia A, Bernstein M, Heritier S & Ylli A (1997) Community-based surveillance of cardiovascular risk factors in Geneva: methods, resulting distributions, and comparisons with other populations. Preventive Medicine 26, 311–319.
Pearson K (1897) Mathematical contributions to the theory of evolution. On a form of spurious correlation which may arise when indices are used in the measurement of organs. Proceedings of the Royal Society 60, 489–498 Abstr.
Piccoli A, Brunani A, Savia G, Pillon L, Favaro E, Berselli ME & Cavagnini F (1998) Discriminating between body fat and fluid changes in the obese adult using bioimpedance vector analysis. International Journal of Obesity and Related Metabolic Dis-orders 22, 97–104.
Pichard C, Kyle UG, Janssens JP, Burdet L, Rochat T, Slosman DO, Fitting JW, Thiebaud D, Roulet M, Tschopp JM, Landry M & Schutz Y (1997) Body composition by x-ray absorptiometry and bioelectrical impedance in chronic respiratory insufficiency patients. Nutrition 13, 952–958.
Pietrobelli A, Faith MS, Allison DB, Gallagher D, Chiumello G & Heymsfield SB (1998) Body mass index as a measure of adiposity among children and adolescents: a validation study. Journal of Pediatrics 132, 204–210.
Pietrobelli A, Formica C, Wang Z & Heymsfield SB (1996a) Dual-energy x-ray absorptiometry body composition model: review of physical concepts. American Journal of Physiology 271, E941–E951.
Pietrobelli A, Gallagher D, Faith MS, Brambilla P, Chiumello G & Heymsfield SB (1996b) Validation of BMI as a measure of adiposity among children and adults. International Journal of Obesity 20, 155 Abstr.
Roubenoff R, Dallal GE & Wilson PW (1995) Predicting body fatness: the body mass index vs estimation by bioelectrical impedance. American Journal of Public Health 85, 726–728. Slosman DO, Casez JP, Pichard C, Rochat T, Fery F, Rizzoli R,
Bonjour JP, Morabia A & Donath A (1992) Assessment of whole-body composition with dual-energy x-ray absorptiometry. Radiology 185, 593–598.
Svendsen OL, Haarbo J, Hassager C & Christiansen C (1993) Accuracy of measurements of body composition by dual-energy x-ray absorptiometry in vivo. American Journal of Clinical Nutrition 57, 605–608.
Taylor RW, Keil D, Gold EJ, Williams SM & Goulding A (1998) Body mass index, waist girth, and waist-to-hip ratio as indexes of total and regional adiposity in women: evaluation using receiver operating characteristic curves. American Journal of Clinical Nutrition 67, 44–49.
Wang J, Thornton JC, Russell M, Burastero S, Heymsfield S & Pierson RN Jr (1994) Asians have lower body mass index (BMI) but higher percent body fat than do whites: comparisons of anthropometric measurements. American Journal of Clinical Nutrition 60, 23–28.
Wellens RI, Roche AF, Khamis HJ, Jackson AS, Pollock ML & Siervogel RM (1996) Relationships between the body mass index and body composition. Obesity Research 4, 35–44.