Czochralski growth of Yb
3+and Pr
3+doped Ca-fluoroapatite
A. Caprez, P. Mikhail, C. Schwecke, and J. HulligerDepartment of Chemistry and Biochemistry, University of Berne, CH-3012 Berne, Switzerland (Received 19 March 1997; accepted 12 August 1997)
Pure, Pr3+, and Yb3+ doped Ca-fluoroapatite (Ca-FAP) crystals were grown by the Czochralski method. The effective distribution coefficient keff for Yb3+ was 0.5. For Pr3+ a very high keff of 1.4 was obtained. Values for keff are discussed in terms of an elastic model accounting for the strain energy originating from the difference in the size of Ln3+ ions. The Ln3+ concentrations were measured by absorbance spectroscopy, by inductively coupled plasma optical emission spectroscopy, and by electron microprobe analyses.
The apatite structural family [A10(MO4)6X2], represented by a large class of natural and synthetic compounds, crystallizes in a few different, but re-lated, hexagonal and pseudohexagonal structures.1,2 Ca5(PO4)3F (Ca-FAP), apatite, belongs to the hexagonal space group P63ym with Z 2.3 The ten Ca2+ ions are distributed over two crystallographically different sites: 4 Ca2+ are at site I with site symmetry 3 and 9-fold coordination by O2–; 6 Ca2+ are at site II with 6-fold O2– and one F– coordination.4 Lanthanide dopants predominantly enter the Ca(II) site which provides a low energy charge compensation mechanism5: The Ln3+ ion substitutes for Ca2+(II), whose nearest neighbor F– ion is replaced by an O2–.6 Because only one F– ion is available for bonding to every three Ca(II) ions, at most only two Ln3+ ions for every ten Ca2+ in the unit cell can enter the structure without creating an additional charge compensation mechanism.5 In this study we found that co-doping with, e.g., Na+ had no influence on the effective distribution coefficient keff of Yb3+.
Yb3+ doped Ca-FAP and Sr-FAP are currently of interest because of efficient solid state laser proper-ties when pumped by InGaAs diode sources.7–9 Re-cently, a diode-pumped, Q-switched Sr–FAP : Yb3+laser (1047 nm) has been demonstrated.9
In this work we have explored Ca-FAP crystal growth for two reasons: (i) determination of the effective distribution coefficients keffof Yb3+and Pr3+, and (ii) the potential of the Ca-FAP host-lattice as a new material for Pr3+ hyperfine pumped optical hole burning (H-OHB). An important parameter for the application of OHB in optical memories is the homogeneous linewidth of the holes, which is influenced by flip-flop processes of the nuclear magnetic moments of the host material.10 In a previous study we have discussed possible low nuclear spin density host materials for Pr3+ of Eu3+ H-OHB.10 However, a major drawback of selected compounds is that they showed only low doping levels and some effects of disorder in the nearest neighborhood of Ln3+ due to a heterovalent mechanism of substitution.
Al-though Ca-FAP will provide nuclear spins at P and F sites, it nevertheless bears the possibility of a particular mechanism for the charge compensation of Ln3+. The mechanism discussed above implies that a Pr3+ ion in the Ca-FAP lattice would be surrounded by 7 O2– ions whose only isotope with nonvanishing spin (O17, I 5y2, m(N) 21.9 m
N) has a very low natural abundance (0.04%).11In the first coordination sphere of the Pr3+ion no nuclear magnetic moments could hence provide an ef-ficient mechanism of broadening the homogeneous line. In the following we describe the Czochralski growth of Ca-FAP doped either by Yb3+ or Pr3+ and the de-termination of the effective distribution coefficients keff. Obtained values are discussed in terms of an elastic model accounting for the strain energy originating from the difference in the size of Ln3+ ions.
For Czochralski pulling we used the equipment as described recently.12 Crystals were pulled from a 22 (Ø) 3 25 mm Ir crucible under a constant Ar flow of 50 mlymin. CaCO3 (Aldrich, purity: 99.95%), CaHPO4 (Aldrich, purity: 99%), and CaF2 (Aldrich, purity: 99.9%) were used as starting materials. In a first step stoichiometric amounts of the raw materials were shaken in a polyethylene bottle and sintered in a platinum crucible at 1100 ±C for 60 h in a N2 flow of about 100 mlymin. Crystals grown from a charge prepared in this way were opaque and consisted of at least two phases. A possible explanation is given by the Reaction (1):
3CaHPO4ssd 1 CaCO3ssd 1 CaF2ssd
! Ca5sPO4d3Fssd 1 H2Osgd 1 CO2sgd 1 HFsgd .
(1)
Formation of H2O yielded a certain amount of hydroxyapatite in the starting powder, which led to inclusions during crystal growth. Precursor material was hence prepared in two steps: (i) water-free Ca3(PO4)2 was obtained first according to Reaction (2) in air at a
3210 J. Mater. Res., Vol. 12, No. 12, Dec 1997 1997 Materials Research Society
Help Comments Welcome Journal of
MATERIALS RESEARCH
https://doi.org/10.1557/JMR.1997.0419Communications
temperature of 1000±C (60 – 80 h).
2CaHPO4ssd 1 CaCO3ssd ! Ca3sPO4d2ssd
1 H2Osgd 1 CO2sgd . (2)
In a second step (ii), Ca3(PO4)2 obtained from Reaction (2) and CaF2were reacted. The latter was dried under a flow of 5% HFy95% N2 gas (20– 50 mlymin) at 1000±C for 24 h. To prevent water contamination, the Ca3(PO4)2 powder was taken from the furnace directly after finishing Reaction (2). Hot Ca3(PO4)2 was mixed with the CaF2 in a preheated mortar. After transferring into a hot Ir crucible, it was heated up in 2 h to 1700±C in order to complete Reaction (3):
3Ca3sPO4d2ssd 1 CaF2ssd ! 2Ca5sPO4d3Fssd . (3)
For Reactions (2) and (3) stoichiometric amounts of the starting materials were used. The melt (11– 13 g) was superheated for 1 h 50±C above the melting point. Spon-taneous nucleation was initiated on a tapered Ir wire and crystals became single grain after , 2 mm of pulling. Spontaneous nucleation and seed selection produced crystals growing along the c-axis. For a pulling rate of 1.2 mmyh and a rotation of 45 rpm pale blue-greenish crystals of 30 mm in length and 10 mm in diameter were obtained. The boules showed opaque inclusions in the core extending along the c-axis. These defects may be caused by a lower curvature of the convex growth interface at larger diameters. The trapping of gas bubbles in the core of Ca-FAP crystals is a known imperfection.4 Slices with sufficient optical quality for spectroscopic measurements could be cut from the obtained crystals.
During growth experiments (24 h) vapor losses, which may lead to the described imperfections in the core of the crystal, were observed. Electron microprobe (EMP) and powder diffraction analysis of the losses, which were collected from the wall of the Czochralski apparatus, showed that substantial amounts of CaF2 are lost during growth. In order to minimize these losses, an insulation lid (mullite) was placed at about 50 mm above the top of the crucible. Additionally, this particular insulation reduced the axial temperature gradient down to , 20–30±Cycm. This was important to avoid cracking during the cooling process. A further precaution which proved to be a determinant in avoiding cracks was a slow cooling rate of 25±Cyh.
For doping experiments Pr6O11 (Fluka, purity: 99.9%) or Yb2O3 (Fluka, purity: 99.9%) was added to the melt. Other growth parameters were the same as for pure Ca-FAP.
Small pieces of a crystal grown at a Pr3+ concen-tration in the melt of c0 0.07 mol % (according to all
atoms of Ca-FAP) were dissolved in HNO3 (0.7 molar) and analyzed with the inductively coupled plasma optical
emission spectroscopy (ICP). The ICP technique led to cPr 0.1 mol % in the crystal. Solutions of PrCl3? 6H2O (Janssen Chemica, purity: 99.9%) in HNO3 (0.7 molar) were used for calibration. An EMP analysis of a boule grown at c0 0.07 mol % Pr3+yielded a doping level of
cPr 0.14 mol %. In the case of the EMP measurement
PrAlO3 served as a reference for Pr3+. The difference in the Pr3+concentrations may originate from the reference material used in the EMP analysis. PrAlO3 contains different elements when compared to Ca-FAP : Pr3+ and therefore, the software of the EMP calculated a different correction factor for the reabsorption of the characteristic x-ray of the Pr3+. We assume that keff cPryc0 1.4 obtained by the ICP method is more accurate.
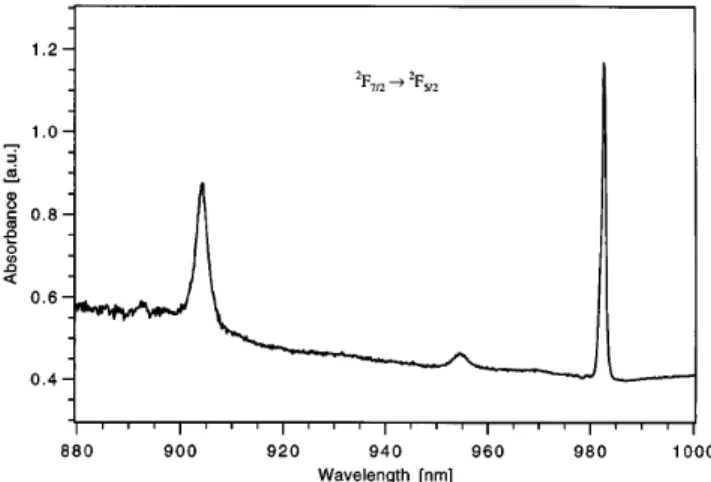
The concentration for Yb3+ doping was determined spectroscopically. Based on the cross sections s for the lines at 905 and 982 nm originating from the 2F
7/2 ! 2F
5/2 transition of Yb3+ and the measured absorbance at the maximums of these lines, the doping level was calculated. A sample grown at c0 0.28 mol % Yb3+
and 0.5 mol % Na+ in the melt was cut with flat and parallel faces perpendicular to the c-axis for absorp-tion measurements with unpolarized light at room tem-perature (Fig. 1). With s905nm 2.6 ? 10–20 cm2 and
s982nm 5.3 ? 10–20 cm2for an electric field polarization perpendicular to the c-axis (E' c),13 we yielded c
Yb 0.13 mol %, which corresponds to keff 0.5.
Qualitatively, the influence of cations co-doping has been observed earlier.14 The value of keff for Yb3+ seems not to be significantly influenced by adding Na+ to the melt. This is also consistent with the fact that we could not detect Na+ by the proton induced gamma emission (PIGME)15 method in a crystal grown at melt con-centrations c0 0.6 mol % Na+ and 0.3 mol % Yb3+.
The detection limit was 0.03 mol % Na+ and a basalt (BHVO-1)16 served as Na reference.
FIG. 1. Optical absorption spectrum of Yb3+doped Ca-FAP (c Yb 0.13 mol %) at room temperature. The thickness of the sample was 3.24 mm and the spectrum was measured with unpolarized light propagating along the c-axis.
J. Mater. Res., Vol. 12, No. 12, Dec 1997 3211
https://doi.org/10.1557/JMR.1997.0419
Communications
A possible explanation for a large difference in the
keff for Yb3+and Pr3+ could be due to the different ionic radii of the lanthanides. The electronic structures are very similar and the oxidation states are the same. The only variable affecting keff is most likely the ionic radii (0.98 ˚A for Yb3+ and 1.14 ˚A for Pr3+, for a coordination number of 8).17 Brice18 regards the lattice as an elastic continuum and calculates the strain energy originating from the radius misfit between the substituted and the doping ion. The effective distribution coefficient keff depends on the misfit in the radius and on elastic properties: lnskeffd lnsk0d 2 4pENA RT 3h1 2rAsrj 2 rAd 2 1 1 3srj 2 rAd 3i , (4)
where k0 is the effective distribution coefficient for a dopant with a radius misfit of zero, E is the averaged Young’s modulus, NAis the Avogadro number, T is the
melting temperature of the material and rA and rj are the effective ionic radii of the substituted ion (index A) and the dopant (index j), respectively. Relation (4) was applied to estimate the ratio between the distribution coefficients of Yb3+ and Pr3+ (kYb
effykeffPr 0.58) using
an effective ionic radius of 1.12 ˚A (for a coordina-tion number of 8)17 for Ca2+. Young’s moduli for the direction parallel °Ek
¢
and perpendicular sE'd to the 6-fold symmetry axis were calculated from the elastic constants of hydroxy-apatite.19 The average value E
1
3 ? sEk 1 2 ? E'd 120 GPa was used for Eq. (4).
Payne et al.13give an average value of E 119 GPa for Ca5(PO4)3F. The measured ratio of the two distribution coefficients is 0.36, being smaller than the calculated value (0.58). This may be caused by an uncertainty in the ionic radii, which after Brice18 can introduce an error of 20%. However, the model predicts a significantly larger
keff for Pr3+.
Optical absorption spectra for a Pr3+ doped crys-tal (cPr 0.1 mol %) at room temperature to 11 K measured with unpolarized light propagating along the
c-axis indicated that the linewidth of the 3H
4 ! 1D2 transition exhibits only a low temperature dependence (Fig. 2). The half-width is decreasing only by a factor 1.4 (for the lowest crystal field level), which would mean that the broadening is mainly inhomogeneous. The room temperature absorption spectrum of an Yb3+ doped sample (cYb 0.13 mol %) exhibits a half-width of 2.49 nm for the line at 905 nm sE'cd (Fig. 1). This is in agreement with the values of 2.4 nm (for Ekc) obtained earlier.20,21
Preliminary experiments22on Ca-FAP : Pr3+revealed no H-OHB processes. Maybe this is due to (i) the site symmetry m of the Pr3+ ion, which does not allow the transition in the lowest crystal field level,10 or (ii) the
FIG. 2. Optical absorption spectra of Pr3+ doped Ca-FAP (c Pr 0.1 mol %) at 11 to 300 K. The thickness of the sample was 3.1 mm. All spectra were measured with unpolarized light propagating along the c-axis.
presence of a broad homogeneous line leading to an overlapping of the holes with the other hyperfine levels of the electronic ground state.
ACKNOWLEDGMENTS
We thank F. Graf and B. Plagemann of the group of Professor U. Wild at the ETH Zurich for helpful discussions and preliminary H-OHB experiments. We are indebted to Dr. L. Diamond for an introduction to electron microprobe analysis. We also thank Ch. Widmer and K. Noll of the group of Professor H. G¨aggeler and Professor U. Kr¨ahenb¨uhl (University of Berne) for providing an ICP analyzer and performing the PIGME experiments and the group of Professor H. U. G¨udel (University of Berne) for using spectroscopic equipment. Both crystal growth and the electron microprobe at the Institute of Mineralogy and Petrography of the Univer-sity of Berne were supported by the Swiss National Science Foundation (projects 2000-043116.95/1 and 21-26579.89, respectively). Further support was provided by the Wander Foundation (University of Berne). REFERENCES
1. E. R. Kreidler and F. A. Hummel, Am. Mineral, 55, 170 (1970). 2. A. G. Cockbain, Mineral. Mag. 36, 654 (1968).
3. W. L. Bragg, Atomic Structure of Minerals (Cornell Univ. Press, Ithaca, NY, 1937).
4. G. B. Loutts and B. H. T. Chai, SPIE-The International Society for Optical Engineering 1863, 31 (1993).
5. L. D. DeLoach, S. A. Payne, W. L. Kway, J. B. Tassano, S. N. Dixit, and W. F. Krupke, J. Lumin. 62, 85 (1994).
6. J. L. Ouweltjes, Modern Materials (Academic Press, New York, 1965), Vol. 5, p. 161.
3212 J. Mater. Res., Vol. 12, No. 12, Dec 1997
https://doi.org/10.1557/JMR.1997.0419
Communications
7. M. R. Dickinson, L. A. W. Gloster, N. W. Hopps, and T. A. King, Opt. Commun. 132, 275 (1996).
8. C. D. Marshall, L. K. Smith, R. J. Beach, M. A. Emanual, K. J. Schaffers, J. Skidmore, S. A. Payne, and B. H. T. Chai, IEEE J. Quantum Electron. 32, 650 (1996).
9. L. A. W. Gloster, P. Cormont, A. M. Cox, T. A. King, and B. H. T. Chai, unpublished.
10. A. Caprez, P. Meyer, P. Mikhail, and J. Hulliger, Mater. Res. Bull. 32, 1045 (1997).
11. Handbook of Chemistry and Physics, 74th ed., edited by D. R. Lide and H. P. R. Frederikse (CRC Press, Cleveland, OH, 1993 – 94), Sec. 11, p. 35.
12. A. Caprez, P. Mikhail, and J. Hulliger, J. Cryst. Growth (1997, in press).
13. S. A. Payne, L. K. Smith, L. D. DeLoach, W. L. Kway, J. B. Tassano, and W. F. Krupke, IEEE J. Quantum Electron. 30, 170 (1994).
14. R. C. Ohlmann, K. B. Steinbruegge, and R. Mazelsky, Appl. Opt.
7, 905 (1968).
15. J. R. Bird and E. Clayton, Nucl. Instrum. Methods Phys. Res.
218, 525 (1983).
16. F. J. Flanagan, Geological Survey Professional Paper 840, United States Government Printing Office, Washington (1976). 17. R. D. Shannon and C. T. Prewitt, Acta Crystallogr. B25, 925
(1969).
18. J. C. Brice, J. Cryst. Growth 28, 249 (1975).
19. Handbook of Physical Constants, edited by S. P. Clark, Jr. (The Geological Society of America, Inc., New York, 1966), p. 142. 20. S. A. Payne, L. D. DeLoach, L. K. Smith, W. L. Kway, J. B.
Tassano, W. F. Krupke, B. H. T. Chai, and G. Loutts, J. Appl. Phys. 76, 497 (1994).
21. L. D. DeLoach, S. A. Payne, L. K. Smith, W. L. Kway, and W. F. Krupke, J. Opt. Soc. Am. B 11, 269 (1994).
22. Measurements at ETH Zurich, Laboratory of Physical Chemistry.
J. Mater. Res., Vol. 12, No. 12, Dec 1997 3213
https://doi.org/10.1557/JMR.1997.0419