Edge-Lit Holographic Stereograms
by
William John Farmer
B.A., Mathematics College of the Holy Cross Worcester, Massachusetts
1971
Submitted to the Media Arts and Sciences Section, School of Architecture and Planning
in partial fulfillment of the requirements for the degree of
Master of Science
at the
Massachusetts Institute of Technology
June 1991
@1991
Massachusetts Institute of TechnologyAll Rights Reserved
Signature of Author -,
Media Arts and Sciences Section May 10, 1991
n
ACertified by
Accepted by
Stephen A. Benton Professor of Media Technology Thesis Supervisor
Stephen A. Benton Chairman Departmental Committee on Graduate Students
MASSACHUSETS INSTITUTE OF TEC01,0GY
JUL*
1991
Edge-Lit Holographic Stereograms
by
William J. Farmer
Submitted to the Media Arts and Sciences Section, School of Architecture and Planning, on May 10, 1991 in partial fulfillment of the requirements of the degree of Master of Science at the Massachusetts Institute of Technology
Abstract
The edge-lit hologram display format has been successfully extended to holographic stereograms. Taking advantage of the discrete nature of the information content of stereograms, the three step production process of edge-lit rainbow holograms has been reduced to a two-step process for edge-lit holographic stereography. Design im-provements have been made to the edge-lit's immersion recording tank. The image distortion resulting from refraction as the object beam transits the air-tank inter-face in the final recording stage has been investigated and compensation techniques developed.
Thesis Supervisor: Stephen A. Benton Title: Professor of Media Technology
This research was supported in part by the Hughes Aircraft Company, as part of their sponsored research program at the Media Laboratory under contract number 7-N73323R9JE, and by the Design Staff of the General Motors Corporation.
Dedication
This thesis is dedicated to two men by way of thanks. It is apparent to me that without their support I wouldn't now be here completing this.
To: Russell K. Hobbie
Associate Dean of the Institute of Technology University of Minnesota, Minneapolis
for having put a human face on a vast bureaucracy. and
To: Steven K. Case
Professor of Electrical Engineering University of Minnesota, Minneapolis
for giving his time when he really didn't have any to give.
Acknowledgements
First and foremost, I would like to thank Stephen Benton for accepting me into his group, for providing a work space that would be the envy of most holographers, and for his advice and guidance.
To my fellow members of the Spatial Imaging Group, I thank you for your comradarie and for your various help, too great to elaborate. Don't think your getting rid of me either. I'll be there to dance on all your graves.
To all the support staff, Linda, Lena, et al., thank you for your help, thank you for your forbearance.
Thanks to my family, Aunt Al, LI, MN, and CA for their important support, financial and emotional.
To my friends in Minnesota, who let me take "time-out", for a couple of years. About ready to call "time-in".
Ken, you've made me laugh even when I wanted to be angry. Write when you find work.
Saving the profoundly heartfelt til last, to my dear and beautiful wife, Yuriko. I don't know the words in either language that can do justice to my feelings of gratitude and love. Thank you for your patience and support, for allowing me to get as much as I could from the MIT experience. You're one in a million. I love you.
Contents
1 Background
1.1 Introduction . . . . 1.2 Holography and Holographic Stereography . . .
1.3 Stereography Research at the Media Lab . . . .
1.4 The Edge-lit Display Format . . . .
1.5 Conclusion . . . .
2 The Role of the Ultragram
2.1 Background . . . . 2.2 The Ultragram . . . .
2.3 Production Steps . . . .
2.4 Consideration of Halle's Geometry to Determine
2.5 Conclusion . . . . . . . . . . . . . . . . View Parameters . . . . 3 Image Distortion and Compensation
3.1 Introduction . . . . 3.2 Ultragram Viewing Mechanics . . . 3.3 Defocused Recording . . . . 3.4 Distortion Compensation . . . . 3.5 Residual Distortion . . . . 3.6 Conclusion . . . . 18 18 20 24 27 29 31 31 33 36 36 39 49
4 A Second Compensation Technique : An Analysis and Proposal 52
4.1 Introduction ... 52
4.2 Matching Optical Paths ... . 53
4.3 Criteria for Distortion-Free Viewing ... 56
4.4 Distortions Introduced by the Compensating Element . . . . 59
4.5 Investigation of Slit Reassignment . . . . 61
4.6 Optim ization . . . . 65
4.7 Conclusion . . . . 68
5 Immersion Tank Redesign 71 5.1 Introduction . . . . 71
5.2 Redesign Considerations . . . . 72
6 Conclusions 76 6.1 Final Thoughts on the Research ... .. .. .. .... . . .. .. . . . 76
6.2 Future Research. .. .. . .. .. . . . . 79
List of Figures
1.1 Comparison of edgelit and traditional hologram illumination. .... 15
2.1 Comparison of spatial geometry of traditional stereograms versus Ul-tragram s. . . . . 19
2.2 Stereogram slit structure as a picket fence. . . . . 21
2.3 Separating the View Plane from the Slit Plane. . . . . 23
2.4 Shuffling constituent planes of Ultragram space. . . . . 25
2.5 Mastering and transfer configurations for edge-lit stereograms. ... 26
2.6 Ultragram view zone. . . . . 23
3.1 Refraction at the air to tank interface. . . . . 32
3.2 Viewband continuum.. . . . . 34
3.3 Intersection of viewbands at viewposition. . . . . 35
3.4 Vertical movement in View Plane. . . . . 37
3.5 Horizontal and vertical mismapping. . . . . 38
3.6 Shift of focal plane compensation technique. . . . . 40
3.7 Graph: uncompensated viewband width. . . . . 42
3.8 Graph: compensated viewband width. . . . . 42
3.9 Graph: comparison of viewband width, compensated versus uncom-pensated. . . . . 44
3.10 Graph: uncompensated positional shift. . . . . 46
3.11 Graph: compensated positional shift. . . . . 47
3.12 Graph: comparison of positional shift, compensated versus uncompen-sated. . . . . 48
3.13 Photograph of final edge-lit stereogram's image. . . . . 50
4.1 Master and transfer configurations for matched-optical-paths compen-sation technique. . . . . 54
4.2 Vertical remap with matched-optical-paths compensation technique. . 55 4.3 Image slicing and slit assignment. . . . . 57
4.4 Refracted image-ray trace. . . . . 58
4.5 Erroneous remap to View Plane. . . . . 60
4.6 Slit reassignment to correct for angular disparity. . . . . 62
4.7 Slit reassignment by refracted slicing. . . . . 63
4.8 Refraction reduces the availablity of storage slits. . . . . 64
4.9 Graph: positional shift adjusted for 114 mm. . . . . 67
4.10 Graph: positional shift adjusted for 160 mm. . . . . 69
5.1 Layout of the prototype exposure tank. . . . . 72
5.2 Layout of the redesigned exposure tank. . . . . 73
5.3 Two views of the new immersion tank. . . . . 74
Chapter 1
Background
1.1
Introduction
The proliferation of holographic images into a broad new range of display venues hinges on the dual requisites of producing stunning images that can be effortlessly displayed. The research reported in this thesis set out to unite two disparate lines of research, each uniquely satisfying one of the two requisites. Holographic
stereogra-phy, empowered by the computer, has become a mature medium capable of producing
beautiful art holograms and also startlingly realistic visualization of scientific data. On the other hand, the edge-lit display format is a fledgling, newly arrived on the holography scene, but holding the promise of eliminating the cumbersome impedi-ments inherent in mounting a holographic display.
Research towards this thesis began with the redesign and engineering of an important piece of equipment used in edge-lit recording, the immersion exposure tank. Although this was the first aspect of research, it is not reported until the end
of this thesis (Chapter 5), being outside the central thrust of the research.
The central thrust is the extension of the edge-lit display format to holographic stereograms. The stereogram, because of the discrete nature of its constituent per-spective images, is a gracious and malleable medium. The ability to utilize a computer to manipulate the perspective images of a stereogram renders it generally compliant to experimentation. Such was the hope going in, such is the result coming out. Because of this predisposition of the stereogram to flexibility, we were able, in this research, to realize a simplification of the edge-lit recording process, eliminating one recording step to reach a two-step process. Chapter 2 will demonstrate the concordant rela-tionship between stereography and computer manipulation, by detailing the specifics of how the simplification of the recording process was achieved.
Because edge-lit production employs refractive-index matched immersion record-ing in the transfer stage, the information bearrecord-ing image wave passes through a refrac-tive interface. The effect of this refraction on our edge-lit stereogram's final image was severe distortion. In Chapter 3, we report and quantify our success in develop-ing a compensation technique to assuage the effect of refraction. This technique has been experimentally tested, resulting in the production of visually satisfying edge-lit stereograms.
Yet some small imperfections remained in the final image after the application of this compensation technique. In Chapter 4, we posit a second compensation tech-nique that, in principle, corrects one of the two small remaining defects. This second technique has yet to be put to the experimental test.
The remainder of this chapter will set the table by briefly reviewing the historical developments of the holographic stereogram and the edge-lit display format,
1.2
Holography and Holographic Stereography
The phenomenon of holography, the 1948 discovery[1] of which earned a Nobel Prize for Dennis Gabor, proved prohibitively challenging until buoyed by the invention of the laser. Thereafter, concurrent with research and advances in optical holography itself, investigation was undertaken into possible application of holography to other formats. Because of the extreme stability requirements of holographic
recording-movement on the order of a hundred nanometers of the recording apparatus dur-ing exposure will likely destroy the information-subject matter that is suitable for holography is greatly restricted; holography is essentially restricted to "small dead things". Notably, organic matter is recorded only with great difficulty. Application research was successful in providing a format in which the range of suitable subject matter was greatly, in fact infinitely, extended. This application research, which will
be noted below leads directly to the current holographic stereogram.
A hologram is an analog information carrier. Perspective information varies
con-tinuously across the spatial extent of the hologram. Using holographic techniques to overcome limitations of a recording technique proposed by Lippmann1 at the turn of the century, McCrickerd and George in 1968[2] recorded a dense two-dimensional ar-ray of perspective views, thereby creating in effect a discretized version of a hologram. Consideration of the psychophysics of human sight led to the reduction of the discrete hologram to a horizontal-parallax-only version, greatly reducing the nonessential and redundant information content of the discrete hologram. This version of the dis-crete hologram emerged from the work of DeBitetto[3, 4] and represents the seminal holographic stereogram.
In holographic stereogram production, a continuous series of perspective views
1
Lippmann proposed that a fly's eye lens, an array of small spherical lenses, could record various perspectives on a single emulsion from which an image with parallax could be projected
are recorded on cin6 film. The subject matter can be anything that can be filmed. In the modern world, this is no longer limited to what is visible to the naked eye. With the emergence of computer rendering sophistication, anything for which three-dimensional spatial data can be collected, as well as any image that can be imagined and rendered is a candidate for holographic stereogram recording. Each of the se-quential two-dimensional views is subsequently recorded as a very narrow (generally
1-3 mm wide) hologram. These narrow holograms are aligned sequentially on a single
recording plate, and in the same sense that mathematical integration can be modeled
by the summation of a continuum of areas of minimal width, so too do these narrow
perspective recordings essentially integrate into a horizontal-parallax-only hologram.
A major line of research in holographic stereograms (hereafter referred to simply
as stereograms) aimed at and succeeded in white light viewability. A two step transfer process which emerged from Bell Labs[5] resulted in achromatic or black-and-white images when illuminated by white light. With images of depths of more than a few centimeters, however, problematic color smearing resulted. A refined technique developed by Benton[6] took into account the relative positions of the various spectral components of the playback image by introducing an angular relationship, the so-called achromatic angle, between the master and the transfer plates. This enabled the production of achromatic images of considerable depth. Moreover, by multiplexing more than one master onto a transfer plate, multi-color stereograms could be created. Another approach to color stereograms originated with the work of Denisyuk[7] whose work focused on Bragg wavelength selection in thick reflection holograms. Hariharan[8] employed emulsion swelling between multiple exposures to create holo-grams which selected more than one wavelength, thus creating multi-color reflection holograms. This so-called pseudocolor technique has been vastly improved by research at the Media Lab[9] resulting in beautiful full-color reflection stereograms.
1.3
Stereography Research at the Media Lab
Because of its superiority as a three-dimensional display medium, the holographic stereogram has been the focus of much research in the Spatial Imaging Group of the Media Lab. In its brief history, the lab has contributed significantly to the improvement of stereograms, leading the way in elevating the current state of the art. The contributions of the Spatial Imaging Group have included research in new geometrical configurations for stereograms[10, 11], computer manipulation of image data to compensate for optical recording distortion[12], creation of a facile RGB color mixing technique for reflection stereograms[9], and scaling up the size of the stereogram[13].
Most recently, research has led to a technique that, by using computer predistor-tion of images, allows for a broad range of new recording and viewing configurapredistor-tions[14, 15]. An equally broad range of benefits has been realized from this technique, such as open-ing the view angle of the final image of stereograms from approximately 30* to over 100*. This technique plays a significant role in the success of the research reported here, and will be described in some detail in Chapter 2.
The application of these advances has resulted in the recent production of a wide variety of high quality stereograms at the Media Lab, ranging from portraiture, through scientific visualization, to artistic display.
All of these stereograms, however, are displayed with a geometrically specific
external illumination source, and changing their display venue is accomplished only with some difficulty.
1.4
The Edge-lit Display Format
The edge-lit display format was developed in the Spatial Imaging Group[16], adapting a strategy from laser-lit head-up display technology[17], and applying it to display holography with white light. This display format does not require the distant exter-nal illumination that has held back the infiltration of holograms into a larger array of display venues. Using a broadband illumination source in the base used to sup-port a hologram, the edge-lit format allows the integration of the hologram and its illumination source into a compact unit.
The name "edge-lit" is actually a bit of a misnomer, suggesting that the holo-gram itself is illuminated through its edge. An earlier, though less glamorous name, "steep reference angle" holography conjures a more accurate image of the what is ac-tually involved optically. In its display format, an edge-lit hologram is laminated to a glass block with a refractive-index matched epoxy. The glass block is on the order of an inch thick. During playback, as diagrammed in Figure 1.1, the edge of the glass block is illuminated at near normal incidence, transmitting, with minimal refraction, nearly vertical rays into the glass. These rays impinge at a very steep angle upon the glass face holding the hologram . These rays are transmitted to the glass substrate of the emulsion and enter the emulsion at angles much steeper than have previously been achievable. In addition to allowing for the placement of the illumination source below and very close to the hologram, this illumination geometry widens the vertical view angle.
The use of a nearby illumination source precludes the use of conjugate illu-mination. A conjugate scheme would require that the reference beam focus to an equally proximate point while still illuminating the transfer plate in its entirety. This would require very large and expensive optics and is not feasible. Instead, a technique that was developed for achromatic rainbow holograms was adapted and applied[18].
Tradionaily Hloogr am am Illuminated by
Distant sal Sources
Illumination Source M
,1500 mm
In the FgUt Format, Illunadon Sources From Below the Supportive Substraite
Tradfitional - Hologram
I.
Tm
nI
I
I
Figure 1.1: The edge-lit display format overcomes the problems inherent in distant, external illumination sourcing characteristic of traditional hologram illumination.
This technique decouples final image reconstruction from the requirement of distant illumination.
According to this technique, in the first transfer, a master's conjugate image is projected downstream beyond the original object plane and recorded in a first transfer. This transfer is played back with conjugate illumination, so that the image wave retraces a path identical to the first transfer stage but with reversed direction. In this second transit, the image is recorded in the object plane using a near-by reference source. This recording, the second transfer, is played back with a broadband illumination source in direct mode, i.e., with a geometrical relation to the hologram identical to the reference source. Because each stage uses either exact conjugate or direct illumination, a distortion-free final image is produced.
Edge-lit holographic recording makes use of this three-step process. The direct illumination used in the edge-lit display is propagated through the base of a substrate that supports the hologram. Correspondingly, in its original methodology, the edge-lit hologram's final transfer was accomplished by index-matching the transfer plate to a supporting substrate and introducing its reference beam through the substrate's base.
Rainbow holograms that were recorded with this original edge-lit technique suf-fered from image artifacts. These artifacts were caused by spurious gratings resulting from Fresnel reflections at the various refractive-index interfaces in the vicinity of the emulsion[191. Index-matched immersion recording of the final transfer was proposed as a solution to the problem of spurious gratings; recording the final transfer in an index-matching liquid moved the largest of the index mismatches far from the emul-sion. A prototype index-matched immersion tank was designed and constructed for testing the viability of the immersion method[20].
1.5
Conclusion
Though the holographic stereogram has a rich history, and has developed to a point where rich and vivid images are the norm, the difficulties inherent in holographic display impede the ascendance of holography to a more prominent role in the realm of display media. The easing of the problems of display would open new venues to holographic display. The early results of the edge-lit display research raised the hope that it might provide a technique and a display format that would overcome these problems.
Overcoming the display obstacles will not be completely achieved by extending the edge-lit format to stereograms. This extension will only be a gross first step. There will remain the detailed work of extending the myriad of experimental advances of stereography to the edge-lit but applying each technique in a way that accommodates for the idiosyncrasies of the edge-lit's recording technique and display. It was with the hope of achieving this first step that the research reported in this thesis was undertaken.
In the next chapter, we will describe how a new type of holographic stereogram has made the integration of stereography and the edge-lit display congruous.
Chapter 2
The Role of the Ultragram
2.1
Background
The viewing system of multi-step white-light-viewable holograms and stereograms is such that one observes the image by looking through an exit pupil or viewing window that is the projected image of the master hologram. This is normally accomplished by playing back the transfer hologram with near-conjugate illumination. As cited earlier, the edge-lit technique has employed a three-step recording process that enables the exit pupil to be played out with direct illumination.
In stereogram viewing, the exit pupil is the projected image of the master and is, therefore, composed of the projected images of the slit holograms that make up the master. When the viewer places his or her two eyes into the projected image of two distinct slits, the viewer observes a stereo-pair of perspective views and stereopsis is satisfied. The reduction of the production process of edge-lit stereograms to two-steps was made possible by the recent work of Halle, who has developed a stereogram
recording geometry, called the "Ultragram", that relaxes these historical viewing constraints[14, 15].
Holo-Space Traditional Holo-Spac ULTRGZ; stereograms
STMASER SLIT PLANE STAGE1: PROJECIONN PLANE
STAGE 2: TRANSFER PLATEPocoN
STAGE 1: PR OJC77ON SCREEN POErO LN
STAGE 2: TRANSFER PLATE POEIO LN
SLt PLANE &
AE1: 6EW NPOW UNDISTORTED VIEW POSil1ONS VIEW PLANE
Figure 2.1: The Ultragram technique allows separation of the Slit Plane and the View Plane, relaxing traditional viewing constraints.
The Ultragram system uses computer predistortion of the discretely recorded images to permit a shuffling of the three constituent planes of stereogram space. Figure 2.1 shows a comparison of the geometry of traditional stereogram viewing to Halle's Ultragram geometry that was used in production of the edge-lit stereogram. With a geometry in which the Projection Plane lies between the Slit Plane and the View Plane, direct (as opposed to conjugate) illumination can be used to play out the virtual (as opposed to real) image of the slit master. Predistortion of the images of the slit master exactly compensates for the image distortions this geometry introduces. Freed from the geometrical constraint of having Slit Plane and View Planes coincide, direct illumination can be used for the playback of the edge-lit stereogram transfer
without the extra transfer step required in edge-lit rainbow holography.
2.2
The Ultragram
The traditional stereogram has a single recording configuration and as a result a single viewing scheme. In recording, integral perspective views of a scene are sequentially recorded in the master as slit holograms. These slit holograms are simultaneously multiplexed in a transfer hologram by recording the conjugate image projected from the master hologram. When the conjugate image of this transfer hologram is pro-jected, the image content of the stereogram is viewable through a viewing window. This viewing window is the image of the master hologram, and the space of the view-ing window is segmented into the slit pattern that partitioned the master hologram. The image content of each of these slit segments is a perspective view of the scene
appropriate to its position in the composition of the master.
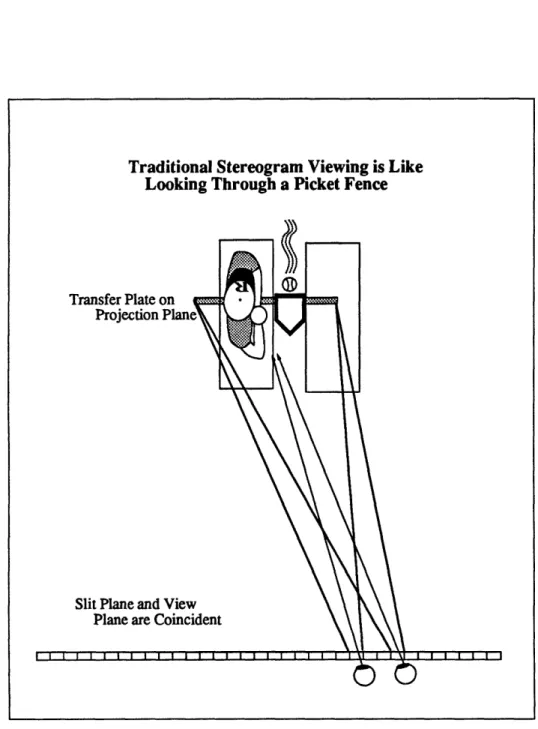
The viewing structure is like a picket fence. Imagine a young fan viewing a base-ball game through such a picket fence. By putting each of his eyes in a space between the pickets, he is able to view the event without impediment. As diagrammed in Figure 2.2, the metaphorical pickets in the view window of the traditional stereogram are the points of transition from one slit to the next. The space between pickets is the area of the slit, and this space is filled with the perspective image appropriate to that slit. Because the image content of each slit is an integral perspective view, the only viewing geometry possible is one in which the Slit Plane coincides with the View Plane.
The viewing limitation of the traditional stereogram results from the fact the the image stored in each slit needs to be an integral two-dimensional view of the scene being recorded. With advancements in computer-based technology and the
Traditional Stereogram Viewing is Like Looking Through a Picket Fence
Transfer Plate on Projection Plane
Slit Plane and View Plane are Coincident
Figure 2.2: Viewing a traditional stereogram, the viewer puts each eye in the projection of a different slit. The slit projection is filled with the projected image appropriate to the slit's view perspective.
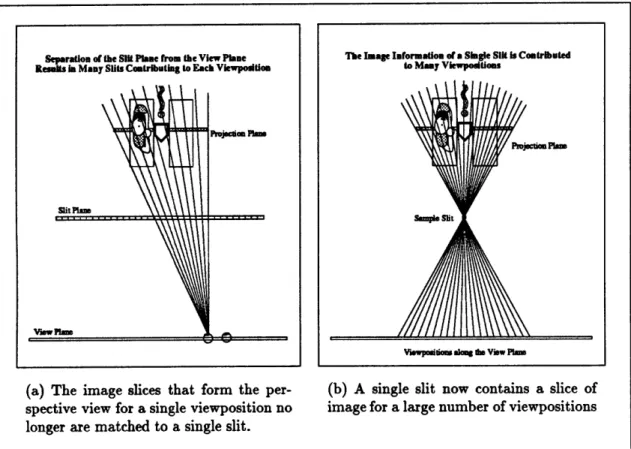
digitizing of images, it was possible to use computer manipulation of the images to break through this limitation. The key to overcoming the limitation was to be able to separate the View Plane from the Slit Plane, an alteration that required a single perspective view to be shared amongst several slits. To see this, let's go back to our young baseball fan. If he stands, not along the picket fence, but rather some distance removed from the the fence, as shown in Figure 2.3(a), his view of the game arrives through multiple slits. The Ultragram viewing system synthesizes a similar construct
by carefully matching slits and portions of the image projected on the Projection
Plane for each viewposition along the View Plane. As shown in Figure 2.3(a), the image delivered to a specific viewposition is a composite of slices of the projection screen, with each slice passing through a different slit. Equivalently, as shown in Figure 2.3(b), each slit will contribute a different slice of the Projection Plane to a large number of discrete viewpositions. To bring this about, the image recorded in a slit must be a composite of slices from various perspective views. This matching of viewposition to slit and image slice is the hallmark of the Ultragram system. New images, composited from the individual slices that pass through the same slit, are fabricated by a technique dubbed "slice-and-dice", and the composited images are those that are recorded in the master.
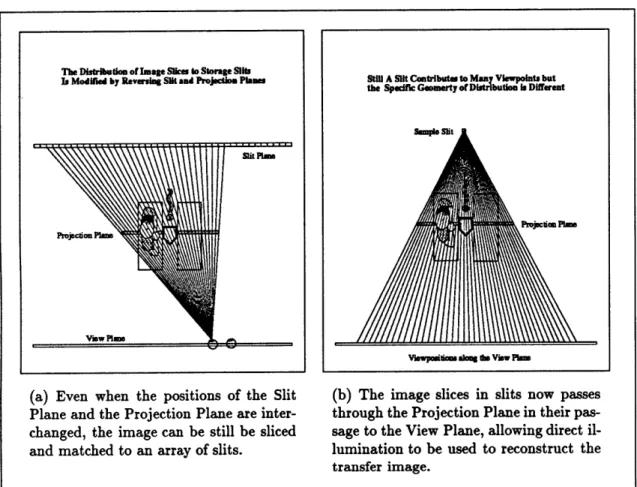
Having separated the Slit Plane from the View Plane, and established the pro-cedure of compositing new images to be recorded in the slits, it becomes possible to shuffle the three planes of the Ultragram space to arrive at new configurations which expand the stereogram taxonomy and the holographer's repertoire. If we geometri-cally shuffle the positions of the Slit Plane and the Projection Plane, as shown in Figure 2.4 we arrive at a valuable result. As can be seen, the "slice-and-dice" pro-cedure is applicable to this configuration as well. During the mastering stage, the image propagates from the Projection Plane to the Slit Plane. When playing out a holographic recording, conjugate illumination can be used to send the image back in
(a) The image slices that form the per-spective view for a single viewposition no longer are matched to a single slit.
The Image Information of a Single Silt Ia Contributed
The Image Information of a Single slit is Coetributed
to Many Viewpoddons
Viswpitiom SlMg View Paw
(b) A single slit now contains a slice of
image for a large number of viewpositions
Figure 2.3: Separating the View Plane
pairing of slit and viewposition.
from the Slit Plane destroys the one to one
Separation of the Sil Plane from the View Plane Results in Many Slits Contributing to Each Viewposidton
the direction whence it came, or direct illumination can be used to continue it in the direction in which it was traveling during recording. During the transfer stage, the image returns from the Slit Plane to the Projection Plane, which is now occupied by the transfer plate. Conjugate illumination is used in this stage to cause the image to retrace its path. But, during reconstruction, with the new configuration diagrammed in Figure 2.4, the image will propagate to the View Plane by traveling in the same direction it traveled during the transfer stage. Therefore, direct illumination will be used. Because the edge-lit technique requires direct illumination of the final image, this Ultragram configuration is ideally suited to the edge-lit display. Using this Ul-tragram configuration, an edge-lit stereogram can be produced in two steps, a saving of one step over the three steps required with edge-lit rainbow holography.
2.3
Production Steps
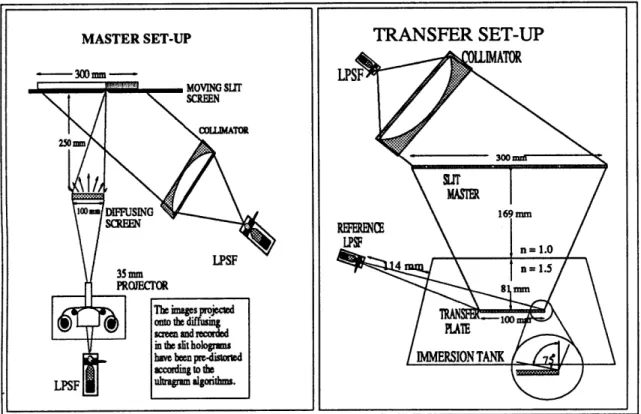
The edge-lit stereogram described here was produced with a two-step process, dia-grammed in Figure 2.5. The 300 mm x 300 mm slit master contained three hundred
1 mm holographic recordings of predistorted images. In recording, these images had
been rear projected onto a 100 mm x 100 mm diffusing screen, set parallel to the slit master recording plate and separated from it by 250 mm. The final view distance is used in the algorithms to calculate and execute the predistortion and must be pre-scribed by the holographer. In our case, a view distance of 500 mm was selected. Aside from the predistortion of the images, the only other variance from standard stereogram-master recording procedure was the fact that the master recording plate and the projection screen remained geometrically fixed with respect to one another, while the 1 mm slit moved relative to both.
Projection Plan
vYw Plan,
(a) Even when the positions of the Slit Plane and the Projection Plane are inter-changed, the image can be still be sliced and matched to an array of slits.
YiewpMosuim aloag e View Plma
(b) The image slices in slits now passes
through the Projection Plane in their pas-sage to the View Plane, allowing direct il-lumination to be used to reconstruct the transfer image.
Figure 2.4: A configuration
Slit and Projection Planes, of the edge-lit display.
of Ultragram space that interchanges the positions of the creates a recording geometry ideally suited to the needs
T DisthJmO of Inmage n Sm to Storage S b Is Modifie by Reversing Slit and Projection Planes
Still A Slit Contribuhe to Many Viewpoint. but
the Spefic Gemerty of Diibution is Different
Sm.slt J
MASTER SET-UP
300-mm-TRANSFER SET-UP
Figure 2.5: The The two-step edge-lit stereogram production technique relies on computer predistortion of the images recorded in the master, and the use of immersion recording for the transfer.
illumination, transitted the front window of the exposure tank, propagated through the index matching liquid, and fell upon the transfer recording plate. There, it interfered with a reference beam that diverged from a coherent point source outside the side wall of the tank.
Playback with direct illumination should, in principle, result in an undistorted final image.
2.4
Consideration of Halle's Geometry to
Deter-mine View Parameters
Using Halle's geometry, we can determine the view parameters from six variables: the relative separation of the three constituent planes of Ultragram space (D,., D,_, D,_
),
the number of slit holograms in the slit master (n.), the width of the projection screen
(W,), and the width of the slit (w,). The width of the slit master plate (W,) is simply
w. x n,. The width of the view zone can determined1 by:
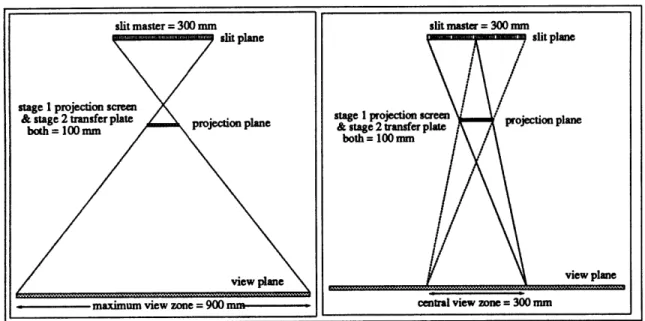
W,;e.,one ; ([D,_,/D,,] x w,) + ([D,-,/D,_,] x W,). (2.1)
This gives us a maximum view zone of 900 mm.
This, however, is an inflated value. At the extreme end of the view zone, only a small percentage of the image remains visible. In Ultragram space, there is a Central View Zone, in which the information content of the image is 100% visible. Outside of the central region, the image content is reduced incrementally as the viewer moves 'Exact formulae for the calculations involving Halle's geometry can be found in his thesis, cited
in the references. The differences from the values arrived at by the approximations used herein are insignificant for purposes of demonstration
slit master = 300 mm
maximum view zone = 900 mr. central view zone= 300 mm
Figure 2.6: The Maximum View Zone encompasses all points at which any of the image is visible. The Central View Zone is bounded by the extreme viewpositions from which the entire image can be viewed.
to the extreme edges of the View Zone. Figure 2.6 shows a ray trace determination of the View Zone and the Central View Zone.
The Central View Zone encompasses all viewpositions in which any ray from the viewposition drawn through any point on the projection screen will strike some point on the slit master. The width of the Central View Zone can be calculated by:
Wcv z ~ ([D,_,/D,,] x [W, - W,]) - W. (2.2)
For our geometry, we get a Central View Zone width of 300 mm.
Lastly, we can calculate the number of discrete viewpositions from our variables.
nv;e., ~ n, + [W,/WP,.], (2.3) slit master = 300 mm
slitplane
plane 100 mm
where W,_, is the width of the mapping of a slit onto the projection screen. We can equivalently restate equation 2.3 as:
nvews, ; n, + [W, x (D,_v/D,_v)], (2.4)
which gives the result of 450 discrete view points.
Combining and summarizing we see that our View Zone width of 900 mm de-composes into three zones: the Central View Zone of 300 mm and two "wing zones", each also of 300 mm. Our 450 discrete views are distributed evenly amongst these three zones. In the Central View Zone, we have 150 viewpositions in which the im-age is fully visible. As the viewer moves out of the Central View Zone and into a wing zone, 1/150 of the image will be lost at each discrete viewposition, until at the extreme position of the View Zone, only 1/150 of the image remains visible. With individual Ultragrams, the extent of excursion into the wing zones before the image quality becomes unsatisfactory will vary, depending upon the specific Ultragram's image composition. Since the image content is, by definition, always complete within the Central View Zone, we choose to use the Central View Zone width as our figure of merit to quantify the view zone.
2.5
Conclusion
More than just streamlining the production technique of edge-lit stereograms, the plane shuffling of Figure 2.4 allows for a reduction of distortion in two-step stere-ograms in general, because direct illumination can be used. Direct illumination will produce a distortion-free image, whereas near-conjugate illumination, used to recon-struct traditional two-step stereograms, will introduce some small degree of distortion in the final image.
The edge-lit stereogram is but one application of the Ultragram technique. The Ultragram is a significant step forward in full dimensional imaging with interesting configurations and benefits beyond the scope of this modest introduction. Interested readers are encouraged to pursue the exhaustive treatment given by Halle in his thesis[14].
Chapter 3
Image Distortion and
Compensation
3.1
Introduction
Although distortion-free stereograms are achievable in principle, our early results were in fact severely distorted. During the transfer stage, as the various image projections from the 300 slits passed through the air-tank interface, they suffered refraction-induced distortions. This is diagrammed in Figure 3.1 as a softening of the focus of the bounding pyramid of the transfer images due to refraction as they pass into the denser medium. The images then focus to a plane beyond the projection plane, and therefore will be recorded out of focus.
The defocusing of the transfer image effects both the vertical and the horizontal foci of the stereogram. Consideration of the viewing system of an Ultragram will clarify the separate distortion results for the horizontal and vertical extents.
Figure 3.1: Image distortion is introduced by refraction at the air-tank inter-face, which changes the focus of the transfer image.
3.2
Ultragram Viewing Mechanics
The diagram of the Ultragram view geometry shown in Figure 2.4 demonstrates that the image rays that focus to a particular viewposition emanate from a large number of the slits in the slit master (in our case each viewposition receives data from 150 of the 300 slits). Each ray that focuses to the viewposition passes through a different point in the horizontal extent of the transfer plate in the Projection Plane. The viewposition represents the horizontal focus of the image data.
However, image information is viewable along the continuum of the View Plane and not just at quantized view positions. To understand the view continuum, consider
a single point on the transfer plate in the Projection Plane and consider how image information from all the slits raytraces through it. For a given slit, rays will retrace to a Projection Plane point from every point across the horizontal extent of the slit. From this Projection Plane point, the ray bundle will fan out as it propagates to the View Plane. The image data from a single slit for a single image point on the Projection Plane does not focus to a single point on the View Plane, but rather projects to a "viewband" along this plane. As diagrammed in Figure 3.2, image data from adjacent slits will project to adjacent view bands, forming this Projection Plane point's viewing continuum. Each slit will project to a viewband, whose width is geometrically prescribed by:
Wviewband = W, X [D,_,/D,-], (3.1)
which in the example case results in a viewband width of 2 mm.
Each pixel point on the Projection Plane will be associated with its own con-tinuum of viewbands. All viewbands, for every pixel point on the Projection Plane and for each viewband continuum, will have the same width. (This gives a linear rate
Figure 3.2: The continuous slit structure projects through pixels in the Projection Plane to a continuum of viewbands in the View Plane.
change of perspective to change of position in the view plane, satisfactorily replicating natural viewing.) The centers of viewbands for viewband continua associated with adjacent Projection Plane pixels will be offset from one another. The amount of off-set will depend on pixel separation on the Projection Plane, which is itself a function of the resolution of the computer images used to record the slit master. The pixel separation (w,) is simply the width of the projection screen (W,) divided by the image resolution. The viewband center offset for viewbands associated with adjacent pixels can then be given by:
offset = w,, x [D,_,/D,,...]. (3.2)
If we use a resolution value of 600 pixels, we find our geometry gives viewband centers that are offset by 0.5 mm. Combining this result with the result from equation 3.1, we see that for our example the viewband continua for any four consecutive pixels will be offset from one another, but that the viewbands for every fourth pixel will
exactly coincide with one another. Figure 3.3 diagrams the offset of the view bands of four adjacent pixels. Viewbands, in our example, from all other pixels will map to the same location as one of the four view bands shown. The hatched area of overlap shown in Figure 3.3 is an area in which the image information for all pixels will be visible. Finally, to reconcile our two viewing systems, i.e., viewpositions versus viewbands, the center of the area of overlap of viewbands is equivalent to the point earlier defined as a viewposition.
View Bands Overlap at View Positions
Slits - Projection Plane Pixels
I
s
4
Overlapping
View Bands
Figure 3.3: Every projection screen pixel will contribute a viewband to each viewpoint. Each viewband will map to one of four distinct positions. The hatched area marks the overlap of all viewbands associated with this viewpoint.
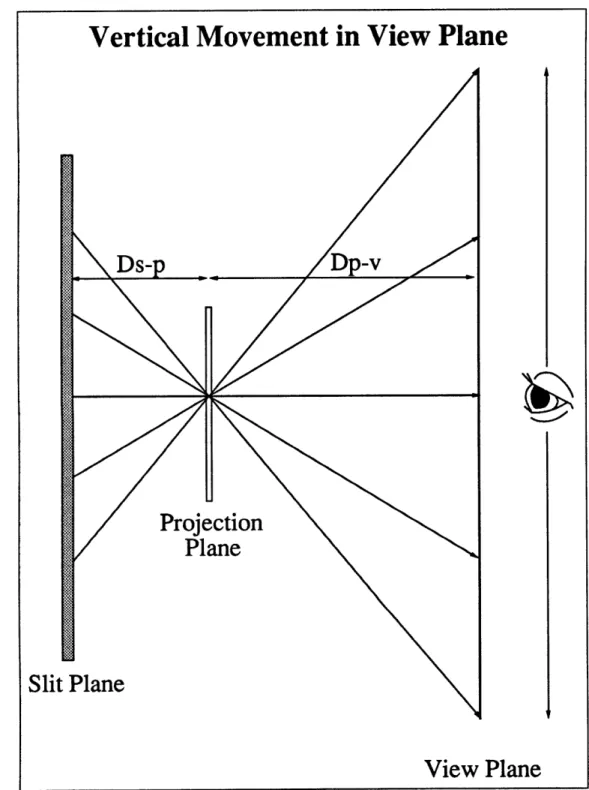
The mechanics of the viewing system through its vertical extent is far simpler, because Ultragrams lack vertical parallax. During the recording of the master, each image pixel will diffuse to all points through the full vertical extent of the slit in which it is being recorded. In the transfer stage, rays emanate from each of these slit points and trace back to the original point in the Projection Plane. During viewing, these rays fan out to the View Plane. Thus, as illustrated in Figure 3.4, the image content
of this pixel point will remain unchanged with vertical viewer movement through the View Plane.
3.3
Defocused Recording
There are two important aspects to the defocused recording of our transfer image. First, the improper focus results in a mismapping of the rays back from the slit mas-ter to their appropriate Projection Plane points in both the horizontal and vertical extents. In the horizontal extent, diagrammed in Figure 3.5(top), this defocused recording results in a compression of the width of viewbands, and by extension, if the defocusing operation on the ray retrace is a linear function, merely a narrowing of the viewband continua. The vertically defocused recording, diagrammed in Fig-ure 3.5(bottom), results in the image bearing ray for a specific Projection Plane pixel mapping through a different vertical position in the transfer plate for each vertical viewposition in the View Plane. Because of this, the image will appear to move in op-position to vertical viewer movement. The second important aspect of our defocused recordings, that the causal operation, refraction, is not a linear function, complicates
compensation considerations.
3.4
Distortion Compensation
A distortion compensation technique has been developed and successfully applied to
edge-lit holographic stereograms. Shown in Figure 3.6, this technique approximately accommodates the effect as a shift of the plane of focus. It is based on the corrective measure that would compensate if the defocusing function were completely linear. By increasing the distance between the slit master and the tank, we can cause the width
Vertical Movement in View Plane
Slit Plane
View Plane
Figure 3.4: The pixel image information is unchanged with vertical movement in the View Plane because of the lack of vertical parallax.
Horizontal Distortion: View Zone Compression
Slit Plane
Projection Plane
View Plane
Q
K5
Vertical Distortion: Image Point Moves In Opposition To Vertical Eye Movement
Slit
Plane
View
Plane
Figure 3.5: The result of rays not correctly refocusing to their Pro-jection Plane positions is a mismapping to the View Plane, resulting in both horizontal and vertical distortions.
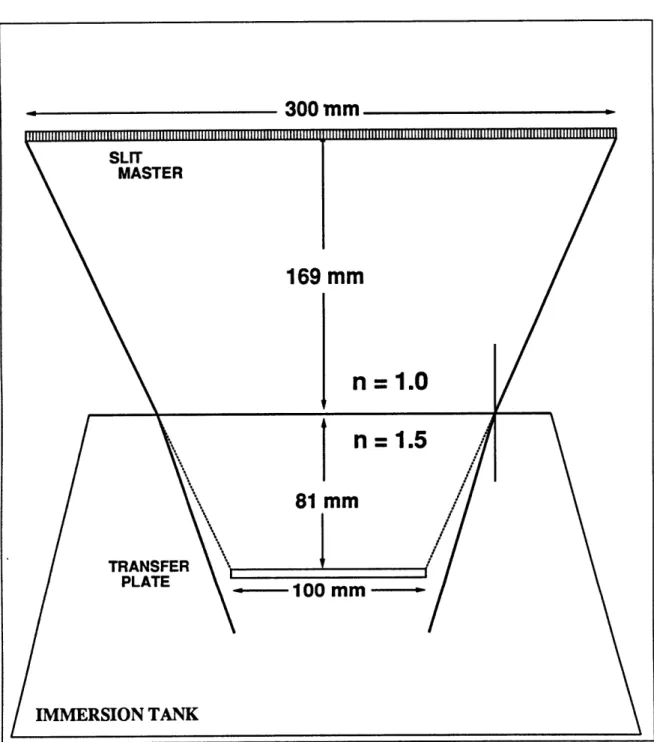
of the bounding pyramid to focus down to 100 mm at the plane of the transfer plate.
The appropriate increase in separation for our example is easily calculable. The angle of incidence at the interface of the edge of the bounding pyramid will remain the same (21.80) regardless of the distance of separation, as will the transmission angle
(14.40). The depth from interface to the transfer plate inside the tank is unchanged (81 mm.). The desired distance from slit master to tank ( Dam-t ) can then be
determined from the algebraic relationship:
(W, - W,)
/
2 = (D.,m-t x tan 21.8*) + (81 x tan 14.40), (3.3)which gives a separation value of 198 mm. We can capture the transfer image in approximate focus for our case by increasing the slit master to tank separation by
29 mm. This method results in some residual distortion. The increased separation
that compensates for the extremes of the transfer images' bounding pyramid assures exact compensation only for the interior rays that strike the interface at the same angle as the edges of the bounding pyramid. All other rays will suffer a certain degree of error in their remapping onto the Projection Plane for recording in the transfer. Moreover, the residual distortion will have both horizontal and vertical effects.
3.5
Residual Distortion
Because the Ultragram is a horizontal-parallax-only device, we are primarily con-cerned with horizontal distortion. The effect of the residual horizontal distortion can be seen from separate analyses of various elements of the Ultragram viewing system that have been introduced in this paper. Determination of deviations in the size of viewbands along all continua will demonstrate the degree of non-adherence to the
300 mm
Figure 3.6: Shifting the plane of focus, by increasing the distance sepaxating the slit master and tank, approximately accommodates the effect of refraction.
linear rate change of perspective to movement through the viewplane. Analysis of the overlap of viewbands at sample viewpoints will reveal the integrity of image data at these viewpoints, as well as changes in the viewing transition in passing through
adjacent viewpoints.
Each pixel point on the Projection Plane will be associated with its own view-band continuum. The continua of all pixel points will be identical in structure, but offset from one another. For each continuum, the viewpoint directly across from the continuum's pixel point will serve as a center of symmetry for the distortion of the continuum. And the distortion for each continuum will be identical, because the angle of incidence on the distorting interface of the limiting rays for each positional view-band in every viewview-band continuum is identical. The distortion effect on a continuum will be a narrowing of the width of viewbands along the extent of the continuum. The narrowing will be weakest at the center of symmetry for the viewband and will increase nonlinearly moving away from the center. Figure 3.7 shows a graph of this nonlinear narrowing along the continuum for the case of uncompensated distortion. At the center of the continuum the viewband width is 108pm smaller than an undis-torted viewband. At an extreme of 200 mm from the center of the continuum, the viewband has been reduced by 134pm.
For the case of continua after this shift-of-focal-plane compensating technique had been applied, calculations were performed to determine residual refraction-induced width-change for each of the viewbands associated with the continua that blanket the Central View Zone. The results, graphed in Figure 3.8 are highly significant for two reasons. The range of viewband width changes are a full order of magnitude smaller than for the uncompensated case. Moreover, the viewbands of a continuum now have their narrowest member at the center of symmetry and increase in width along the continuum. At 114 mm from the center, the viewbands in the continuum pass from being smaller than an undistorted viewband to being larger. Instead of growing
nar-Figure 3.7: This graph plots the change of viewband width as a function of its distance from the center of the continuum for the case of uncompensated distortions.
Figure 3.8: This graph plots the change of viewband width as a function of its distance from the center of the continuum for the case of compensated but residual distortion.
viewband width change (mm)
100 200 -200 -100
I-0.10
viewpoint to pixel lateral separation (mm)
I
*viewbandwidth change (mm)
1
j0.016
.01 100 2 -200 -100 viewpoint to pixel lateral separation (mm: --0.01 .--- 46 ---- &----4 -- # , , .,. .." - -0.12 --0.13rower towards the extremes of the continuum, the viewbands increase in size, so that the range of values now hovers on either side of the undistorted viewband width of 2 mm. The tremendous significance of this will be evident momentarily.
In the compensated case, the maximum deviation (from the prescribed 2 mm width of the viewbands for our example) for any single viewband was 16pm. More importantly, the maximum difference in width for any adjacent viewbands along a continuum was a mere 0.2pm. Fortunately, because of the microscopic nature of this difference, the deviation from perfect linearity of the rate change of perspective view is too subtle to be observable.
The overlap of viewbands at specific viewpoints reveals the strongest effect of our residual distortion. The earlier illustration of the overlap of viewbands at a viewpoint, Figure 3.3, showed four distinct viewband positions. In the case of an undistorted Ultragram with our geometry, each viewband continuum will map a viewband onto one of these four positions. A viewer moving from one viewpoint to an adjacent viewpoint will experience a change of perspective that is divided into four interleaved sets. The crossing of each of four evenly spaced boundaries in the region between viewpoints will result in a change of one-quarter of the image pixels in an interleaved manner. The distortion from refraction variously shifts the mapping of these viewbands so that the component viewbands of each of these four sets will map slightly offset from one another rather than atop one another. This offset does not degrade the viewing experience, per se, because ocular integration smoothes the visual effect of the staggered data change. However, if the offset of viewbands becomes large, then the overlap of all viewbands, shown in Figure 3.3 as the criterion which defines a view position, may not occur and the image data at a viewposition will then become a composite of data intended for disparate viewpositions.
-100
compensated
uncompensated case
viewband width change (mm)
0.02 0.01 viewpoint to pixel lateral separation ( -0.02 -0.03 -0.04 -0.09
Figure 3.9: This graph of the viewband width changes along the continuum for both the uncompensated case and the compensated case displays their differences in both magnitude and polarity.
versus continuum position of our uncompensated and compensated cases. The two cases have been graphed together in Figure 3.9 to clearly demonstrate the difference of range between them. The data integrity of a viewposition is contingent upon the viewposition being embraced by all of the viewbands that would map to it in an undistorted case. The mapping of viewbands along the View Zone can be thought of metaphorically as a convolution of a view continuum with itself. The symmetry of the continuum around its central viewband takes care of the sign flip for one of the convolved continua. In the convolution operation, the stationary continuum can be thought of as representing the central continuum, while the sliding continuum can be thought of as representing the continuum for the succession of all pixel points on the Projection Plane with each incremental shift. Each viewposition will, during this operation, have mapped to it its contributed viewband from each continuum. The integrity of the viewposition will depend upon the accuracy of the viewband mapping
during this convolution.
The accuracy of this viewband mapping will depend directly on the widths of the viewbands along a sample continuum. The amount of mismapping of a specific viewband from a continuum to a viewposition will be equivalent to the distance this viewband has shifted along its continuum due to the influence of the distorting function. The amount of shifting will be an offset equal to the integration of all of the changes in width of all of the viewbands from the center of the continuum out to the specific viewband in question. Since the viewing system of a stereogram is discrete, the integration is actually a summation of the discrete viewband-width-change values.
Figure 3.10 displays a graph of the positional shift of the viewbands along a continuum for the uncompensated case. Because the change in viewband width is a monotonically decreasing function (see Figure 3.7) the positional shifting for viewband position is a monotonic function. For negative continuum positions the positive shift
viewband offset (mm) 10 5 -200 -100 100 200 viewpoint to pixel lateral separation (mm) -5 -10
Figure 3.10: The positional shift of viewbands along the continuum in the uncompensated case is a monotonic function.
and for positive continuum positions the negative shift both represent a movement towards center and hence a narrowing of the width of the total continuum. Because the average value for individual viewband contraction is in the range of 120pm, at the extreme position, the 100th viewband at a distance of 200 mm from the center, the accumulated shift is almost 12 mm. The amount of shifting for a viewband that would be tolerable before effecting the integrity of a viewposition is 0.25 mm. Obviously, the further the shift is out of bounds, the greater the viewing aberration. With a shifting of 12 mm, we get viewpositions that have data mapped to them that are intended for 6 distinct viewpositions. The result is a severe distortion, similar to a bending of the image, so that internal parts of the image are shifted inward moderately, while extreme positions on the image are shifted inward greatly.
The positional offset for a viewband along a continuum for our compensated case is shown in the graph in Figure 3.11. The fact that the average width-change for
Figure 3.11: The positional shift curve for our compensated case contains a turning point because the size of individual viewbands changes from smaller than to larger than the norm along the con-tinuum.
individual viewbands is an order of magnitude smaller than for the uncompensated case means that the cumulative positional shift for the extreme positions will also be an order of magnitude smaller. Moreover, the shift-of-focal-plane compensation technique reverses the direction of the viewband width-change curve (Figure 3.9), resulting in a change along the continuum of viewband size from smaller than the undistorted norm to larger than this norm. The summation that determines the positional shift for extreme viewbands along the continuum will now contain both positive and negative terms and the positional shift function will not longer be mono-tonic, but as graphed in Figure 3.11, will include a turning point so that at the extreme viewband the positional shift has been completely compensated for and this viewband maps exactly to where it would in the undistorted case. A comparison of the uncompensated and the compensated positional shifts is shown in the graph in Figure 3.12.
The viewing effect of the residual distortion in our compensated edge-lit stere-ogram can be understood by consideration of the graph of its positional shift(Figure 3.11).
_ viewband offset (mm)
1
- viewpoint to pixel
lateral separation (mm)
I I
-200 -100
Figure 3.12: This graph displays the great difference of the posi-tional shift curves for the compensated and uncompensated cases.
On the graph, the central zero-crossing is a natural consequence of the fact that a ray with no horizontal component will be perpendicularly incident at the interface and
therefore will experience no refraction. The zero-crossings at positive and negative 200 mm result from our compensation; these rays will be incident on the interface at the same angle as the edge of the bounding pyramid (see Figure 3.1). Other critical
points on the graph are at:
* t61 mm : At this point the offset becomes greater than 0.25 mm. This is the
critical limit for viewpoint integrity. Offset greater than 0.25 mm means that image data will map to a viewposition from an incorrect slit location.
* ±114 mm: The value of offset reaches a turning point. Refraction wants to
drive the offset in one direction and our compensation exerts a force to drive the offset in the other. At this turning point the respective forces are balanced.
100 200
uncompensated
case-compensated case .
-* ±157 mm: The offset passes to a value of less than 0.25 mm, entering a second
region of correct mapping.
* ±200 mm: This zero-crossing represents the maximum pixel point to
viewposi-tion separaviewposi-tion for our example.
The viewing effect of uncompensated shifting of the viewband due to refraction would be a monotonically growing curvature of the projection plane image that can be modeled as one-dimensional pin-cushion distortion. Our compensation technique assuages this distortion by introducing what can be considered a one-dimensional barrel distortion.
The result in viewing is imperceptible. The minimal residual distortion results in no degradation of viewing in the horizontal extent. A photograph of the image of the edge-lit stereogram can be seen in Figure 3.13
The distortion in the vertical extent is visually apparent. The result in viewing is a small rolling of the image away from the direction of vertical viewer movement. However, because this edge-lit stereogram is a horizontal-parallax-only device, and is designed for horizontal viewer movement through the view plane, the vertical effect only slightly mitigates the overall viewing satisfaction.
3.6
Conclusion
A simple compensation technique has been developed, involving shifting the plane of
focus of the transfer image by altering the geometrical relationship of the Slit Plane and the Projection Plane preparatory to the transfer step. The simplicity of the the shift-of-focal-plane technique allows Ultragram masters, recorded according to the general Ultragram algorithms, to be transferred into the edge-lit format. While the
Figure 3.13: A photograph of the final edge-lit stereogram image.
final image of the edge-lit stereogram is visually gratifying, there are minor residual distortions. In the next chapter, we will look at the problem of refractive distor-tions from a second perspective, in an attempt to develop a superior compensation technique.
Chapter 4
A Second Compensation
Technique: An Analysis and
Proposal
4.1
Introduction
While the compensation technique that was detailed in the previous chapter provided high quality edge-lit holographic stereograms, there are two aspects of its results that are less than wholly satisfying. First, some degree of distortion remains. And even though the resultant images do not apparently suffer from this small residual distortion, it would be preferable to be able to produce images that were totally distortion-free.
The second less-than-totally-satisfying property of the images produced by our previous compensation method is the rolling of the image accompanying vertical
viewer movement in the View Plane. Recall that this rolling resulted from image data vertically mismapping to the transfer plate because of refraction experienced entering the immersion tank.
In this chapter, we will detail an analysis that was performed in an attempt to improve the final image. The result is a proposal for an altered recording technique that solves the problem of vertical focus on the transfer plate, but does not result in a distortion-free image in the horizontal extent.
4.2
Matching Optical Paths
The analysis begins with the recognition that the distortion in the edge-lit stereogram, in both the vertical and horizontal extent, results from an optical path mismatch. The optical path from the Slit Plane to the Projection Plane is different during the mastering and the transfer steps. This difference is, of course, the inclusion of the half of the immersion tank that lies between these two planes during the transfer stage. Inclusion of an element of matched size and refractive index to, and occupying the same position as the half-tank during the recording of the slit master would match optical paths for both stages. As diagrammed in Figure 4.1, this could be accomplished using a passive optical element, such as a block of glass.
In the vertical extent, this would automatically correct the focus. All rays would travel identical optical paths from diffusing screen to slit master during mastering and back from slit master to transfer plate during transfer. As diagrammed in Figure 4.2, the refraction experienced upon entry into the tank would match exactly the refraction experienced upon exiting the compensating element. This would result in a correct remapping of the image data in the vertical extent.