Volume'39(1)
'
'
Winter/hiver'2013
Collaboration*indices*for*monitoring*potential*problems*in*online*small*
groups!
Indicateurs!de#collaboration#pour%diagnostiquer!des!problèmes*potentiels*
dans%de!petits&groupes#en#ligne!
Namsook'Jahng,"University"of"British"Columbia"Abstract'
The purpose of this study is to test the validity and reliability of three collaboration indices (quantity, equality, and shareness) proposed by Jahng et al. (2010). The present study repeated the quantitative assessment of Jahng et al., and performed a further qualitative analysis to identify possible factors that might be associated with the results of the quantitative assessment. In addition, membership trends, in terms of communication connections in whole class
discussions, were examined and compared with results from both the quantitative and qualitative assessments. The quantitative assessment results were consistent with those of the qualitative assessment and the membership trends. Therefore, the study concludes that the three quantitative collaboration indices are valid and practical to be used for monitoring and identifying potential problems in small groups in online courses.
Keywords:
quantity, equality, shareness, interaction, quantitative, indexRésumé!
Cette recherche teste la validité et la fiabilité des trois indicateurs de collaboration (la quantité, l'égalité et le degré de partage) proposés par Jahng et al. (2010). La présente étude a répété l'évaluation quantitative de Jahng et al., et a effectué de surcroît une analyse qualitative visant à identifier les facteurs pouvant être associés aux résultats de l'évaluation quantitative. En outre, les tendances de participation, déterminées par les rapports de communication au sein des discussions de classe, ont été examinées et comparées avec les résultats des évaluations quantitatives et qualitatives. Les résultats de l'évaluation quantitative correspondent à ceux de l'évaluation qualitative et des tendances de participation. L’étude conclut donc que les trois indicateurs de collaboration quantitatifs sont valides et utiles pour diagnostiquer d’éventuels problèmes propres aux petits groupes dans les cours en ligne.
Introduction!
The instructor is a key factor influencing satisfying and genuine collaborative learning
experiences in small groups of online courses (Maushak & Ou, 2007). Many researchers have emphasized the importance of the instructor’s active role in terms of carefully monitoring and evaluating collaboration processes to provide timely support and facilitation (Berge, 1995; Heuer & King, 2004; Kanuka, 2005; Palloff & Pratt, 1999). However, there is a paucity of research that has dealt with the practical question of how to evaluate and identify problems during
collaborative learning processes (Jahng, 2012). The research reported in this paper aims to answer the question by employing a practical and feasible but reliable and valid method for examining collaboration processes.
The research questions are:
1. How can group collaborations be assessed by quantitative indices of “quantity, equality, and shareness” (Jahng, Nielsen, & Chan, 2010)?
2. What are the specific hindering/facilitating factors for less/more collaborative groups as assessed by the quantitative indices?
3. How are the group membership trends, in terms of communication connections in whole class discussions, associated with less/more collaborative groups as assessed by the quantitative indices?
Literature!Review!
Research'Problem'and'Background'
Collaborative learning in online courses has been examined through written communication in groups, as described in the literature (Garrison, Anderson, & Archer, 2000; Jahng, 2012).
Communication quantity is most frequently used to evaluate collaboration (Lipman, 1991; Solan & Linardopoulos, 2011; Wenger, 2001). Researchers have regarded active and abundant
communication as a fundamental component for creating and sustaining collaborative learning processes and as a prerequisite for high quality collaboration (e.g., Bauer & Anderson, 2000; Curtis & Lawson, 2001; Jahng & Bullen, 2012; Nistor & Neubauer, 2010). In practice, course management systems often provide communication quantity measures such as the number of log-ins, the period of log-on time, and the lengths of posted messages. However, these quantity measures rarely reveal any specific problems underlying collaboration processes and the quality of collaboration.
Recognizing the weakness of the existing quantity measures to evaluate collaboration in groups, many researchers have conducted content analysis for the last few decades (Hara, Bonk, & Angeli, 2000; Penny & Murphy, 2009; Rourke & Kanuka, 2009). Henri (1992), in particular, urges instructors to employ the content analysis method “as a pragmatic instructional tool to yield practical results which can be used immediately to coach and facilitate learning” (p. 134). She claims that content analysis provides information on the participants and thus the informed
educator is better able to offer immediate support to both the individual and the collaborative learning process.
On the other hand, more recent research notes that content analysis may be “a technique more suited for researchers than for instructors” (Penny & Murphy, 2009, p. 805), because its coding process is “difficult, frustrating, and time-consuming” (Rourke, Anderson, Garrison, & Archer, 2001, p. 2). Considering the instructor’s workload and time commitment, the instructor may not be able to read all messages, let alone code them, to provide timely response or intervention to individuals or groups. Then, how can an instructor identify at-risk groups that require his/her facilitation and intervention?
Jahng et al. (2010) devised three quantitative indices (quantity, equality, and shareness) based on concepts of social network analysis and content analysis methods. The researchers measured collaboration rankings of four groups by the three indices and compared the group rankings with the achieved group marks. The collaboration rankings were consistent with the group marks. The researchers claimed that the indices reveal different problem aspects of group communication structure.
As Jahng and colleagues (2010) argued, the quantitative collaboration indices would be useful for instructors to monitor and support groups if the indices are valid and reliable in indicating critical problems in collaborative learning processes in groups. However, the author of the current study identifies some limitations of Jahng et al. (2010). First, the validity of the indices was not supported sufficiently by any other evidence, except for the group marks. Group marks in a graduate course may not necessarily be the genuine outcome of group collaboration. For example, the group product could be a compilation of individual pieces of work (i.e.,
cooperation, and not collaboration) or the product of one able individual with no collaboration or cooperation. Second, the study involved only twelve students in four groups, and two groups received the same group mark. Third, the reasons for lower or higher collaboration rankings were not identified or explained. For these reasons, the collaboration measures need to be further explored both to replicate the earlier work and to offer more practical application of the indices for instructors of online courses.
Recognizing the limitations of the previous study, the current study employs an in-depth qualitative analysis to identify hindering or facilitating factors related to less or more
collaboration as measured by the three quantitative indices (quantity, equality, shareness). In addition to the qualitative assessment, group membership trends, in terms of communication connections in whole group discussions across the course timeline, are investigated as potential evidence for validity of the quantitative indices. This study will contribute to online teaching and learning by connecting research findings more directly to practice.
Collaboration'Indices:'Quantity,'Equality,'Shareness'
Quantity indicates active interaction among group members during group collaboration. Jahng et al. (2010) measured communication quantity by the total number of words exchanged in each group. This measure was comparable because the number of members in each group was the same (n=3). In the current study, the quantity index measured the average number of words exchanged within a group because each group consisted of a different number of members (n=3 to 5).
Equality identifies participation variability among members. When a member dominates the communication, the others rarely participate in collaboration. Thus, the equality index reveals a skewed interaction structure. Equality is calculated as the standard deviation of the number of messages exchanged among members.
Shareness was coined by Jahng et al. (2010). Shareness reveals team-spirit/teamwork by
calculating the portion of statements sent to all members. This index is a measure of how a group makes effort to establish a responsible and inclusive community. If group members send
messages to all of the other members (i.e., one-to-group communication), the shareness index is higher than if more of the group’s communications are sent to individual members (i.e., one-to-one communication) rather than all the members. Even though the nature of the group forum space in the learning management system usually allows any member to read all postings, a member may not feel an obligation to respond to or think seriously about messages in which his/her name is not included. On the other hand, a message directed to all members may compel each member to think actively and participate in the communication process. According to Vaughan and Garrison (2006), sharing communication is necessary to establish a sense of community. This is important because in a well developed group, the communication structure among members is more open to enable information-sharing without isolating or excluding some members (Wheelan & Kesselring, 2005), which is, in turn, related positively to group
performance (Barry & Stewart, 1997; Hyatt & Ruddy, 1997).
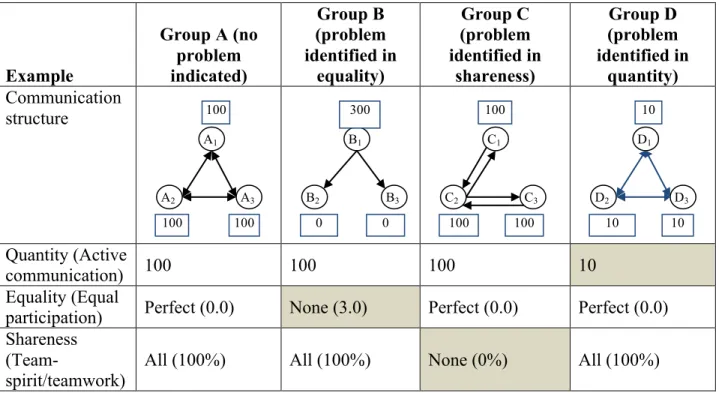
Table 1: Example of the three indices revealing different problems in small groups
Example Group A (no problem indicated) Group B (problem identified in equality) Group C (problem identified in shareness) Group D (problem identified in quantity) Communication structure Quantity (Active communication) 100 100 100 10 Equality (Equal
participation) Perfect (0.0) None (3.0) Perfect (0.0) Perfect (0.0) Shareness
(Team-spirit/teamwork)
All (100%) All (100%) None (0%) All (100%)
Table 1 provides examples of group communication patterns for generic groups demonstrating: (A) no problem; (B) equality problems; (C) shareness problems; and, (D) quantity problems. Group A does not indicate any collaboration problems on the three indices. The group demonstrates good communication in quantity (100 words per member), perfectly equal
A1 A2 A3 100 100 100 B1 B2 B3 300 0 0 C1 C2 C3 100 100 100 D1 D2 D3 10 10 10
participation, and perfect shareness of communication. The communication network structure is triangulated by the three indices to reveal solid connections without broken links. Group B communications reveal a problem in equality. The group communication is dominated by B1
while the other two members never participate in the group communications. A potential
problem in Group C is identified by the shareness index. All the members in Group C participate equally, but C1 and C3 never have direct communication. Thus, C2 is centralized in the group’s
communication network structure. Group D reveals the same network structure as Group A. However, communication quantity is very low, which may signify a lack of engagement in the community.
Collaborative'Learning'vs.'Cooperative'Learning'
Collaborative learning is often defined by comparing its characteristics with cooperative learning (Alavi & Dufner, 2005; Dillenbourgh, Baker, Blaye, & O’Malley, 1996). For the research
reported here, collaborative learning was defined differently from cooperative learning. A collaborative group was expected to seek a solution as a team, undertaking more complex processes working together, instead of taking a simple divide-and-conquer approach (Ingram & Hathorn, 2004; Stacy, 1999).
Theoretical!Model!
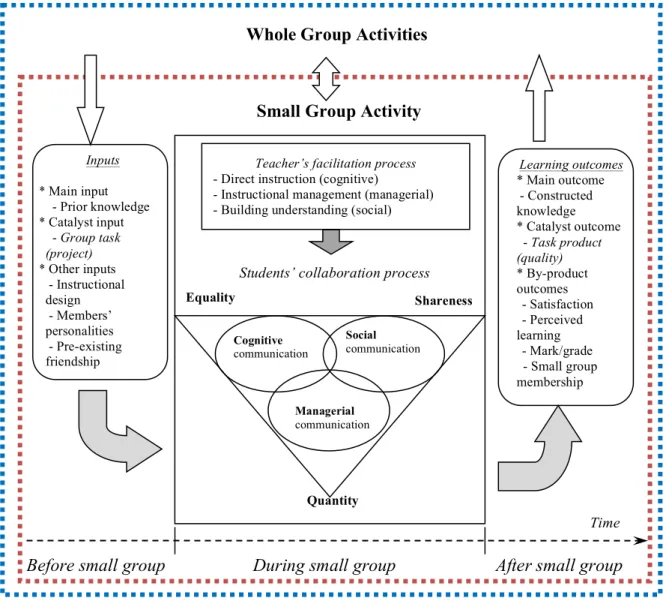
The Small Group Collaboration Model (SGCM) (Jahng et al., 2010) provides a theoretical framework for the current study. The SGCM was developed out of the main concepts from three existing models: Community of Inquiry (CoI) (Garrison, Anderson, & Archer, 2000), Input-Process-Output (IPO) model (McGrath, 1964, 1984), and Online Interaction Learning Model (Benbunan-Fich, Hiltz, & Harasim, 2005). The model, as shown in Figure 1, illustrates potential variables of inputs and outcomes that may be associated with small group collaboration across the timeline. The inputs include members’ prior knowledge, a group task as a catalyst for collaboration, other elements such as members’ experiences, personalities, pre-existing
friendship in a whole group community before entering small groups, and instructional design. A small group inquiry community is nested within a whole group community. This means that the students keep participating in whole group discussion activity as they are doing small group activity simultaneously. Thus, the relationship among small group members (called membership here) is assumed to be influenced by, and exert influence on, the whole group community. Some groups may have built up friendships among members while other groups may not have known or ever have communicated with each other before entering a small group. A group whose members have exchanged communication during whole group discussions before entering the small group activity may have developed stronger social and/or cognitive presence when
compared to other groups whose members have rarely responded to other small-group members’ postings during the whole group discussions.
According to the IPO model (McGrath, 1964; 1984), the collaboration process transforms inputs into outcomes. The goal and genuine outcome of a collaborative learning process can be said to be members' constructed knowledge. Throughout the collaboration process, group members presumably have contributed to members’ constructing knowledge as well as establishing group membership. Examples of outcomes of group collaboration, therefore, can be learner
satisfaction, perceived learning, the quality of the product of the task, and group membership. When the students experience deep and meaningful learning through a collaboration process, the
outcomes would naturally be positive with higher student satisfaction and higher levels of perceived learning, higher quality of the group work product, and improved membership in the larger community. Wenger (1998) asserts that learners develop group membership as they engage in the collective process of learning in a community of shared practice. According to Wenger’s stages of membership development, group members tend to keep in touch,
communicate, and call for advice in a larger community after leaving the small group community.
In the SGCM, it is presumed that a group would produce more positive learning outcomes if the group members participate actively in the collaboration process (quantity); if their
communication shows decentralized structure without being dominated by one or two members (equality); and if members communicate to promote team-sprit and create attachment among group members by including all group members in communication instead of isolating some members (shareness).
Figure 1: Small Group Collaboration Model (SGCM)
Whole Group Activities
Inputs * Main input - Prior knowledge * Catalyst input - Group task (project) * Other inputs - Instructional design - Members’ personalities - Pre-existing friendship Learning outcomes * Main outcome - Constructed knowledge * Catalyst outcome - Task product (quality) * By-product outcomes - Satisfaction - Perceived learning - Mark/grade - Small group membership Cognitive communication Social communication Managerial communication Shareness Equality Quantity
Students’ collaboration process
Teacher’s facilitation process - Direct instruction (cognitive)
- Instructional management (managerial) - Building understanding (social)
Before small group During small group After small group Time Small Group Activity
Methods!
Data'and'the'Context'
A total of 2,029 messages were included in this research; 1,297 messages were retrieved from the whole group activity and 732 messages from the small group forum spaces from a graduate online course in an educational technology program. The course was delivered over 13 weeks in 2008 through the WebCT Vista course management system in a large western Canadian
university. Twenty-four students (12 females and 12 males) were enrolled in the course. Most of them were full-time or part-time teachers or working professionals in the area of educational technology. The researcher was not involved in teaching or marking for the course.
The course included two major learning activities: whole group discussions and a small group activity. For the whole group discussion activity, a discussion topic was posted each week on the course bulletin board where students were required to add thoughts and opinions based on
suggested readings and in response to classmates’ messages. There were four units of discussions including Unit 1 (self-introduction, biographical activity) and Units 2, 3, and 4 (topic
discussions). Instructors participated in the whole group discussions by answering students’ questions, clarifying confusion, and facilitating students’ discussions.
For the small group activity, students were asked to form their own groups to write a group paper as an assignment of the course. Groups could choose from two topic options. As described on the course website, topic option #1 was to analyze “a real example of institutional planning for e-learning and the use of e-learning technology.” It required the group to read and analyze a series of real documents that had been produced as part of the planning process in an educational
institution. In addition, they needed to do some background research on the institution to fully understand the context. Topic option #2 was to create “an imaginary case to recommend a vision for the use of e-learning.”
Groups communication mainly occurred in the group forum space on the course website. While the instructor monitored communication in these forums, they rarely posted messages unless a group specifically asked for their help. Additionally, some groups communicated synchronously through Skype, course chat rooms, and/or instant messengers. All the groups used either Google Docs or Wiki to edit the group paper.
Analysis'Procedures'and'Methods'
Both qualitative and quantitative methods were employed in the current study. In conducting a content analysis, the coding framework reported in Jahng et al., 2010 (Table 1, p. 46) was used to categorize the communication into cognitive, social, or managerial categories. Two coders independently coded 20% of the small group communications (162 messages/10,169 words). The overall agreement rate between the coders was 87%, with a Cohen’s kappa of 0.79, which is in the range of “substantial” strength of agreement (0.61-0.80), according to suggested
benchmarks by Landis and Koch (1977). The coded data were measured by three indices, on which the six participating groups were ranked from the most collaborative group (ranking 1) to the least collaborative group (ranking 6).
Followed by the quantitative evaluation of group collaboration, an in-depth qualitative analysis was performed to identify any hindering or facilitating factors that potentially influenced the collaboration rankings as assessed by the quantitative indices. Each group’s text communication was read repeatedly and summarized across the timeline of the course in terms of: (1) when and how a group initiates the group activity (ice-breaking stage); (2) what approach a group takes for dividing the task (brainstorming); (3) how group members exchange information and develop ideas (developing ideas); (4) how a group synthesizes to complete the task (compiling and editing); and (5) how members feel after completion of the collaboration (adjourning with satisfaction).
Throughout the process of reading the forum messages, the researcher was mindful of any collaboration that might be found in the other communication data. She paid careful attention to groups’ communications about synchronous chats and Google Docs/Wiki activities occurred outside of the group forum. The researcher tracked and noted the forum communication to examine how these groups arrange, debrief, and assess their synchronous meetings and Google Docs/Wikis activities.
Finally, group membership development was examined by tracing communication relationships among small group members revealed from the whole group discussions before, during, and after the small group activity. As depicted in the Small Group Collaboration Model (Figure 1), a stronger pre-existing (before) friendship presumes more collaboration in a small group. In post-group (after) membership, members who experienced more collaboration would tend to continue communication after the small group activity.
Results!
Quantitative'assessment'using'quantity,'equality,'and'shareness''
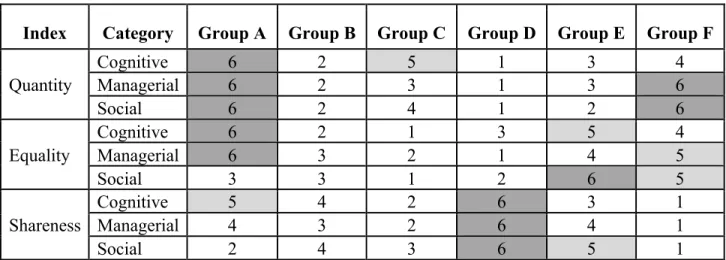
For the purpose of quickly identifying potential problems in groups during group collaboration, a rubric table (Table 2) shows collaboration rankings in 9 domains as assessed by three
collaboration indices (quantity, equality, shareness) in three communication categories
(cognitive, social, managerial). The rank in each domain presents from the most collaborative group (rank 1) to the least collaborative group (rank 6).
The assessment results reveal that two groups (B and C) are not ranked as the least collaborative group in any of the nine domains. Meanwhile, the other four groups are ranked as the least collaborative group in one or more domains in the rubric table. Groups B and C can be identified as more collaborative groups than the rest of the groups. These two groups do not seem to have any serious problems and need not be red-flagged for instructors’ careful attention.
When examining the other groups, Group A is most frequently ranked as the least collaborative group. This group displays problems with members’ active participation, as well as democratic contribution. Group D is ranked by the shareness index as the least collaborative group in all three communication categories. This indicates that members’ communication tends to be one-to-one rather than one-to-group. By the equality index, Group E reveals the least collaboration in their social communications. By the quantity index, Group F is the least collaborative group in social and managerial communication and is also low on the equality index in all the
Table 2: Collaboration rankings assessed by three indices
Index Category Group A Group B Group C Group D Group E Group F
Quantity Cognitive 6 2 5 1 3 4 Managerial 6 2 3 1 3 6 Social 6 2 4 1 2 6 Equality Cognitive 6 2 1 3 5 4 Managerial 6 3 2 1 4 5 Social 3 3 1 2 6 5 Shareness Cognitive 5 4 2 6 3 1 Managerial 4 3 2 6 4 1 Social 2 4 3 6 5 1
Note: Ranks 6 and 5 are shaded as potential at-risk groups in collaboration by the indices.
'
Qualitative'assessment'results'compared'with'the'quantitative'assessment'
Because of their low rankings in several domains, Groups A and F were identified as having problems in communication quantity and participation equality, as shown in Table 2. Qualitative analysis of the communication processes in the groups found that Group A started
communication much later than other groups for the small group project. As a result, the group did not have time for ice-breaking communications at the beginning of the small group activity and rarely exchanged social communications over the rest of the time of their work together. One member led the group by simply splitting the group task into individual portions, while the other members followed this instruction. The individual parts were then compiled to complete the group work. It appears that the members avoided any deeper negotiations to either recognize or seek to overcome opinion gaps in the group process. Therefore, the group can hardly be assessed as a successful group that achieved the benefits of collaboration in terms of better and more learning by challenging one another’s existing knowledge system to reach a higher level of thinking and to construct new knowledge.
Group F was ranked as the least collaborative group in the categories of managerial and social communication when measured by the quantity index (Table 2). The group also revealed a very low level of equality in all three communication categories. In-depth review of communication in Group F revealed that its biggest problem was members’ indecisiveness and lack of leadership in the group. Every member was reluctant to take a leading role, so the group had a dilemma in making decisions for moving on to the next step. From the beginning, this group was stuck in choosing a topic for the group paper.
Group D was ranked as the least collaborative group by the shareness index. However, this group revealed the highest level of collaboration in terms of the quantity and the equality of communication. A closer reading of the group’s communications showed that the members struggled with many technological problems including Internet access. These problems caused serious emotional conflict between two members, which led to more one-to-one communications rather than one-to-group communications, as shown in the group’s low shareness ranking.
Group E was identified as having some problems in equality. This may have been a consequence of the group composition, as there were five members living in different time zones, and their initial communications reflected their struggles with the time differences and individuals’ preferences for some communication tools over others. Nevertheless, the group seemed to overcome these issues as they proceeded to work more collaboratively.
According to the measures used in this study, Group B had excellent collaboration throughout the activity. The group members exchanged many social statements and maintained a team spirit throughout their work together. In addition, this group started their work together quite early (relative to other groups), where they exchanged social communications that seemed to help them develop a sense of teamwork. This early start seemed to be an important factor for the high collaboration in this group.
Group C was also a very collaborative group. This group was efficient in their use of
synchronous communication tools along with the asynchronous forum provided on the course website. Because the members communicated through both synchronous and asynchronous methods, their style of working allowed ready combination of the individual parts of the assignment, including the negotiations, to make one final product.
Regarding the uses of synchronous chats and/or Google Docs/Wikis, there seemed to be no contradictory collaborations revealed in asynchronous communication. Only Group C
successfully communicated through chats, which was evidenced in their forum communication. The group efficiently arranged synchronous meetings and posted summaries of their chats in the forum. Other groups discussed whether to have synchronous meetings but decided not to use synchronous tools because of perceived difficulties in setting a time and/or choosing an
appropriate tool. All the groups’ activity in Google Docs/Wikis showed similar patterns as were revealed in forums. For example, one member of Group F (the least collaborative group) posted a message in the forum to complain about no activity in the group’s Google Doc that he had started. On the other hand, Group B (the most collaborative group) frequently attached revised versions to postings in the group forum that produced in the group’s Google Doc.
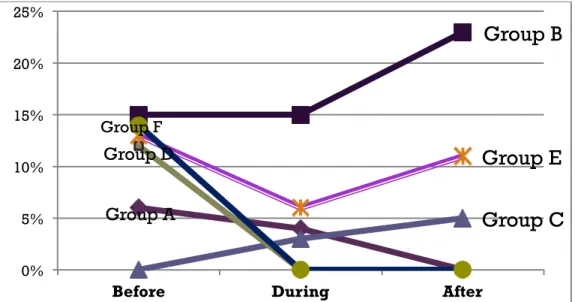
Group'membership'trends'revealed'in'whole'group'discussions'
Group B, which was identified as the most collaborative group by both the quantitative indices and the qualitative evaluation, revealed increased membership after the small group activity (Figure 2). Group E’s membership dropped during the small group activity and recovered after the activity. Group C started the small group activity without any previous interaction, but indicated improved relationships after the activity. Groups A, D, and F, which were all identified as problem groups, did not communicate at all in the whole group discussions after the small group activity.
Discussion'
Significance'
As discussed in the introduction of this paper, there are common issues of efficacy and reliability of coding written data in conducting a content analysis (Murphy & Ciszewska-Carr, 2005). Thus, evaluating collaboration process by employing a content analysis technique may not be feasible
for instructors. To deal with this issue, the author attempted to calculate collaboration rankings by the three indices, using of the total volume of communication data without coding these into three categories.
Figure 2: Group membership development trend in whole class discussions
Another important aspect of the indices is found in this study. The three indices are independent in terms of assessing different aspects of the groups’ collaboration processes. A high volume of communication measured in quantity is not positively related to equality (individual
contribution), nor is it related to shareness (teamwork communication). In this regard, each index can be used for identifying potential problems. For instance, a high volume of communication is not always a sign of collaboration, but very little communication is often problematic. Perfect equality is not necessarily an indicator of successful collaboration, but a very unbalanced structure of group communication can be problematic. Full 100% shareness is not always ideal for good collaboration, but very individualistic one-to-one communication can be a sign of problems in the communication network within a group. To conclude, it can be said that a group has good collaboration when its communication has no problems indicated across all the three indices: quantity, equality, and shareness. If a group would reveal itself to be the least
collaborative by any of the three indices, this suggests that the instructor should pay more careful attention to provide a possible support for the group.
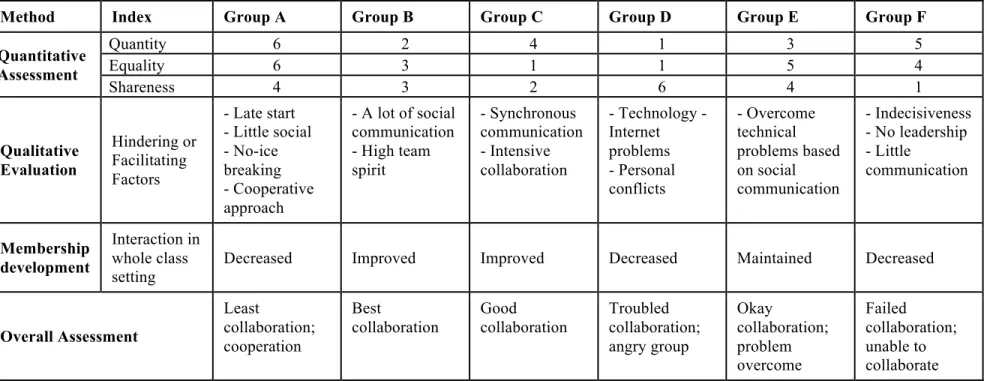
The assessment results are presented in Table 3. Instead of nine domains without dividing communication into coding categories (see Table 2), three collaboration rankings indicate potential at-risk groups. In order to compare the results with qualitative evaluation and group membership trends, the findings reported in the above section are summarized in the table as well. The quantitative assessment results are consistent with the results from the qualitative assessment and group membership trend. This implies that potential problems will be revealed by the indices without coding the data into communication categories. This result has practical implications because a method that does not require conducting content analysis, and yet still identifies potential problems, through a built-in monitoring system of for a course, would be both feasible and useful.
Group A
Group B
Group C
Group DGroup E
Group F 0% 5% 10% 15% 20% 25%Table 3: Summary of findings
Method Index Group A Group B Group C Group D Group E Group F
Quantitative Assessment Quantity 6 2 4 1 3 5 Equality 6 3 1 1 5 4 Shareness 4 3 2 6 4 1 Qualitative Evaluation Hindering or Facilitating Factors - Late start - Little social - No-ice breaking - Cooperative approach - A lot of social communication - High team spirit - Synchronous communication - Intensive collaboration - Technology - Internet problems - Personal conflicts - Overcome technical problems based on social communication - Indecisiveness - No leadership - Little communication Membership development Interaction in whole class
setting Decreased Improved Improved Decreased Maintained Decreased
Overall Assessment Least collaboration; cooperation Best collaboration Good collaboration Troubled collaboration; angry group Okay collaboration; problem overcome Failed collaboration; unable to collaborate
Limitations)&)Further)Studies)
The author acknowledges some limitations of this research. First, the research context was a graduate online course where small groups were required to work collaboratively on a group assignment project. Thus, the instructional methods and the theoretical model proposed in this article may be more useful for designing and facilitating collaborative learning processes in online courses similar to the research context than any other types of courses delivered by face-to-face or hybrid format.
Second, the data analyzed in this study were asynchronous communication data posted on course bulletin board and group forums. As reported in the Method section, other communication data that occurred outside of the course setting were not included in this research. If these data had been available for the analysis, they could have been useful to triangulate the findings of the research. Throughout the process of qualitative analysis, however, the author was aware of the potential problem caused from missing the extra data. As reported in the Results section, collaborative groups frequently talked about their synchronous chats or Google Doc/Wiki activities while less collaborative groups did not. This implies that a less collaborative group with little communication in an asynchronous communication setting tends to be less functional in a synchronous setting as well. In order to follow up this research, the author suggests further analyses including synchronous data as well as survey and/or interview data for the future research.
Third, outcome evaluations such as group marks, the quality of the group product (group paper), or student satisfaction were not included in this research. Although it is reasonable to expect that more collaboration would likely result in better outcomes, a more collaborative group might not always receive a higher mark or report higher levels of student satisfaction. The relationships between the learning process/outcomes and between inputs/outcomes may be research topics for further studies.
Lastly, the author assumes different weights may exist among the three indices. Quantity is the fundamental element for collaboration. Thus, the quantity index may be given more weight than the other two indices. In terms of communication categories, the cognitive category could be given more weight than social or managerial communications. In order to measure the degree of collaboration, a weighting formula needs to be developed based on analysis of a much larger data set in future studies.
Conclusion))
This study assessed collaboration processes in small groups using three quantitative indices (quantity, equality, and shareness) proposed by Jahng et al. (2010). By repeating the
methodological procedures and the coding framework employed by Jahng et al., written communication data posted in small group forums were coded into cognitive, social, and
managerial communication and groups were ranked relatively according to the indices (Table 2). While Jahng et al. compared the evaluation results with group grades, the current study
performed qualitative analyses to identify factors that might be associated with the assessment results according to the indices. The qualitative examination within individual groups described reasons for less or more collaboration as indicated by the indices. In addition, group membership trends were also examined (Figure 2). The communication network development revealed
consistent results with the quantitative and qualitative analyses. Therefore, it is concluded that the three quantitative indices of quantity, equality, and shareness, are valid evaluation tools that can be used to identify potential problems in small group collaboration processes. Furthermore, the indices are independent in terms of assessing different aspects of communication structure and thus they appropriately reveal potential collaboration problems without coding
communication data by content analysis.
!
References)
Alavi, M., & Dufner, D. (2005). Technology-mediated collaborative learning: A research prospective. In S. R. Hiltz, & R. Goldman (Ed.), Learning together online: Research asynchronous learning networks (pp. 191-213). Mahwah, NJ: Erlbaum.
Bauer, J. F., & Anderson, R. S. (2000). Evaluating students’ written performance in the online classroom. In R. E. Weiss, D. S. Knowlton, & B. W. Speck (Eds.), Principles of effective teaching in the online classroom (pp. 65-72). San Francisco, CA: Jossey-Bass.
Barry, B., & Stewart, G. L. (1997). Composition, process, and performance in self-managed groups: The role of personality. Journal of Applied Psychology, 82(1), 62–78.
Benbunan-Fich, R., Hiltz, S. R., & Harasim, L. (2005). The online interaction learning model: An integrated theoretical framework for learning networks. In S. R. Hilts, & R. Goldman (Eds.), Learning together online: Research on asynchronous learning networks (pp. 19-37). New York: Lawrence Erlbaum Associates.
Berge, Z. L. (1995). Facilitating computer conferencing: Recommendations from the field. Educational technology, 35(1). 22-30.
Curtis, D., & Lawson, M. (2001). Exploring collaborative online learning. Journal of Asynchronous Learning Networks, 5(1), 21-34.
Dillenbourg, P., Baker, M., Blaye, A., & O'Malley, C. (1996). The evolution of research on collaborative learning. In E. Spada & P. Reiman (Eds.), Learning in Humans and Machine: Towards an interdisciplinary learning science (pp. 189--211). Oxford: Elsevier.
Ferreira, D. J., & Dos Santos, G. L. (2009). Scaffolding online discourse in collaborative ill-structured problem-solving for innovation. Informatics in Education, 8(2), 173–190. Retrieved from http://www.mii.lt/informatics_in_education/pdf/INFE153.pdf Garrison, D. R., Anderson, T., & Archer, W. (2000). Critical inquiry in a text-based
environment: Computer conferencing in higher education. The Internet and Higher Education, 2(2-3), 87-105.
Hara, N., Bonk, C. J., & Angeli, C. (2000). Content analyses of on-line discussion in an applied educational psychology course. Instructional Science, 28(2), 115-152.
Heuer, B. P., & King, K. P. (2004) Leading the band: the role of the instructor in online learning for educators. Journal of Interactive Learning Online. 3(1), 1-11.
Henri, F. (1992). Computer conferencing and content analysis. In A. Kaye (Ed.), Collaborative learning through computer conferencing: The Najaden papers (pp. 117-136). Berlin: Springer-Verlag.
Hrastinski, S. (2008). What is online learner participation? A literature review. Computers & Education. 51. 1755-1765.
Hyatt, D. E., & Ruddy, T.M. (1997). An examination of the relationship between work group characteristics and performance: once more into the breech. Personnel Psychology, 50(3), 553-585.
Ingram, A., & Hathorn, L. (2004). Methods for analyzing collaboration in online
communications. In T. Roberts (Ed.) Online collaborative learning: Theory and practice (pp. 215-241). Hershey, PA: Information Science Publishing.
Jahng, N. (2012). A systematic review of small-group communication in post-secondary online courses. Journal of Open, Flexible and Distance Learning, 16(2), 26-40. Retrieved from http://journals.akoaotearoa.ac.nz/index.php/JOFDL/index
Jahng, N., & Bullen, M. (2012). Exploring group forming strategies by examining participation behaviours during whole class discussions. European Journal of Open, Distance and ELearning. Retrieved from
http://www.eurodl.org/index.php?p=archives&year=2012&halfyear=1&article=500 Jahng, N., Nielsen, W., & Chan, E. K. H. (2010). Collaborative learning in an online course: A
comparison of communication patterns in small and whole group activities. Journal of Distance Education, 24(2), 39-58. Retrieved from
http://www.jofde.ca/index.php/jde/article/view/647
Jonassen, D. H. (1999). Designing constructivist learning environments. In C.M. Reigeluth (Ed.), Instructional theories and models (Vol. 2, pp. 215–240). Mahwah, NJ: Lawrence Erlbaum Associates.
Kanuka, H. (2005). An exploration into facilitating higher levels of learning in a text-based Internet learning environment using diverse instructional strategies. Journal of Computer Mediated Communication, 10(3). Retrieved from
http://jcmc.indiana.edu/vol10/issue3/kanuka.html
Landis, J. R. & Koch, G. G. (1977). The measurement of observer agreement for categorical data. Biometrics, 33, 159 -174.
Maushak, N., & Ou, C. (2007). Using synchronous communication to facilitate graduate students’ online collaboration. Quarterly Review of Distance Education, 8(2), 161-169. McGrath, J. E. (1964). Social psychology: A brief introduction. New York: Holt, Rinehart &
Winston.
McGrath J. E. (1984). Groups: Interaction and performance. Englewood Cliffs, NJ: Prentice-Hall.
Murphy, E. & Ciszewska-Carr, J. (2005). Identifying sources of difference in reliability in content analysis of online asynchronous discussions. International Review of Research in Open and Distance Learning, 6(2).
Nistor, N. & Neubauer, K. (2010). From participation to dropout: Quantitative participation patterns in online university courses. Computers & Education, 55(2), 663-672.
Penny, L. & Murphy, E. (2009). Rubrics for evaluating online discussions. British Journal of Educational Technology, 40(5), 804-820.
Palloff, R., & Pratt, K. (1999). Building learning communities in cyberspace: Effective strategies for the online classroom. San Francisco: Jossey-Bass.
Rourke, L., & Kanuka, H. (2009). Learning in communities of inquiry: A review of the literature. Journal of Distance Education, 23(1), 19–48.
Rourke, L., Anderson, T., Garrison, D. R., & Archer, W. (2001). Methodological issues in the content analysis of computer conference transcripts. International Journal of Artificial Intelligence in Education, 12(1), 8-22.
Solan A. M., & Linardopoulos, N. (2011). Development, implementation, and evaluation of a grading rubric for online discussions. Journal of Online Learning and Teaching, 7(4), 452-464. Retrieved from http://jolt.merlot.org/vol7no4/linardopoulos_1211.htm
Stacey, E. (1999). Collaborative learning in an online environment. Journal of Distance Education, 14(2), 14-33.
Vaughan, N., & Garrison, N. R. (2006). How blended learning can support a faculty
development community of inquiry. Journal of Asynchronous Learning Networks. 10(4), 139-152.
Wenger, E. (2001). Supporting communities of practice: A survey of community-oriented technologies. Report to the Council of CIOs of the US Federal Government. Retrieved from http://www.ewenger.com/tech/index.htm
Wheelan, S., & Kesselring, J. (2005). Link between faculty group development and elementary student performance on standardized tests. Journal of Educational Research, 98(6), 323- 330.
Author
Namsook Jahng earned her PhD and MA in Curriculum and Pedagogy at the University of British Columbia. She currently works as an instructor and research consultant at the UBC. Her research interests include using technology to enhance learning, facilitating collaboration in online settings, and developing curriculum/courses employing up-to-date technologies. Email: nsjahng@gmail.com.