HAL Id: hal-02445479
https://hal.umontpellier.fr/hal-02445479
Submitted on 20 Jan 2020
HAL is a multi-disciplinary open access
archive for the deposit and dissemination of
sci-entific research documents, whether they are
pub-lished or not. The documents may come from
teaching and research institutions in France or
abroad, or from public or private research centers.
L’archive ouverte pluridisciplinaire HAL, est
destinée au dépôt et à la diffusion de documents
scientifiques de niveau recherche, publiés ou non,
émanant des établissements d’enseignement et de
recherche français ou étrangers, des laboratoires
publics ou privés.
Benjamin Fores, Gilbert Klein, Nicolas Le Moigne, Olivier Francis
To cite this version:
Benjamin Fores, Gilbert Klein, Nicolas Le Moigne, Olivier Francis. Long-Term Stability of
Tilt-Controlled gPhoneX Gravimeters. Journal of Geophysical Research : Solid Earth, American
Geophys-ical Union, 2019, 124 (11), pp.12264-12276. �10.1029/2019JB018276�. �hal-02445479�
Long
‐Term Stability of Tilt‐Controlled
gPhoneX Gravimeters
Benjamin Fores1 , Gilbert Klein1, Nicolas Le Moigne2, and Olivier Francis1
1Research Unit in Engineering Science; Faculty of Science, Technology and Communication, University of Luxembourg, Esch‐sur‐Alzette, Luxembourg,2Géosciences Montpellier, UMR 5243, Université de Montpellier, CNRS‐INSU, Montpellier, France
Abstract
Spring relative gravimeters are considered too unstable to provide useful information on long‐term gravity variations. In this paper, we prove that the new generation of spring gravimeter gPhoneX can reach long‐term stability at the μGal level (10 nm s−2) when the verticality of the gravimeter is maintained, if the instrumental drift can be correctly estimated. We conducted two comparisons with different gPhoneXs in different observatories and environmental conditions. In the“Walferdange Underground Laboratory for Geodynamics” in Luxembourg, we compared time series from the gPhoneX (with and without tilt control), with data from a superconducting gravimeter. We found an agreement at the μGal level when the tilt control is switched on. We validated this result by repeating the experiment at the “Geodesy in Karstic Environment” observatory in the south of France. The fit between the superconducting gravimeter and the gPhoneX hourly values gives similar results at all frequencies over 276 days of measurements. The linear correlation coefficient between the gPhoneX and superconducting gravimeter reaches 0.99, with a misfit of 6.0 nm s−2. We demonstrated that tilt‐controlled gPhoneXs are suitable for long‐term gravity monitoring.1. Introduction
Continuous and precise gravity monitoring allows the investigation of both long period and high frequency changes. It addresses questions in numerous scientific fields where mass redistributions occur at various time scales (from minutes to decades). Continuous gravity time series are valuable data sets for, for example, earth tides models estimation (Calvo et al., 2014; Rosat et al., 2004), volcano monitoring (Carbone et al., 2017, 2019), reservoir monitoring, hydrology (Hector et al., 2014), etc. Van Camp et al. (2017) offer a detailed review of ground based gravity applications including monitoring. If we take the example of hydrology, grav-ity changes reflect the water mass changes occurring in both vadose (unsaturated) and saturated zones, which vary over large time scales: from the quasi‐instantaneous rains to the annual meteorological cycle, plus a possible trend, especially in the context of global climate change and anthropogenic pressure. Continuous gravity time series can be assimilated to build and constrain hydrological models and better understand hydrological processes (e.g., Fores et al., 2017, 2018; Hasan et al., 2008).
The current absolute gravimeters are subject to wear and not designed for continuous monitoring. Only rela-tive gravimeters can provide long‐term time series. Traditionally, one considers that the relative gravimeters which use a spring to counteract the Earth's gravity force are not suited for continuous observations over long periods (Carbone et al., 2019; Torge, 1989). Some of the reasons for that include long‐term thermal instabilities, a large instrumental drift, and tilt variations. In fact, these gravimeters have been designed forfield measurements and not for long‐term continuous observations, which is currently the exclusive domain of superconducting gravimeters (SG). SGs are undoubtedly the most precise and stable gravimeters to date (e.g., Rosat & Hinderer, 2018), but the superconducting state requires a power‐consuming refrigera-tion unit, and SGs are expensive to buy and maintain.
More than 10 years ago, Micro‐g Lacoste Inc. introduced the Portable Earth‐Tide relative spring gravimeter (Micro‐g LaCoste Inc., 2008). Since then, the name changed to gPhone and finally gPhoneX. The new gen-eration of gravimeters is an upgraded version of the well‐known LaCoste‐Romberg G‐meter with a zero‐ length spring (Micro‐g Lacoste, 2013). A controlled double oven ensures a very stable internal temperature. The great care given to the vacuum seal makes the gravity sensor almost completely insensitive to
©2019. American Geophysical Union. All Rights Reserved.
RESEARCH ARTICLE
10.1029/2019JB018276
Key Points:
• gPhoneXs are suitable for long‐term gravity monitoring when the tilts are actively controlled Supporting Information: • Supporting Information S1 • Data Set S1 • Data Set S2 Correspondence to: B. Fores, benjamin.fores@uni.lu Citation:
Fores, B., Klein, G., Le Moigne, N., & Francis, O. (2019). Long‐term stability of tilt‐controlled gPhoneX gravimeters. Journal of Geophysical Research: Solid Earth, 124, 12,264–12,276. https://doi. org/10.1029/2019JB018276
Received 27 JUN 2019 Accepted 1 NOV 2019
Accepted article online 7 NOV 2019 Published online 23 NOV 2019
atmospheric pressure changes and humidity (Riccardi et al., 2011). The feedback system is the Aliod beam nulling system allowing precise digital measurements at the level of one nm s−2(0.1μGal).
In addition, a tilt‐controlled platform to maintain the verticality of the gPhoneX has been developed at the University of Luxembourg. It consists in a tripod with 2 feet being piezo‐controlled to maintain its horizon-tality within ±0.6μrad. Later, Micro‐g Lacoste Inc. designed one and put their own tripod on the market, with three temperature‐controlled hydraulic legs. In this paper, we investigate the long‐term gravity changes (longer than 1 day) of gPhoneXs on our own tilt‐controlled tripod, yet same results are expected with the manufacturer platform, which has a similar stability of 0.2 arcsec RMS (manufacturer specifications). We got our experimental results by comparing gPhoneXs with SGs that are always actively tilt controlled (Goodkind, 1999). We used observations from two different gPhoneXs (032 and 116) and two different SGs (OSG‐CT040 and iGrav002), on two different sites with different environmental conditions.
In thefirst part, we look at the benefits of tilt control by comparing gPhoneX time series obtained with and without tilt control. This has been done in the Underground Laboratory for Geodynamics in Walferdange (WULG, Luxembourg), that has hosted the GWR OSG‐CT40 since 2003. We found that with the tilt control on, and after estimating the instrumental drift of the gPhoneX, we reach a comparable degree of long‐term stability for intervals longer than a few hours. However, the WULG is an ideal site in term of thermal stabi-lity and low anthropogenic noise.
In the second part, we reproduce the results with a different gPhoneX in the Geodesy in Karstic Environment (GEK) laboratory, situated in the Larzac plateau (south of France). Since its creation in 2011, the GEK hosts a GWR iGrav SG (Warburton et al., 2010). The observatory, although in a quiet region, is built at the surface and suffers a Mediterranean climate. This site is thus more affected—than the WULG —by wind, hydrological perturbations, temperature, anthropic noise, and power failures. Data from the SG and the tilt‐controlled gPhoneX over 1 year agree to a remarkable degree, demonstrating that the achieved stability is not instrument‐dependent and that tilt control is the essential condition to ensure reliable results. We will show that gPhoneXs are suitable for studies for which hourly values and 1‐μgal long‐term stability are required. Depending on the requirements and the logistics, a gPhoneX may be an alternative option to SGs as it is easier to operate, more portable and does not need a refrigeration unit. They can be more easily installed in places such as caves (Tanaka et al., 2013; Watlet, 2017). Their lower price and maintenance cost could increase the density of stations networks, as for instance on volcanoes (Carbone et al., 2019) or the development of methodologies based on multiple instruments (e.g., Kennedy et al., 2014).
2. The Walferdange Comparison
The Walferdange Underground Laboratory for Geodynamics in Luxembourg (WULG), formerly a gypsum mine, hosts the Superconducting Gravimeter OSG‐CT040 since December 2003 (Lampitelli & Francis, 2010). The chamber of the OSG is 800 m away from the entrance and 100 m beneath the surface, far from anthropogenic noises and with a naturally stable temperature of 13 °C. The site is extremely quiet: the WULG hosted several International and European Comparisons of Absolute gravimeters (see e.g., Francis et al., 2015). In 2014, the gPhoneX#116 was installed for almost 1 year in an adjacent room, less than 15 m from the SG (October 2014 to mid‐September 2015).
2.1. Data Pre‐Processing
Standard gravity processing is applied to the raw data of both gravimeters: calibration from voltage reading to acceleration; data editing for earthquakes and other disturbances; low‐pass filtering of the data that are decimated from 1 s to hourly data; corrections for earth tides, atmospheric pressure and polar motion effects; finally, we estimated the instrumental drifts.
We checked the manufacturer calibration factor by comparison with the SG data. The latter was calibrated with absolute gravity measurements (Lampitelli & Francis, 2010). The analysis of the SG time series using the ETERNA software (Wenzel, 1996) provided the gravity tidal parameters to predict the tide model as well as the barometric admittance (−3.2 nm·s−2·hPa−1). The tidal analysis of the OSG‐CT‐040 data in Walferdange is described in Lampitelli and Francis (2010). The gravity changes due to the polar motion
are calculated using the International Earth Rotation Center data (http://www.iers.org). The same gravity tides prediction, poles, and atmospheric effects were used to correct both gravimeters time series.
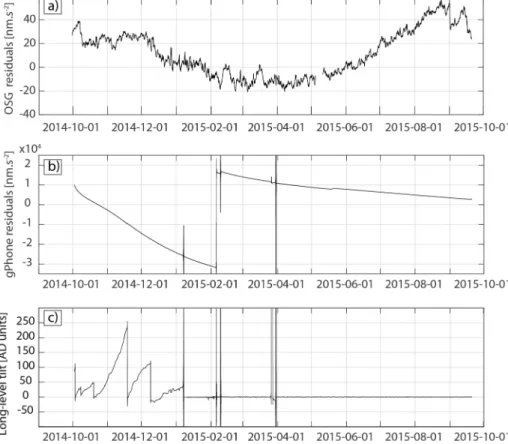
At high frequencies (period less than a few hours), the gPhoneXs data are noisier than the SG (e.g., van Camp et al., 2017; Riccardi et al., 2011; Rosat & Hinderer, 2018). In this study, we concentrate on lower fre-quencies and thus we low‐pass filtered and decimated to hourly values both gPhoneX and SG measurements Figure 1 shows the SG (a) and gPhoneX#116 hourly gravity residuals (b), which are the calibrated data cor-rected for all the known geophysical signals previously described (tides, atmospheric pressure, and pole motion effects). Data from the gPhoneX#116 long‐level tilt is shown in the bottom plot. The SG does not show any drift. The drift of the OSG‐CT040 is less than 10 nm s−2per year (Lampitelli & Francis, 2010) and is linear over a decade (Van Camp & Francis, 2007). It is worth noticing the small amplitude of the grav-ity residuals with a remaining amplitude (60 nm s−2peak‐to‐peak) caused by the annual hydrological cycle. At the WULG, this signal is anti‐correlated with water storage changes, since most water mass changes occur above the gravimeters (Lampitelli & Francis, 2010).
Compared to the SG, the gPhoneX#116 has a much larger instrumental drift (up to thousands of nm s−2per year, Figure 1b). Thefirst 45 days, from 1 October to 15 November 2014, are affected by an initial relaxation of the spring and the data were discarded. Since its installation in October 2014 and until January 2015, the gPhoneX#116 tilts were not controlled, yet were subject to several manual re‐leveling (Figure 1c). The tilts changed by a few hundred analog‐digital units (ADU) each month (1 ADU is about 0.6 μrad) despite the tem-perature in the mine being extremely stable. After the 8 January 2015, the gPhoneX was set on a leveling platform to keep the gravimeter vertical. Several tests and developments were conducted to improve the tilt‐control system until end of March 2015. Starting from April 2015, the tilts are perfectly maintained within [‐1; +1] ADU. However, we observe a relaxation in the gPhoneX#116 gravity, starting on the 1 May 2015, and a gap in the SG data from the 4th to the 11th due to a problem with the cold head of the helium refrigeration system.
Figure 1. Gravity time series from (a) OSG‐CT040 and (b) gPhoneX#116, after correction for the effect of Earth tide, atmo-spheric pressure and polar motion. (c) gPhoneX#116 long‐level tilt.
10.1029/2019JB018276
2.2. Results
In this section, we present the results for two distinct periods: one without and the other one with tilt control. Thefirst lasted from 15 November 2014 to 6 January 2015 (53 days). The second period, during which tilt of the gPhoneX is controlled, has two different parts because of a relaxation that occurred in May 2015 for an unknown reason. Thefirst tilt‐controlled part lasts 32 days from 31 March to 1 May 2015. The second one is 112‐days long, from 29 May to 17 September 2015.
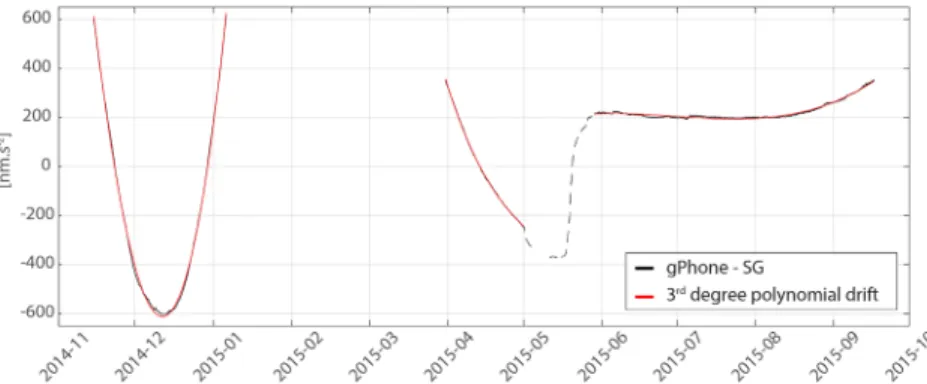
Relative gravimeters drifts can be estimated using absolute gravity (AG) measurements (e.g., Hinderer et al., 1991; Francis & Van Dam, 2002). 13 AG measurements were carried out from October 2014 to August 2015. Unfortunately, only two AG data remain during the tilt‐control period (5 June 2015/15 August 2015). With only two data, we cannot estimate a nonlinear drift as experienced by the gPhoneX#116 (Figure 1b). Instead, we took the difference between the gPhoneX and the SG. The amplitude of the leftover is dominated by the drift signal, which is smooth by nature. We thus modeled the instrumental drift by 3rd degree polynomial functions.
Three drifts were independently estimated on the three different periods: the one before and the two after the tilt control was switched on (Figure 2). For the period where the tilt is not controlled, we had to correct the offsets caused by two tilt re‐leveling before the drift estimation (−106 and −26 nm s−2on 18 November 2015
and 9 December 2014, respectively). These offsets are not associated with gaps and therefore are perfectly corrected, without adding extra errors.
Figure 2 shows the gPhoneX‐SG difference after a first linear drift correction for legibility (black lines), and the estimated 3rd degree polynomial drifts (red lines). The linear trend of the drift is much larger for thefirst part when tilt is not controlled (−337 nm·s−2·day−1) than for the periods when tilt is controlled (48 nm·s
−2·day−1, also visible on Figure 1). The coefficients of the polynomial function also tend to decrease over
time. It shows the long‐term stabilization of the gPhoneX and the impact of the manual re‐leveling on this stabilization.
2.2.1. Results Without Tilt‐Control
Figure 3 shows the results for the period without tilt‐control of the gPhoneX, after drift correction. The remaining signals are quiteflat, with a slight long‐term decrease. The SG residuals are between −24.8 and 5.4 nm s−2(30 nm s−2peak‐to‐peak) with a standard deviation (SD) of 8.1 nm s−2. The gPhoneX residuals are more scattered with 56 nm s−2peak‐to‐peak and a SD of 14.6 nm s−2. The linear correlation coefficient between the two gravimeters residuals is 0.68.
The gravity differences between the two instruments are up to 30 nm s−2(Figure 3b) which is as large as the whole SG signal amplitude. The misfit between the two instruments, estimated as the SD of the differences, is 10.8 nm s−2. If some gravity changes at longer periods than 1 day seem correlated (example on 28 December 2014), the biggest differences between the instruments look incoherent (e.g., beginning of
Figure 2. Drift adjustment at WULG: black lines represent the difference between the gPhoneX and the SG, and the red lines are the adjusted 3rd degree polynomials used to model the drifts. They are individually adjusted for the three periods. For legibility, linear trends have been subtracted:−337.1 nm·s−2·day−1until February 2015 (when tilt not controlled yet) and−47.9 nm·s−2·day−1after. The dashed line (May to June 2015) represents an unconsidered period as the SG data were disturbed due to icing around the cold head of the gravimeter (see text section 2.1).
December 2014). Even applying the tilt correction provided by the manufacturer software did not show any improvements, changing the misfit between the two gravimeters residuals and the linear correlation coefficient by less than 4%. This means that tilts have to be actively controlled and their effects on gravity cannot be precisely corrected afterward.
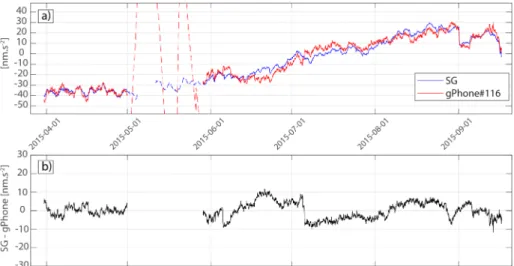
2.2.2. Results With Tilt‐Control
Figure 4 shows the SG and gPhoneX gravity residuals when the tilts are maintained constant for both gravi-meters. Thefirst part is flat with a SD of 2.7 and 3.7 nm s−2for the SG and the gPhoneX, respectively. The second part, from May to September, shows a slow and smooth gravity increase of 60 nm s−2due to hydro-logical loading, increasing the SD to 16.2 and 16.6 nm s−2for the SG and gPhoneX, respectively. The misfit between the gPhoneX and the SG signals are 2.2 and 4.7 nm s−2for thefirst and second parts, respectively. The gPhoneX catches most of the short‐term variations as well as the SG. For example, both gravimeters recorded a−15 nm s−2steep decrease due to a rainfall event in September 2015. The linear correlation
Figure 3. Results in Walferdange when tilt is not controlled. (a) Time series from OSG‐CT040 (blue line) and gPhoneX#116 (red line) from November 2014 to January 2015. (b) OSG‐CT040—gPhoneX#116 differences. Two offsets induced by the instrument re‐leveling were corrected in the gPhoneX gravity time series (−106 and −26 nm s−2on 18 November 2015 and 9 December 2014, respectively).
Figure 4. Walferdange results with tilt‐control activated. (a) OSG‐CT040 (blue line) and gPhoneX#116 (red line) from April 2014 to October 2015. The dashed lines represent the unprocessed period with the SG gap due to a cold head pro-blem and the gPhoneX relaxation. (b) OSG‐CT040—gPhoneX#116 gravity differences.
10.1029/2019JB018276
coefficients between the two instruments are 0.80 and 0.96 for the first and the second parts, respectively. The differences between the two instruments do not exceed 10 nm s−2(Figure 4b). Moreover, the differences do not increase with time, proving the long‐term stability as well as the fact that a 3rd degree polynomial to model the instrumental drift is a justified choice for a 100‐days record. A part of the difference comes from small offsets of maximum 10 nm s−2, correlated with offsets in the gPhoneX ambient temperature records. Although the temperature is very stable in the mine, the vault temperature varied due to visits or installa-tions of other equipment like the absolute gravimeter.
All the results of the experiment in Walferdange are summarized in Figure 5. It shows SG versus gPhoneX#116 hourly residuals (after removal of linear and polynomial drift) for both tilt uncontrolled (black) and tilt controlled (red & blue dots) periods. The positive impact of the tilt control of the gPhoneX#116 appears clearly; when the tilt control of the gPhoneX#116 is turned on, data clouds on the XY plot tend to stick closer to the 1:1 line, which represents the perfect correlation and the data scatters decrease. This is the case even though the time series is longer for the controlled period.
The conclusion of the Walferdange experiment is that hourly gPhoneX#116 performances get closer to the ones of the SG at both short‐ and long‐term, if tilts are controlled and if the instrumental drift can be properly modeled. However, due to the lack of absolute gravity measurements, we used the differences between both data set to estimate the gPhoneX instrumental drift.
3. The GEK Comparison
The WULG shows a range of only 60 nm s−2and lacks signal to interpret to be fully convinced by the poten-tial of the gPhoneX for geophysical monitoring. In the second experiment, conducted in France, larger grav-ity changes occur due to important water storage variations in this karstic region. Unlike in Walferdange, the gravimeters are at the surface and not inside an underground location. In addition, we were able to estimate independently the SG and gPhoneX drifts using absolute gravity measurements. The repetition of the study in such a different environment and with another gravimeter would prove that tilt is unambiguously the ori-gin of the long‐term instability of gPhoneXs.
3.1. Data Pre‐Processing
The GEK observatory is a hydro‐geophysical observatory located on the Larzac plateau in the south of France. The observatory itself consists of a temperature‐regulated wooden building of 8 by 8 m with concrete pillars to isolate ground‐coupled geophysical instruments. The iGrav#002 is set at the exact center of the building and has operated without interruption since 2011. Originally, the SG was part of a project to study the specific hydrology in this karstic region (Fores et al., 2017). The gPhoneX #032 recorded from July 2011
Figure 5. SG residuals versus gPhoneX residuals at the WULG. The black dots are hourly measurements when the tilt of the gPhoneX is not controlled. Red and blue dots are hourly measurements for the two parts when tilt is controlled.
to December 2012 on a concrete pillar, 3 m to the east from the iGrav#002 and 1 m away from the edge of the building. This instrument was tilt‐controlled at all times. The tilts were maintained between ±1 ADU. In addition, the FG5#228 absolute gravimeter was used to perform several measurements at the site with an accuracy of 20 nm s−2(Niebauer et al., 1995).
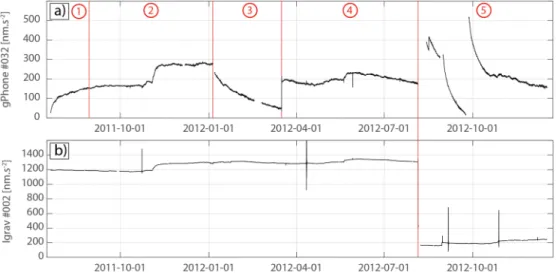
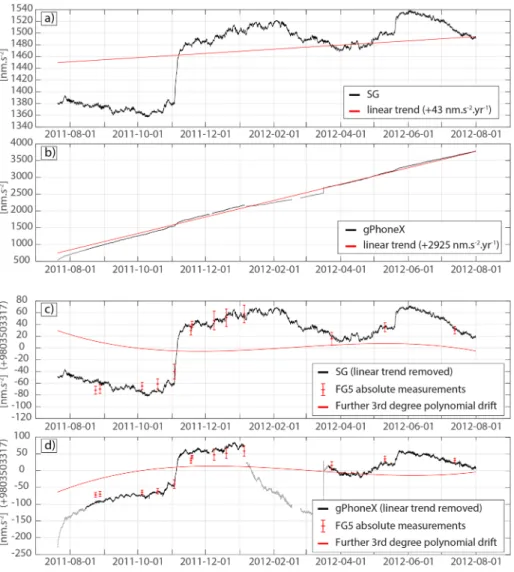
Figure 6 shows the gravity time series of both relative gravimeters in the GEK. For legibility, we subtracted a linear trend of 3,000 nm·s−2·year−1from the gPhoneX#32 (Figure 6a). As in Walferdange, earth tides were estimated from the SG time series analysis (see Fores et al., 2017). The time series were corrected for polar motion and atmospheric pressure effects. For each gravimeter, we used their own pressure readings to esti-mate their pressure admittance factors of −2.80 and −3.35 nm·s−2·hPa−1 for the iGrav and the gPhoneX#032, respectively. Finally, the hourly iGrav data needed some editing during a few seismic sequences as the amplitude of the seismic signal exceeded its dynamic range (Figure 6b). This was not neces-sary for the gPhoneX#32 (Figure 6a), as it has a larger dynamic range, the seismic events are removed by the low‐pass filtering (Niebauer et al., 2011).
We divided the gPhoneX#32 time series intofive parts (see Figure 6a). The first part, from July to mid‐ August 2011, shows most of the gPhoneX initial relaxation after its installation. The second and the fourth parts (15 August 2011 to 4 January 2012; 22 March 2012 to 1 August 2012) show normal operational condi-tions. The third part shows a long relaxation, which started after the electrical power was turned off to carry out of magnetic resonance soundings on 7 January 2012 (Mazzilli et al., 2016). Finally, from August 2012 to the end (Part 5), several power shutdowns induced by storms generated gaps followed by relaxations in the gPhoneX#32 time series and an important offset of about−1,000 nm s−2in the iGrav time series.
Consequently, we only compared Parts 2 and 4. We excluded the Parts 1 and 3 affected by relaxations (due to installation and power shortages, respectively) and the stormy Part 5. This led us to a comparison on a total of 276 days spread over one year (143 + 133 days, during Parts 2 and 4, respectively). Unlike in the WULG, several AG measurements are available at the GEK to constrain the instrumental drifts. A 3rd degree poly-nomial drift was independently adjusted on both relative gravimeters time series tofit 12 FG5 absolute grav-ity measurements (AG values can be found in Fores et al., 2017). We estimated a unique drift considering Parts 2 and 4 together at the same time (Figure 7).
Figure 7 shows the drift estimation for both instruments, decomposed into a linear and a subsequent 3rd polynomial function of time. The linear drift of the SG is small, +43 nm·s−2·year−1(a). The misfit between SG and AG data is 9.8 nm s−2after the linear correction. The following 3rd degree polynomial (c) slightly decreases this misfit to 7.4 nm s−2and is only justified by the need to have the same processing for both instruments. As expected, the gPhoneX drift is much larger than the SG one (b), but it is also mainly linear over the full year of measurements. After the correction of a linear trend, the misfit with AG data is already
Figure 6. Hourly gPhoneX (a) and iGrav (b) time series after removing polar motion effects, earth tides and atmospheric pressure effects. For legibility, a linear trend of 3,000 nm·s−2·year−1is subtracted from the gPhoneX signal.
10.1029/2019JB018276
only 16 nm s−2. The application of a 3rd degree decreases this misfit to 8 nm s−2(d) which is comparable to the SG/AG misfit. One can see that the main contribution of the 3rd degree polynomial is to correct the end of the initial relaxation that persisted few months after thefirst 30 discarded days.
3.2. Results
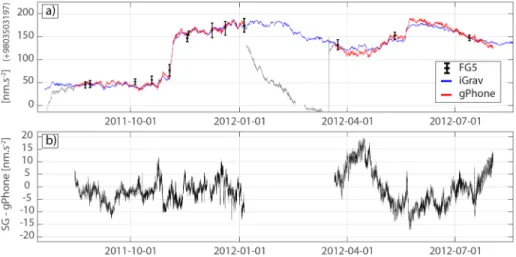
Figure 8 shows the gPhoneX and iGrav residuals after instrumental drift corrections (a), and their differ-ences (b). Both iGrav and gPhoneXfit well the absolute measurements. The main gravity change consists in a steep increase in November 2011, induced by a 200‐mm precipitation event, and a smaller one in May 2012.
Differences between gPhoneX and iGrav rarely exceed 10 nm s−2, with 90% of the 6,521 hourly values being between [−10 ; 10] nm s−2and 96% between [−10; 15] nm s−2. It is slightly worse after the second relaxation (Figures 8b and 9). All the small gravity changes, particularly rainfall‐induced increases, are well recorded by both instruments. The match between the iGrav and the gPhoneX data is excellent at both short‐ and long‐terms. The misfit between the iGrav and gPhoneX signals (the SD of the differences) is only 6 nm s
−2(5 and 8 nm s−2for Parts 2 and 4, respectively) with a linear correlation coefficient of 0.99.
Figure 7. Drift adjustments in the GEK based on AG measurements. (a) SG residuals (black line) and linear drift (red line). (b) gPhoneX residuals (black line) and linear drift (red line). (c) SG residuals after the removal of the linear drift (black line), further 3rd degree polynomial drift (red line) and AG data (red dots). (d) gPhoneX residuals after thefirst linear drift correction (black line), further 3rd degree polynomial drift (red line), and AG data (red dots). gPhoneX data during Intervals 1 and 3 (gray parts of the time series) were not considered when evaluating the coefficients of linear and polynomial components of the drift.
Unlike for the gPhoneX#116 in Walferdange, we did not observe any spurious offsets in the gPhoneX#32 ambient temperature and gravity readings although the room temperature is not well regulated in the GEK as compared to the WULG mine. Variations of ambient temperature within ±2 °C were recorded by the gPhoneX. Despite the thermal insulation, ambient temperature sensitivity of metal spring gravimeters have been reported in the past by, for example, Andò and Carbone (2001). In fact, we were not able to reduce the misfit—already small—with a linear admittance between gravity and external temperature changes. As for the WULG comparison, we summarize the results with a SG versus AG hourly residuals plot (Figure 9), with the dashed lines marking out the 10 nm s−2misfit band. The “gap” with a few points between −40 and 0 nm s−2corresponds to the sharp increase due to extreme rains in November 2011. Most of the points out of the ±10 nm s−2band come from the second period, from March to August 2012 (red points).
4. Discussion
In Table 1, we give an overview of the different experiments and results of the comparison between gPhoneXs and SGs at the WULG and the GEK. Clearly, the gPhoneX long‐term stability benefits from tilt control, as shown by the comparison in Walferdange. When tilts are controlled, the long‐term stability of
Figure 8. (a) iGrav (blue line) and gPhoneX (red line) gravity residuals after correction for nonlinear drift effect, modeled through a 3rd degree polynomial. The coefficients of the polynomial functions were deduced using the absolute FG5 measurements (black markers). (b) iGrav—gPhoneX gravity differences.
Figure 9. SG hourly residuals versus gPhoneX hourly residuals in the GEK (blue and red dots). Black and dashed lines represent the perfect correlation and the 10 nm s−2misfit band.
10.1029/2019JB018276
the gPhoneX increases and performances get closer to the one of a SG after decimation, low‐pass filtering and nonlinear drift correction.
Riccardi et al. (2011) made a meticulous comparison of a tilt‐uncontrolled gPhoneX and an SG over 300 days and with eight absolute FG5 measurements. These authors showed a misfit (also estimated by the SD) of 9 nm s−2between their SG series and AG measurements, and a misfit of 14 nm s−2between hourly gPhoneX time series and AG after a 5th degree polynomial reduction. They conclude that SGs show better results than gPhoneXs, no matter the degree of the drift one applies. In the GEK observatory, we achieved a similar misfit of 7 nm s−2between AG and SG on a comparable basis of 276 days and 13 AG measurements. However, we get similar performances with the tilt‐controlled gPhoneX#116 after removing a 3rd degree polynomial drift. On two sites, the GEK and the WULG, we obtained stable time series with tilt‐controlled gPhoneXs. The misfit with respect to SG data is mostly between ±10 nm s−2. Moreover, at the GEK observatory, some of the misfits are not due to instrumental noises but, rather, to the building masking effect on rainfall infiltra-tion (Deville et al., 2012). Indeed, the building acts as an umbrella, reducing the immediate gravity effect of a rainfall event as no water falls directly beneath the gravimeters. Figure 10a show the mask effect on the November 2011 intense rain event (2–6 November). One can see that the theoretical effect of the rain (black line), which is the effect of an infinite slab of water, is not immediately seen by the iGrav and the gPhoneX (red & blue lines). They catch‐up the slab effect in the following weeks as the water infiltrates deeper, enter-ing in their sight.
Obviously, the delay is not the same depending on the gravimeter positions inside the building. As the gPhoneX is closer to the edge of the building, it undergoes a lower mask effect than the iGrav, which is at the center, and it can explain some of the misfits between the instruments. For example, the gPhoneX shows a response 13 nm s−2higher than the iGrav to a medium rain event in October 2011, just before the intense November event (Figures 10a and 10c). The soil was particularly dry after summer 2011, leading water to be retained in the shallowest depths. This amplifies the mask effect (Fores et al., 2017) and here it highlights the importance of the instrument position to monitor environmental signals.
As another example, the gPhoneX records that the rain event in May 2012 is actually double, with afirst event on 20 and a second at the end of on 21 (Figures 10b and 10d). This is only due to its less‐masked posi-tion in the observatory. These examples highlight the importance of taking into account the instruments position depending on the target signal or for instrument comparisons. Nowadays, hydro‐gravimetric studies (Reich et al., 2019) recognize the importance of the mask effect and include it in modeling. This example of the mask effect in the GEK also shows that aside from the long‐term monitoring made possible by the tilt control, very subtle short‐term effects can be investigated with a gPhoneX.
Despite this differential mask effect, the linear correlation coefficient between the iGrav and the gPhoneX time series is still excellent in the GEK laboratory, above 0.99. It shows that SG can be suitable for hydrolo-gical studies if power outages are prevented. Indeed, the main gPhoneXs drawback remains: the slightest power outage induces several weeks of relaxation, unlike SGs, that can evaporate helium to maintain the
Table 1
Results for the WULG and GEK Comparisons.
Number of days SG‐gPhoneX misfit (SD) [nm s−2] r SG‐AG misfit (SD) [nm s−2] gPhoneX‐AG misfit (SD) [nm s−2] WULG
Tilt NOT controlled
53 11.8 0.68 / /
WULG
Tilt‐controlled, Part 1
32 2.2 0.80 / /
WULG
Tilt‐controlled, Part 2
112 4.7 0.96 / /
GEK Tilt controlled
276 (over 354) 6.0 0.99 7.4 7.7
Note. It presents the misfits (standard deviation, SD) and the linear correlation coefficients (r) between the SGs and the gPhoneXs. For the GEK comparison, the misfits with AG are also given.
temperature and keep the levitation. We also lose the very high frequencies as the gPhoneX data have to be decimated to hourly measurements to reduce the noise.
Other environmental variables may play a much lesser role in the gravity stability of the gPhoneX. Spurious temperature offsets are observed in the WULG, but there is no clear ambient temperature effect on gravity in the GEK, where temperature varied for ±2 °C. These effects are small, and the results remain excellent. However, we cannot predict the response of the gPhoneX to larger temperature changes based on our experi-ments. This question should be addressed through a specific experiment before installing a gPhoneX in a location where drastic changes of temperature are expected, to be sure that theμgal long‐term stability can be obtained in such cases.
In our comparisons, we shown that a 3rd degree polynomial is more than enough to represent the gPhoneXs instrumental drifts over one year. This 3rd degree is already not strictly instrumental drift and takes into account the very long effect of the initial relaxation, as well as minor relaxations induced by any perturba-tions (human intervenperturba-tions, power failures, manual re‐leveling, etc.). This sum of relaxations may be the rea-son why high‐degree polynomials are sometimes needed in literature. If all precaution are taken, we can expect only one initial relaxation followed by a quasi‐linear drift the first year. Although we cannot prove that it will remain the same for longer intervals, the drift is not expected to change abruptly. Thus, we recom-mend to never correct tilt‐controlled gPhoneXs with a higher than 3rd degree polynomial in normal opera-tion. Otherwise, one faces the risk of removing geophysical signals.
5. Conclusion
We demonstrate that tilt controlled gPhoneXs can supply data with quality that compares to that of data from SGs. Our tests consisted in comparing the time series of gPhoneXs and precise SGs. We used two dif-ferent gPhoneXs in two difdif-ferent sites and contexts for validation. The misfit between the data from SG and gPhoneX installed in thefirst site ranges between 12 and 5 nm s−2, when tilt control is turned on, over a period of 110 days. On the second site, the misfit between SG and gPhoneX data is 6 nm s−2over 276 days, with more than 90% of hourly differences below 10 nm s−2, and a linear correlation coefficient of 0.99. A part of the difference between SG and gPhoneX data is not due to instrumental noise, but, rather, to the points
Figure 10. Building mask effects on rainfalls. (a) gPhoneX residuals (red line), iGrav residuals (blue line) and the theore-tical effect of the precipitations (Bouguer slab, black line) during autumn 2011. (b) gPhoneX (red line) and iGrav residuals (blue line) in May 2012. (c) and (d) hourly rainfalls. A small offset has been applied on the gPhoneX to match the iGrav and highlight the different responses (+5 and−5 nm s−2in 2011 and 2012, respectively).
10.1029/2019JB018276
where each meter is installed. Our results prove that the gPhoneX is able to track gravity changes within 10 nms−2, over a wide range of time scales, if a few conditions are met: (1) a system that actively maintains the verticality of the gravimeter is used; (2) thefirst month after the installation of the gravimeter (the most affected by relaxation effects) is not included in the time series that is used to study geophysical processes; (3) installation is equipped with an UPS system to avoid that power shortages induces further anomalies due to relaxations; and (4) absolute gravity measurements are accomplished at a suitable rate to recognize possible nonlinear components of the instrumental drift.
References
Andò, B., & Carbone, D. (2001). A methodology for reducing the effect of meteorological parameters on a continuously recording gravity meter. IEEE Transactions on Instrumentation and Measurement, 50(5), 1248–1254. https://doi.org/10.1109/19.963193
Calvo, M., Hinderer, J., Rosat, S., Legros, H., Boy, J.‐P., Ducarme, B., & Zürn, W. (2014). Time stability of spring and superconducting gravimeters through the analysis of very long gravity records. Journal of Geodynamics, 80, 20–33. https://doi.org/10.1016/j. jog.2014.04.009
Carbone, D., Cannavò, F., Greco, F., Reineman, R., & Warburton, R. J. (2019). The benefits of using a network of superconducting gravi-meters to monitor and study active volcanoes. Journal of Geophysical Research: Solid Earth, 124, 4035–4050. https://doi.org/10.1029/ 2018JB017204
Carbone, D., Poland, M. P., Diament, M., & Greco, F. (2017). The added value of time‐variable microgravimetry to the understanding of how volcanoes work. Earth‐Science Reviews, 169, 146–179. https://doi.org//10.1016/j.earscirev.2017.04.014
Deville, S., Jacob, T., Chery, J., & Champollion, C. (2012). On the impact of topography and building mask on time varying gravity due to local hydrology. Geophysical Journal International, 192(1), 82–93. https://doi.org/10.1093/gji/ggs007
Fores, B., Champollion, C., le Moigne, N., Bayer, R., & Chéry, J. (2017). Assessing the precision of the iGrav superconducting gravimeter for hydrological models and karstic hydrological process identification. Geophysical Journal International, 208(1), 269–280. https://doi.org/ 10.1093/gji/ggw396
Fores, B., Champollion, C., Mainsant, G., Albaric, J., & Fort, A. (2018). Monitoring saturation changes with ambient seismic noise and gravimetry in a karst environment. Vadose Zone Journal, 17(1). https://doi.org/doi:10.2136/vzj2017.09.0163
Francis, O., Baumann, H., Ullrich, C., Castelein, S., Camp, M. V., Sousa, M. A. D., et al. (2015). CCM. G‐K2 key comparison. Metrologia, 52 (1A), 07009. https://doi.org/10.1088/0026‐1394/52/1A/07009
Francis, O., & Van Dam, T. (2002). Evaluation of the precision of using absolute gravimeters to calibrate superconducting gravimeters. Metrologia, 39(5), 485.
Goodkind, J. M. (1999). The superconducting gravimeter. Review of Scientific Instruments, 70(11), 4131–4152. https://doi.org/10.1063/ 1.1150092
Hasan, S., Troch, P. A., Bogaart, P. W., & Kroner, C. (2008). Evaluating catchment‐scale hydrological modeling by means of terrestrial gravity observations. Water Resources Research, 44, W08416. https://doi.org/10.1029/2007WR006321
Hector, B., Hinderer, J., Séguis, L., Boy, J. P., Calvo, M., Descloitres, M., & Riccardi, U. (2014). Hydro‐gravimetry in West‐Africa: First results from the Djougou (Benin) superconducting gravimeter. Journal of Geodynamics, 80, 34–49. https://doi.org/10.1016/j. jog.2014.04.003
Hinderer, J., Florsch, N., Mäkinen, J., Legros, H., & Faller, J. E. (1991). On the calibration of a superconducting gravimeter using absolute gravity measurements. Geophysical Journal International, 106(2), 491–497. https://doi.org/10.1111/j.1365‐246X.1991.tb03907.x Kennedy, J., Ferré, T. P. A., Güntner, A., Abe, M., & Creutzfeldt, B. (2014). Direct measurement of subsurface mass change using the
variable baseline gravity gradient method. Geophysical Research Letters, 41, 2827–2834. https://doi.org/10.1002/2014GL059673 Lampitelli, C., & Francis, O. (2010). Hydrological effects on gravity and correlations between gravitational variations and level of the
Alzette River at the station of Walferdange, Luxembourg. Journal of Geodynamics, 49(1), 31–38. https://doi.org/10.1016/j. jog.2009.08.003
Mazzilli, N., Boucher, M., Chalikakis, K., Legchenko, A., Jourde, H., & Champollion, C. (2016). Contribution of magnetic resonance soundings for characterizing water storage in the unsaturated zone of karst aquifers. Geophysics, 81(4), WB49–WB61. https://doi.org/ 10.1190/geo2015‐0411.1
Micro‐g LaCoste, Inc. (2008). gPhone/P.E.T Hardware Manual V1 Micro‐g LaCoste, Inc. (2013). gPhoneX Hardware Manual V3.1
Niebauer, T. M., MacQueen, J., Aliod, D., & Francis, O. (2011). Monitoring earthquakes with gravity meters. Geodesy and Geodynamics, 2(3), 71–75. https://doi.org/10.3724/SP.J.1246.2011.00071.2
Niebauer, T. M., Sasagawa, G. S., Faller, J. E., Hilt, R., & Klopping, F. (1995). A new generation of absolute gravimeters. Metrologia, 32(3), 159.
Reich, M., Mikolaj, M., Blume, T., & Güntner, A. (2019). Reducing gravity data for the influence of water storage variations beneath observatory buildings. Geophysics, 84(1), EN15–EN31. https://doi.org/10.1190/geo2018‐0301.1
Riccardi, U., Rosat, S., & Hinderer, J. (2011). Comparison of the Micro‐g LaCoste gPhone‐054 spring gravimeter and the GWR‐C026 superconducting gravimeter in Strasbourg (France) using a 300‐day time series. Metrologia, 48(1), 28.
Rosat, S., & Hinderer, J. (2018). Limits of detection of gravimetric signals on Earth. Scientific Reports, 8(1), 15324. https://doi.org/10.1038/ s41598‐018‐33717‐z
Rosat, S., Hinderer, J., Crossley, D., & Boy, J. P. (2004). Performance of superconducting gravimeters from long‐period seismology to tides. Journal of Geodynamics, 38(3‐5), 461–476. https://doi.org/10.1016/j.jog.2004.07.005
Tanaka, T., Miyajima, R., Asai, H., Horiuchi, Y., Kumada, K., Asai, Y., & Ishii, H. (2013). Hydrological gravity response detection using a gPhone below‐and aboveground. Earth, Planets and Space, 65(2), 59.
Torge, W. (1989). Gravimetry, (p. 465). Berlin: Gruyter. https://doi.org/10.5047/eps.2012.06.012
Van Camp, M., & Francis, O. (2007). Is the instrumental drift of superconducting gravimeters a linear or exponential function of time? Journal of Geodesy, 81(5), 337–344. https://doi.org/10.1007/s00190‐006‐0110‐4
Van Camp, M., Viron, O., Watlet, A., Meurers, B., Francis, O., & Caudron, C. (2017). Geophysics from terrestrial time‐variable gravity measurements. Reviews of Geophysics, 55, 938–992. https://doi.org/10.1002/2017RG000566
Acknowledgments
We are grateful to Micro‐g Lacoste Inc. for the provision of the gPhoneX #116 used in this study. We thank the French observatory OSU OREME observatory and the National observation system (SNO) H+. The FG5 absolute gravimeter used in the GEK belongs to INSU‐RESIF‐Gmob gravity facilities. All the gravity and tilt data sets are available in supplementary material. The GEK iGrav and meteorological data are also freely available on the OREME website: http://data.oreme. org/gek/home. We sincerely thank two anonymous reviewers for their constructive comments and improvements to the manuscript.
Warburton, R. J., Pillai, H., & Reineman, R. C. (2010). Initial results with the new GWR iGrav™ superconducting gravity meter. In Extended Abstract Presented at 2nd Asia Workshop on Superconducting Gravimetry Taipei, Taiwan.
Watlet, A. (2017). Hydrogeophysical monitoring of groundwater recharge processes through the karst vadosezone at Rochefort (Belgium). (Doctoral dissertation). UMONS‐ROB: University of Mons, Royal Observatory of Belgium.
Wenzel, H. G. (1996). The nanogal software: Earth tide data processing package ETERNA 3.30. Bulletin d'Informations Mareés Terrestres, 124, 9425–9439.