HAL Id: hal-00296940
https://hal.archives-ouvertes.fr/hal-00296940
Submitted on 6 Feb 2006
HAL is a multi-disciplinary open access
archive for the deposit and dissemination of
sci-entific research documents, whether they are
pub-lished or not. The documents may come from
teaching and research institutions in France or
abroad, or from public or private research centers.
L’archive ouverte pluridisciplinaire HAL, est
destinée au dépôt et à la diffusion de documents
scientifiques de niveau recherche, publiés ou non,
émanant des établissements d’enseignement et de
recherche français ou étrangers, des laboratoires
publics ou privés.
Robustness of the influence of El Niño on the spatial
extent of tropical drought
B. Lyon
To cite this version:
B. Lyon. Robustness of the influence of El Niño on the spatial extent of tropical drought. Advances
in Geosciences, European Geosciences Union, 2006, 6, pp.207-209. �hal-00296940�
Advances in Geosciences, 6, 207–209, 2006 SRef-ID: 1680-7359/adgeo/2006-6-207 European Geosciences Union
© 2006 Author(s). This work is licensed under a Creative Commons License.
Advances in
Geosciences
Robustness of the influence of El Ni ˜no on the spatial extent of
tropical drought
B. Lyon
International Research Institute for Climate and Society, Columbia University, NY, USA
Received: 16 June 2005 – Revised: 24 November 2005 – Accepted: 23 January 2006 – Published: 6 February 2006
Abstract. It has been well established that drought fre-quently emerges in several tropical regions following the on-set of El Ni˜no. An important characteristic of such droughts is their spatial extent, which has recently been linked to the strength of a particular El Ni˜no event. Here the robustness of this relationship is examined through comparison of results from several gridded precipitation analyses for the global tropics. It is found that there is very good agreement across these datasets, including those which incorporate satellite rainfall estimates, confirming that maximum drought extent in tropical land areas increases nearly linearly with associ-ated maximum sea surface temperature anomalies in the east-central tropical Pacific during El Ni˜no events.
1 Introduction
Observationally-based analyses have clearly established that the development of drought in many tropical land areas around the globe is one manifestation of the El Ni˜no phe-nomenon (e.g., Ropelewski and Halpert, 1987; Mason and Goddard, 2001). Such droughts, sometimes severe, can have serious consequences for human populations within the af-fected regions. It is therefore of both scientific and practical interest to examine how large an influence El Ni˜no has on the development of tropical drought. Previous studies by Dai et al. (1997, 1998) have shown, based on global, gridded anal-yses of the Palmer Drought Severity Index (PDSI), that the leading mode of global variability is related to ENSO. Using a standardized precipitation anomaly index based on monthly precipitation and focusing on tropical land areas only, Lyon (2004) recently reported that the spatial extent of drought is closely tied to the strength of an individual El Ni˜no event. The “strength” of an event was defined as the maximum sea surface temperature (SST) anomaly averaged across the Nino 3.4 region (120–170 W, 5 S–5 N) observed during the life
cy-Correspondence to: B. Lyon
(blyon@iri.columbia.edu)
cle of a given El Ni˜no. Since the spatial distribution of rain-fall observing stations across tropical land areas is irregular, gridded rainfall analyses based on these observations are a less than a perfect representation of actual rainfall. Here the robustness of this latter study is examined by comparing re-sults obtained from a number of different rainfall analyses, including those which incorporate satellite estimates of rain-fall to supplement the sometimes sparse land-based station coverage.
2 Data and methodology
2.1 Data
Two basic types of gridded rainfall analyses were employed: those based solely on observed monthly precipitation at land-based recording stations; and merged analyses which incor-porate both station data and satellite estimates of monthly rainfall. Analyses of the first type include the precipita-tion reconstrucprecipita-tion over land (PRECL; Chen et al., 2002) dataset on a 2.5◦×2.5◦ latitude/longitude grid; two analy-ses from the Climate Research Unit at the University of East Anglia (New et al., 2000; Hulme, 1994), at 0.5◦×0.5◦ and 2.5◦×3.75◦latitude/longitude resolution respectively; and the Climate Anomalies Monitoring System (CAMS; Ro-pelewski et al., 1984) dataset from the US Climate Predic-tion Center (CPC) on a 2.0◦×2.0◦ latitude/longitude grid. Of the second type are the Merged Analysis of Precipita-tion from the CPC (CMAP; Xie and Arkin, 1996) and the merged analysis from the Global Precipitation Climatology Project (GPCP; Huffman et al., 1997), both on a 2.5◦×2.5◦
latitude/longitude grid. The spatial domain for all datasets used is 30◦S–30◦N, land areas only. The base period for computing monthly anomalies is 1961–1990 for the land-based datasets, and 1979–2003 for the merged analyses. The period of analysis is from 1950–1998 for the land-based anl-yses, and 1979–2003 for the merged analyses.
208 B. Lyon: Robustness of the influence of El Ni˜no 0 5 10 15 20 25 0.5 0.75 1 1.25 1.5 1.75 2 2.25 2.5 2.75
Maximum Nino 3.4 SST Anomaly (deg. C)
PRECL NEW CAMS HULME % T ropical Land Area r = 0.80, m = 6.7
Fig. 1. Maximum percentage of tropical land area (excluding desert
regions) experiencing intermediate drought (<−1.5 index value) as a function of associated maximum SST anomaly (◦C) for the Nino 3.4 region during the 10 strongest El Ni˜no events during 1950– 1998. Symbols in upper-left indicate the various rainfall analyses used.
The SST data used was from Smith and Reynolds (2003) with a base period of 1961–1990 used for computing monthly anomalies. A 5-month running average was applied to SST anomalies averaged across the Nino 3.4 region. An El Ni˜no event was defined as occurring when the Nino 3.4 SST anomaly exceeded 0.5◦C for at least six consecutive months.
2.2 Defining drought and measuring its spatial coverage Using the methodology of Lyon and Barnston (2005) drought events were defined based on 12-month overlapping sums of weighted, standardized precipitation anomalies,
S12 = 12 X i=1 Pi − Pi σi ! · Pi PA (1)
In Eq. (1), Piis the monthly precipitation of the ith month in
the sum at a given gridpoint, overbars represent climatolog-ical means, and σi is the standard deviation of the monthly
precipitation. PA is the total annual precipitation at a
grid-point, and the weighting factor, Pi/PA, dampens
standard-ized anomalies during climatological dry seasons while em-phasizing those during rainy seasons. The sum S12 is then
itself standardized to obtain a dimensionless indicator of the relative severity of drought (when the index is negative). As in Lyon (2004), three levels of drought severity were consid-ered based on the standardized index: moderate (<−1.0),
in-termediate (<−1.5), and severe (<−2.0). Climatologically
dry regions (deserts) were masked from the analysis. To determine the spatial extent of drought, the three dif-ferent levels of drought severity were considered separately for each dataset. Gridpoints with standardized rainfall index values below a given threshold (i.e., −1.0, −1.5, −2.0) were flagged, weighted by the cosine of their latitude, and the frac-tion of all flagged gridpoints within tropical land areas then computed (expressed as percentages). From these time se-ries, the maximum percentage of land area in drought during
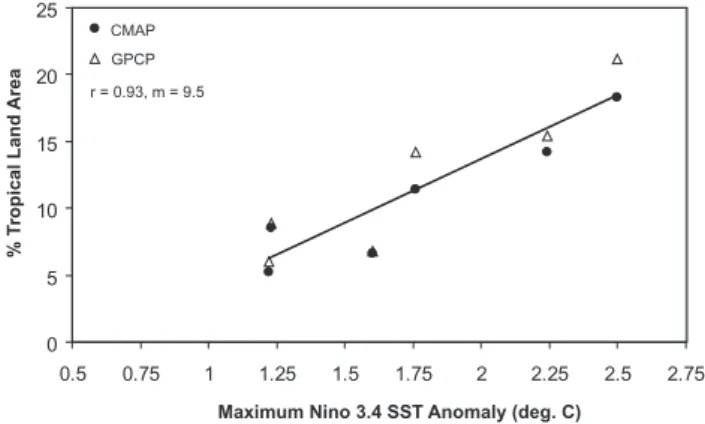
0 5 10 15 20 25 0.5 0.75 1 1.25 1.5 1.75 2 2.25 2.5 2.75 % T ropical Land Area
Maximum Nino 3.4 SST Anomaly (deg. C)
CMAP GPCP r = 0.93, m = 9.5
Fig. 2. As in Fig. 1, but based on data from two merged
precipita-tion analyses covering the period 1979–2003.
a particular El Ni˜no event was obtained and related to the associated maximum in SST anomaly in the Nino 3.4 region.
3 Results
The 10 strongest El Ni˜no events during 1950–1998 were used to produce Fig. 1 which displays the maximum spatial extent of intermediate drought (standardized rainfall index values
<−1.5) as a function of maximum Nino 3.4 SST anomaly. Analyses of other levels of severity produced similar results. The solid line on the plot is based on a linear regression of the mean values of peak spatial extent measured across the datasets for each El Ni˜no event. The positive slope of the regression line indicates that the spatial extent of drought across the tropics increases as Nino 3.4 SST anomalies (the strength of El Ni˜no events) increase. The linear correlation coefficient is 0.8. Consistent with previous results (based on the New dataset), the spatial extent of drought increases by roughly a factor of two between the weakest and strongest events. The greatest departure from the regression line oc-curs during the 1991–92 El Ni˜no (Nino 3.4 SST anomaly of ≈1.75◦C), particularly for the CAMS dataset, with the other analyses also indicating increased coverage relative to the linear fit.
Figure 2 is the same analysis, but based on the CMAP and GPCP merged precipitation analyses. The two datasets are seen to be in very good agreement, with a linear correla-tion for the average extent between the two exceeding 0.9. Also noteworthy is that the spatial extent of drought during the 1991–92 El Ni˜no (again, with associated Nino 3.4 SST anomaly of ≈1.75◦C) is in much closer agreement with the linear fit to the data than for the purely land-based analyses shown in Fig. 1.
4 Conclusions
Six different gridded rainfall analyses covering tropical land areas within 30◦latitude of the equator were utilized to test the robustness of the relationship between the strength of
B. Lyon: Robustness of the influence of El Ni˜no 209
El Ni˜no events and the peak spatial extent of associated droughts. Each of the datasets indicated an increase in spatial extent of drought with increasing strength of El Ni˜no, confirming earlier results. For all of the datasets, drought extent was found to approximately double between the weakest and strongest El Ni˜no events which have occurred over the past half-century. There is some evidence that satellite estimates of rainfall in the tropics may help in realistically capturing actual amounts, at least to the extent to which the linear regression analyses presented are a true representation of drought characteristics in the tropics. Edited by: P. Fabian and J. L. Santos
Reviewed by: M. Rouault and another anonymous referee
References
Chen, M., Xie, P., Janowiak, J. E., and Arkin, P. A.: Global Land Precipitation: A 50-yr Monthly Analysis Based on Gauge Obser-vations, J. Hydrometeor., 3, 249–266, 2002.
Dai, A., Fung, I. Y., and Del Genio, A. D.: Surface observed global land precipitation variations during 1900–88, J. Climate, 10, 2493–2962, 1997.
Dai, A., Trenberth, K. E., and Karl, T. R.: Global variations in drought and wet spells: 1900–1995, Geophys. Res. Lett., 25, 3367–3370, 1988.
Huffman, G. J., Adler, R. F., Arkin, P., Chang, A., Ferraro, R., Gru-ber, A., Janowiak, J., McNab, A., Rudolf, B., and Schneider, U.: The Global Precipitation Climatology Project (GPCP) Combined Precipitation Dataset, Bull. Am. Meteor. Soc., 78, 1, 5–20, 1997.
Hulme, M.: Validation of large-scale precipitation fields in Gen-eral Circulation Models, pp. 387-406, in: Global precipitations and climate change, edited by: Desbois, M. and Desalmand, F., NATO ASI Series, Springer-Verlag, Berlin, 466 pp, 1994. Lyon, B.: The strength of El Nino and the spatial
ex-tent of tropical drought, Geophys. Res. Lett., 31, L21204, doi:10.1029/2004GL020901, 2004.
Lyon, B. and Barnston, A. G.: ENSO and the Spatial Extent of In-terannual Precipitation Extremes in Tropical Land Areas, J. Cli-mate, 18, 5095–5109, 2005.
Mason, S. J. and Goddard, L.: Probabilistic precipitation anomalies associated with ENSO, Bull. Am. Meteor. Soc., 82, 619–638, 2001.
New, M. G., Hulme, M., and Jones, P. D.: Representing twentieth-century space-time climate variability. Part II: Development of 1901–1996 monthly grids of terrestrial surface climate, J. Cli-mate, 13, 2217–2238, 2000.
Ropelewski, C. F. and Halpert, M. S.: Global and Regional Scale Precipitation Patterns Associated with the El Nino/Southern Os-cillation, Mon. Wea. Rev., 115, 1606–1626, 1987.
Ropelewski, C. F., Janowiak, J. E., and Halpert, M. S.: The Climate Anomaly Monitoring System (CAMS), Climate Anlaysis Cen-ter, NWS, NOAA, Washington, DC, 39 pp., available from the Climate Prediction Center, Camp Springs, MD 20746, 1984. Xie, P. and Arkin, P. A.: Analysis of global monthly precipitation
using gauge observations, satellite estimates and numerical pre-dictions, J. Climate, 9, 840–858, 1996.