Driving Cycle Time Reduction Through An Improved Material Flow Process
In The Electronics Assembly Manufacturing Cell
by Paul Millerd
B.S. Management and Engineering for Manufacturing, University of Connecticut, 2007
SUBMITTED TO THE MIT SLOAN SCHOOL OF MANAGEMENT AND THE ENGINEERING SYSTEMS DIVISION IN PARTIAL FULFILLMENT OF THE REQUIREMENTS FOR THE
DEGREES OF MASTER OF BUSINESS ADMINISTRATION AND
MASTER OF SCIENCE IN ENGINEERING SYSTEMS
IN CONJUNCTION WITH THE LEADERS FOR GLOBAL OPERATIONS PROGRAM AT THE MASSACHUSETTS INSTITUTE OF TECHNOLOGY
June 2012
C 2012 Paul Millerd. All rights reserved.
The author hereby grants to MIT permission to reproduce and to distribute publicly paper and electronic copies of this thesis document in whole or in part
in any medium now known or hereafter created.
Z/ Is Signature of Author
ARCHIVES
MASSACHUSETTS INSTTUYV OF TECHNOLOG'YJUN
2012
1
UBRAR IES
V V Engineering May 11, 2012 Systems Division MIT Sloan School of Management Certified byRoy Welsch, Thesis Supervisor Professor of Statistics and Management Science and Engineering Systems Certified by
DanieWhitnyThesis Supervisor Senior Lecturer, Engineering Systems Division Accepted by
Oli de Week, Chair, Engineering Systems Education Committee Associate Professor, Aeronautics and Astronautics and Engineering Systems Division Accepted by
Maura Herson Director of MBA Program, MIT Sloan School of Management
Driving Cycle Time Reduction Through An Improved Material Flow Process
In The Electronics Assembly Manufacturing Cell
by Paul Millerd
Submitted to the MIT Sloan School of Management and the Engineering Systems Division on May 11, 2012 in Partial Fulfillment of the Requirements for the Degrees of Master of Business Administration and
Master of Science in Engineering Systems
Abstract
Many companies have implemented lean and six sigma programs over the past twenty years. Lean has been a proven system that has eliminated waste and created value at many companies throughout the world. Raytheon IDS's lean program, "Raytheon Six Sigma" became a top priority in the past ten years at the Integrated Air Defense Center (IADC) in Andover, MA. However, as Raytheon's corporate goals state, they want to take this further and bring "Raytheon Six Sigma" to the next level, fully engaging customers and partners.
A focus of this continuous improvement effort was the Electronics Assembly Rack manufacturing cell, which was experiencing high levels of cycle time variability. To help reduce cycle times within the cell, a continuous improvement project was undertaken to improve the material flow process. A current state
analysis of the process showed an opportunity to improve process standardization and prioritization while lowering inventory levels. In addition to working with managers from EA to evaluate the material flow process, a kitting cart was developed with a cross functional project team to serve as a tool to help improve the process. Although the improvements were not rolled out to the entire cell during the project, a successful pilot was conducted that helped improve engagement with operators and create a path for future success.
Thesis Supervisor: Roy Welsch
Title: Professor of Statistics and Management Science and Engineering Systems Thesis Supervisor: Daniel Whitney
Acknowledgments
First, I would like to thank my LGO classmates. They have been an incredible support network and have made the entire two year experience a complete joy.
Second, I would like to thank the people I worked with at Raytheon, especially Mike and Justin, who helped frame my thinking and kept my project marching forward throughout the six months.
Finally, I'd like to thank friends and family for always being supportive of my commitment to ongoing education through the Leaders for Global Operations program.
Table of Contents
A b stract ... 3 Acknowledgm ents...5 Table of Contents ... 7 List of Figures ... 10 List of Tables ... 11 1 Background ... 12 1.1 Industry Overview ... 121.2 Com pany Overview ... 13
1.3 Facility Description...14
1.4 Electronics A ssem bly (EA) Description ... 14
1.5 FM DC Area Description...14
1.6 Organizational Structure ... 15
1.7 Tauber Project, Sum m er 2010... 17
1.8 EA Rack A ssem bly Cell Description...18
1.9 Chapter Sum m ary...21
1.10 Thesis Overview ... 21
2 Best Practices in Lean ... 22
2.1 H istory of lean practices...22
2.2 Lean in the Defense Industry ... 23
2.3 Lean m anufacturing best practices... 24
2.4 Chapter Sum m ary...25
3 M otivation and Problem Statem ent...27
3.1 M otivation...27
3.2 Problem Statem ent ... 28
4 Current State Analysis of Raytheon IADC and EA ... 29
4.1 Analysis of other IADC manufacturing cells... 29
4.2 Definition of Cycle Time...29
4.3 A nalysis of Cycle Tim e D ata... 30
4.4 Cycle Time Predictability...31
4.5 M odel V alidation... ... 32
4.6 A and A R ack perform ance... 32
4.7 B A Perform anceli ... 33
4.7.1 Excess Inventory m. ac... 34
4.7 .2 P rioritization ... 35
4.7.3 Lack of continuous process flow...36
4.8 D iscussion of Incom plete K its... 38
4.9 C hapter Sum m ary ... 39
5 Improving the material flow process in BA Rack ... 40
5.1 Project Goals ... 40
5.2 Define the material flow processflw... ... ... .... 40
5.3 Understand the symptoms... 41
5.4 Analyze ... 44
5.4.1 K it com plexity ..com .lte ... ... 44
5.4.2 Assembly sizes ... 44
5.4.3 Operator Input ... 44
5.4.4 O bservation .. ... 4 5 5.5 Pilot Experiment flw ro e sin... A ... 46
5.5.1 C on cept ... 46
5.6 Ideal State Process...49
5.7 Results...50
5.8 Chapter Sum m ary...51
6 M anagem ent im plications ... 52
6.1 Three Lenses A nalysis ... 52
6.1.1 Strategic D esign ... 52
6.1.2 Political ... 53
6.1.3 Cultural...53
6.2 Chapter Sum m ary...54
7 Recom m endations for future continuous improvem ent efforts... 56
7.1 Im prove coordination between EA and FM DC ... 56
7.1.1 Shared M etrics ... 57
7.1.2 Stakeholder A lignm ent... 57
7.2 100% Com m itm ent to first-in first-out production ... 58
7.3 Em brace the next generation production system ... 60
7.4 Align the leadership message with stronger front line problem solving ... 60
List of Figures
Figure 1: Sim plified Organizational Chart... 16
Figure 2: Double bay rack assembly made in the EA rack area... 19
Figure 3: General Build Process for Single, Double and Triple bay racks ... 20
Figure 4: Circuit Card Assembly (CCA) cycle time distribution (Jan 2010 - March 2011) ... 30
Figure 5: Comparison of median and average in cycle time distribution ... 31
Figure 6: Pilot results, build time versus idle time... 38
Figure 7: General process for material flow for single, double and triple bay racks ... 41
Figure 8: C art carrying a triple bay kit...42
Figure 9: C overs rack is unclear...43
Figure 10: Packaging of a single bay kit ... 43
Figure 11: Non value-added time in assembly due to searching and de-trassing ... 46
Figure 12: Kitting cart loaded with a single bay rack ... 47
Figure 13: Improvements to small part kitting ... 48
Figure 14: Improvements to large part kitting ... 49
List of Tables
Table 1: Top ten defense companies globally, by 2009 sales ... 12
Table 2: Breakdown of major assemblies built in EA Rack ... 18
Table 3: Cell Performance Jan 2010 - March 2011... 32
Table 4: EA and EA rack cycle time performance predictions... 33
Table 5: FMDC Performance (May-June 2011)... 33
Table 6: Inventory of single, double and triple bay racks in July 2011 ... 34
Table 7: Build time versus age at completion for EA Racks ... 35
Table 8: Summary of inventory aging by high level radar assembly... 36
Table 9: Summary of build process ... 37
1 Background
This chapter will establish a background for the focus of a six month internship completed at Raytheon IDS as part of the graduation requirements for the Leaders for Global Operations program at MIT. The internship took place within the Electronics Assembly (EA) Rack cell at the Integrated Air Defense Center (IADC) in Andover, MA and focused on improving the material flow process within the cell. This section begins with a background on the larger defense industry and then a deeper dive into the specific cell where the internship took place. In addition, section 1.4 discusses a previous internship completed in the EA Rack cell by Tauber Michigan MBA students and some of the challenges the area has faced after completion of that project.
1.1 Industry Overview
Raytheon is part of the Aerospace and Defense industry. Per the 2009 Stockholm International Peace Research Institute, Raytheon was the sixth largest arms producer in the world as seen below in Table 1 (The Stockholm International Peace Research Institute, 2009).
Arms Sales
Rank Company ($ Millions)
1 Lockheed Martin USA $ 33,430
2 BAE Systems UK $ 33,250
3 Boeing USA $ 32,300
4 Northrup Grumman USA $ 27,000
5 General Dynamics USA $ 25,590 6 Raytheon USA $ 23,080 7 EADS Europe $ 15,930
8 Finmeccanica Italy $ 13,280
9 L-3 Communications USA $ 13,010 10 United Technologies USA $ 11,110
Table 1: Top ten defense companies globally, by 2009 sales
Grumman and Lockheed Martin make up the five and have considerable power and control in the market. When small firms grow, they are often bought by the big five, ensuring their long term survival. Given this dynamic supported by the US Government, the defense industry experiences less intense competition than other industries. This helps explain some of the resistance and skepticism to change discussed
further in Chapter 5 (Chao, 2005).
The current market environment for defense contractors is one of War. The US has major conflicts in Iraq, Afghanistan and smaller operations in several other countries. Pierre Chao, Director of Defense-Industrial Initiatives at the Center for Strategic and International Studies hypothesized that, "In war, schedule matters, and performance and especially cost matter less" (Chao, 2005). However, performance is valued above all else at Raytheon, as evidenced by their technology focused vision statement: "To be the most admired defense and aerospace company through our world-class people, innovation and technology." Within EA, however, schedule was equally important, as they were behind schedule on the Patriot program. This pressure resonated with the front line more as it is a challenge for the operators to understand how their day to day decisions affect high level costs changes.
1.2
Company Overview
Raytheon is a global technology and innovation company that specializes in defense, homeland security and other government markets throughout the world. Raytheon has over 72,000 employees worldwide and generated revenues of $25 billion in 2010. The global headquarters is in Waltham, MA. There are six divisions that make up Raytheon including Integrated Defense Systems (IDS), Intelligence and Information Systems (IIS), Missile Systems (RMS), Network Centric Systems (NCS), Space and Airborne Systems (SAS), and Technical Services (RTS).
The project took place in IDS, which is headquartered in Tewksbury, MA. In 2010 IDS had sales of over
$5.5 billion with 14,800 employees worldwide. Raytheon IDS is responsible for over 1,300 contracts at
Agency, the US Armed Forces, and the Department of Homeland Security. In addition, it serves a number of international customers including Saudi Arabia, United Arab Emirates (UAE), Taiwan and Japan. Due to restrictions on the use of the latest technology for international contracts, products need to be reengineered to meet different contract demands. This adds increased complexity to the supply chain for manufacturing cells, which handle production for multiple countries.
1.3
Facility Description
The project took place in Andover, MA at the IADC. The main program involved in the project was the Patriot Missile Defense system for the Army. Due to new demand from the United Arab Emirates and Taiwan, the program has recently expanded and is dealing with the challenge of ramp up after the line had been shut down for several years.
1.4 Electronics Assembly (EA) Description
EA is a high mix, low volume cell broken up into six sub-cells: Rack, Power Supply, Cabinet, Exciter, Transmitter, and Whole Life. The internship focused primarily on the Rack cell. The supply chain process of the area is incredibly complex, as it supplies multiple programs and receives material through multiple feeder areas and distribution centers. A dedicated distribution center within IADC, the
Fabrication and Materials Distribution Center (FMDC) serves as the last stop for much of the material that is supplied to EA, however there are many exceptions and many parts and materials are delivered directly to EA from outside areas.
1.5 FMDC Area Description
Although under different management, the FMDC area is closely tied to the success of EA.
FMDC reports through the logistics group which reports through the supply chain function. The basic process begins when someone in EA "cuts" or releases a kit in the system. This is usually done long
commits to a 5 day lead time, though this is not achieved for all parts, with actual lead time being wildly variable. As soon as FMDC starts kitting the parts for the assembly, the part is "owned" by EA and the
lead time by which EA is measured would begin. When the kit is complete, there are certain parts that need to be stenciled. Stenciling is a process where markings are added to metal parts. This is a separate area staffed with two operators, but managed by FMDC. The process then calls for the complete kit to recombine in the FMDC area and be sent to the floor to be placed on a rack marked for incoming parts. However, sometimes the incoming rack is completely full of parts and the material handler will place the part wherever there is space. There is no system to notify EA cell leads when these assemblies arrive in EA, making it difficult for them to gage when parts have arrived and in what order.
FMDC measures itself based on its own manual records of cycle time in an excel spreadsheet (discussed more in the next section). It only counts the time when it starts kitting the part until the specific parts are sent to be stenciled.
1.6
Organizational Structure
The organizational structure at Raytheon IDS is the typical matrix type organization that you find within most large companies. Two key functions relevant for this thesis, operations and supply chain, are very distinct, powerful and separate organizations. As seen below in the simplified organization chart (Figure 1), this division begins at the top of the company and continues down to the lower layers of the
III
I
I
I
I
I
I
FI-((L
Figure 1: Simplified Organizational Chart
A major challenge within this organization is the fact that the lower level managers and front line leaders from different functions must make day to day decisions. This means operations cell leads, operators and managers are working together with a production control manager and multiple managers responsible for kitting in FMDC.
As is seen in many matrix organizations, each function has its own distinct goals and metrics making it challenging for cross-functional teams to agree on which metric to maximize or minimize. An example of the mismatch of incentives is the fact that EA is measured on the lead time of the assemblies it produces. This includes the time when an assembly begins the kitting process in FMDC. However, FMDC is only measured on the time it takes to complete the kitting process and the number of parts it is able to kit per day. These different metrics would be fine if both areas are aligned on what to produce, in
L
Manager, FMDC Manager, ProductionControl
VP,1
Opera tions " vp (Jpply ( hiinpera
'tions I e"Ad Senior Director, MFG Senlior Director, Sul[Iy Chain I Dir ector , MF G Electronics Assembly Manager, MFGwhat order, but they are not. This leads both areas to maximize locally, while not sharing the same ultimate goals of doing what is good for the business. This is discussed in more depth in Chapter 4.
1.7 Tauber Project, Summer 2010
This internship and thesis was a follow-up to a project completed by two University of Michigan Tauber Business School interns in the summer of 2010. Their project focused on implementing lean principles in the design and setup of the EA Rack cell to handle a large increase in demand due to the UAE Patriot contract. Prior to this, the cell only had a few operators helping satisfy demand for spare and replacement parts. The team designed the ideal state cell based on future demand. They used historical cycle times and divided the cell into multiple product lines.
The project was a success in the initial roll out, but struggled to achieve the predicted improvement of 30% overall decrease in cycle time (not including FMDC's component of the cycle time) when production ramped up in the fall and winter of 2010. A number of issues limited the potential improvement that the project was able to achieve:
1. Upgraded product: A number of the parts that were in production were replacement parts for old Patriot systems and were not compatible with the new systems ordered by UAE. Thus, a lot of engineering work had to be done up front to change the design. As demand shifted from
engineering to manufacturing, EA faced further challenges as it progressed on its learning curve, as new processes and technology were introduced into the design.
2. Supplier quality: Given that may of the products were first time build, this also meant that suppliers had to invest in their own engineering resources to upgrade their past products or to develop new ones. Supplier quality issues were a major issue in the initial production ramp up and a lot of time had to be spent working with them to receive parts that met specifications. 3. Front line challenges: With increased complexity of the product and supplier challenges, cell
have the extra capacity to focus on improving the cell design or process. Pressure was on front line supervisors to meet strict delivery dates and most people within the business unit worked overtime or extra hours to work towards that goal.
1.8 EA Rack Assembly Cell Description
This internship took place under the direction of the manager of the EA Rack manufacturing cell. At the time of the internship, the cell staffed 40 front line operators on two shifts (14 and 2nd) who build, test and
inspect the various assemblies. The cell runs 12 shifts a week, 2 every weekday and 1 each on Saturday and Sunday.
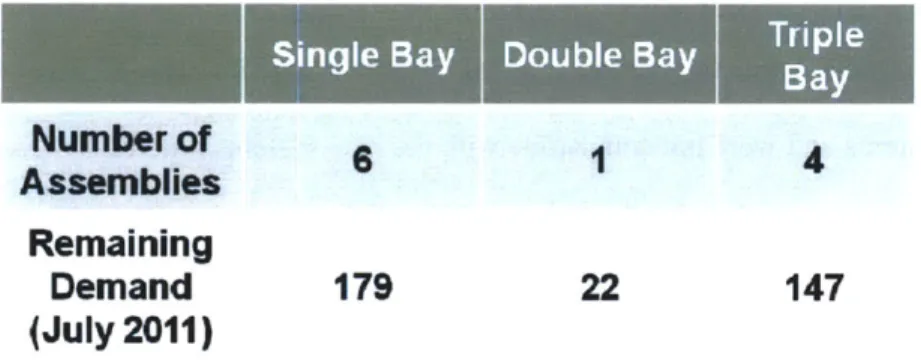
EA Rack is a low volume-high mix environment within EA with over 700 possible assemblies that feed multiple programs, with the majority of the volume feeding Patriot programs. However, this internship focused on 11 unique assemblies, which make up the majority of the current volume in the cell. Table 2 shows the three types of assemblies as well as the remaining demand (in units) for each of the products:
Single Bay
Double Bay
Trpl
Bay
Number of
Assemblies
Remaining
Demand
179
22
147
(July
2011)
Table 2: Breakdown of major assemblies built in EA Rack
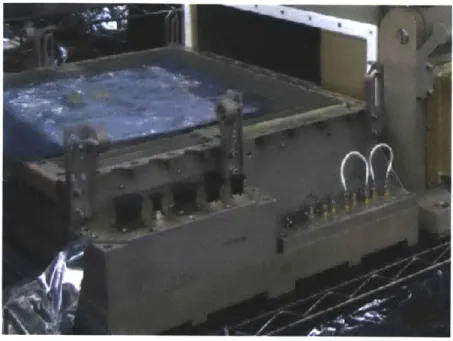
Figure 2: Double bay rack assembly made in the EA rack area
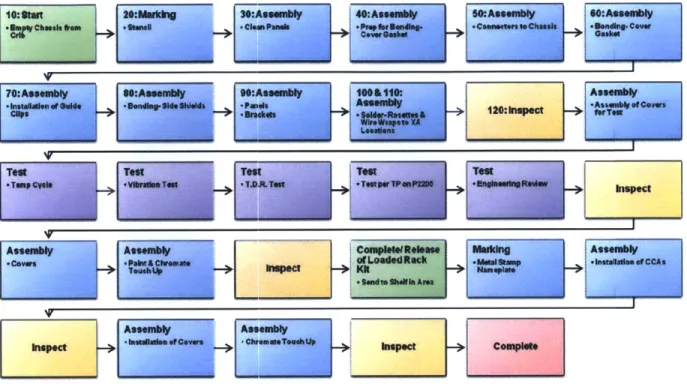
There is a general process for the single, double and triple bay racks that can be seen as outline in Figure 3 below. Each assembly starts out as a "naked" rack and then becomes a "loaded" rack near the end of production. The main difference between the two designations is the addition of a circuit card assembly, installation of covers and final touch up and inspection. Green signifies the start of the process, blue boxes show production, orange shows inspections and purple shows tests:
t20:M g 30:AeMy 40:As5:Assemy 6:Asey
IIAsembtyem Assembly
NMI P
.snm re ca -te'To
Figure 3: General Build Process for Single, Double and Triple bay racks
The nature of the work is very similar to a
job
shop, where individual operators typically work on one assembly throughout the entire build process. At the beginning of the day, operators go to a bench where they typically work every day. There is a system in place so that operators can work at any bench, but this does not happen. After that a cell lead assigns each operator assemblies to work on based on part availability or what they had been building previously. The operator will work on that assembly until the end of the shift, until it is completed or until there is a part shortage or rework required. At the end of the shift, the operator will move the assembly to the appropriate storage rack: work in process, waiting for parts, or ready for inspection. Although there is clear marking for different areas such as incoming, waiting for parts and work in process, operators are unable to follow this process due to a lack of space and will either keep the assembly on a moveable cart or on their bench.Given the low volume, high mix nature of the cell, production is performed using a batch process, treating each assembly as unique, which in turn drives inefficiency and opportunities for improvement.
1.9 Chapter Summary
This chapter has outlined background information on the defense industry and how Raytheon fits within that industry. In addition, a deeper dive into the processes and current status of EA, FMDC and EA Rack cell were presented.
The rest of this thesis will cover the improvements in EA Rack that attempted to build on the successes and opportunities of the University of Michigan Tauber project from 2010, as covered in section 0.
1.10 Thesis Overview
This thesis will outline the internship project focused on improving the material flow process of the EA Rack cell. The following chapters will help create background, context and analysis of the attempted
improvements.
* Chapter 2: Discussion of lean manufacturing best practices and how these can apply to Raytheon's lean transformation efforts within EA.
* Chapter 3: A discussion of the overall motivation for lean improvements and a definition of the problem central to this thesis.
* Chapter 4: A current state analysis of comparable manufacturing cells at Raytheon IDS and a deeper dive into the issued within EA Rack.
* Chapter 5: Discussion of the current and ideal state of the material flow process as well as an intervention that was introduced to aid this change effort.
" Chapter 6: A discussion of the best practices and opportunities for Raytheon management to support change throughout IADC and especially, EA Rack.
* Chapter 7: Three recommendations for Raytheon to build on the successes of this internship and support their lean transformation journey.
2
Best Practices in Lean
Lean manufacturing is a proven set of tools and approaches that help companies eliminate waste and deliver increased value at lower cost to the customer. With its roots in post World War II in Japan, lean thinking has evolved over the years and taken on a rigorous set of principles practiced by most leading operations companies today.
2.1
History of lean practices
The basic concepts of lean production were born out of Toyota post World War II. Faced with financial difficulties and a struggling business, Toyota had to change the way it did business. Then President Toyoda Kichiro made a goal for the company, "Catch up with America in three years" (Ohno, 1988). This challenge evolved over time to become the Toyota Production System (TPS), the most profiled and admired operating system of all time.
Taichi Ohno is the one most widely credited with taking these initial ideas and developing the TPS. For him, these concepts all boiled down to a specific focus on waste. "All we are doing is looking at the time line, from the moment the customer gives us an order to the point when we collect the cash. And we are reducing that time line by removing the non-value added wastes" (Ohno, 1988)
Today, most large companies have some derivation of Ohno's original TPS with varying degrees of success. According to the 2007 Industry Week/MPI Census of Manufacturers, "nearly 70% of all plants in the US are currently employing Lean Manufacturing as an improvement methodology" (Pay, 2008).
Ohno's ideas were first formalized in 1990 in The Machine that Changed the World. The word "lean" is credited to John Krafcik, who helped in the research for the book while at MIT and also was the first American Engineer hired by the NUMMI joint venture by GM and Toyota(Womack, Jones, & Roos, The Machine that Changed the World, 1990). The ideas were taken further by James Womack, in Lean
adopting these methods on a large scale. Specifically, he outlined the five key principles to lean operations(Womack & Jones, Lean Thinking, 1996):
1. Value: Value can only be defined by the customer and it is only meaningful when expressed in terms of a specific product which meets the customer's needs at a specific price at a specific time 2. Value stream: The set of actions required to bring a product through the three critical
management tasks of problem solving, information management and physical transformation
3. Flow: The continuous movement of a product through value added processes
4. Pull: The customer drives the production and "pulls" the line rather than building to stock or pushing the line
5. Perfection: Focus on continuous improvement to drive value in the value stream and to move towards states of flow and pull.
In recent years, lean practitioners have placed increased focus on the behavioral aspects of lean,
especially among operations leaders. Steve Spear, in his book The High- Velocity Edge, outlined the four capabilities that high performing organizations are likely to have (Spear, 2009):
1. Capability 1: System Design and Operation 2. Capability 2: Problem Solving and Improvement
3. Capability 3: Knowledge Sharing
4. Capability 4: Developing High-Velocity Skills in Others
Compared to the five principles outlined by Jones and Womack in 1996, these capabilities are much more holistic. They build upon the technical foundation of lean principles and apply it to a large enterprise.
The Defense Industry began to adopt lean practices as they began to spread through automotive and aerospace industries. However, the industry was not quick to accept these practices throughout the
1990's. However, acceptance gained steam at the beginning of the 2000's.
In 2001, in a report from RAND titled Military Airframe Acquisition Costs: The Effects of Lean
Manufacturing-authors Cynthia Cook and John Graser conclude that "it would be premature for the DoD
to adjust its cost-estimating tools to reflect projected savings from lean manufacturing" (Cook & Graser, 2001). Part of the problem they found is that "none of the manufacturers surveyed had yet implemented lean manufacturing practices on a broader scale, either from the beginning to the end of the value stream or within the factory as a whole" (Cook & Graser, 2001). Consulting firm Booz Allen Hamilton backed up these claims in the early 2000's, finding that "by conservative estimates, most aerospace & defense platform designers and producers are operating at less than 50% capacity utilization" and that "machining capacity was found to be operating at less than 10% utilization industry wide (Booz Allen Hamilton, 2000). However, low utilization could likely be driven by a number of factors including the fact that the 1990's were a decade of mostly peace and that low utilizations are typical of machining environments. Still, the fact remains that with such low utilizations, there is enormous potential for improvement.
2.3
Lean manufacturing best practices
Toyota has been one of the most recognized companies in terms of lean best practices. However, many companies have tried to copy their system, The Toyota Production System, and have failed to achieve the same consistent gains as Toyota. This led many to investigate the company further. One of the works that came out of this was Jeffrey Liker's Toyota Way, which describes the 14 principles which have driven their success throughout the years. These principles have been grouped into four high level themes (Liker, 2004):
3. Add value to the organization by developing your people and partners 4. Continuously solving root problems drives organizational learning.
While Liker was working with Toyota, he spoke with Toyotoa Motor Company President Fujio Cho, who noted that, "The key to the Toyota Way and what makes Toyota stand out is not any of the individual elements... But what is important is having all the elements together as a system. It must be practiced every day in a very consistent manner, not in spurts" (Liker, 2004).
The operations practice at McKinsey & Company has taken these principles a step further and identified the behaviors that align with success in lean and six sigma programs. The four behaviors they identified were(Tilley, 2009):
1. Role modeling: The leadership must teach and coach their charges, constantly challenging them and reinforcing "our way of doing it" by demonstrating the desired behavior.
2. Fostering alignment, understanding and conviction from bottom to top. Engaging with every employee and ensuring that each understands what is expected of them. Ensuring that everyone takes ownership for the things they can do.
3. Formal management infrastructure: Rigorously monitoring performance in real time, and then managing it, meaning that countermeasures' are put into place quickly, so that the system
supports continuous improvement and sustainability and concepts like PDCA (plan-do-check-act) really work, every day.
4. Capability building. Ensuring that every employee is constantly developing the new skills they need to do their job more effectively
Similar to Spear's four capabilities (Spear, 2009), both models provide us an opportunity to analyze the current state of the lean programs at Raytheon IDS.
Lean research has come a long way in the past two decades. Initial research focused on the operating principles that drove high performing "lean" companies such as Toyota in manufacturing in the early
1990's. More recently, however, the focus has shifted towards a more holistic focus on capability building, knowledge sharing and lean leadership. This is exemplified by two behavioral leadership models offered by Jeffrey Liker and McKinsey & Company.
3
Motivation and Problem Statement
This chapter outlines the high level impetus for change at Raytheon as well as how the internship fit within the broader goals of the organization. It also explores the specific problems that the internship aimed to solve within the EA Rack manufacturing cell.
3.1
Motivation
As stated in Raytheon's corporate goals, the business focus for operations is to "Bring Raytheon Six Sigma to the next level" (Raytheon's Vision, Strategy, Goals and Values, 2011). Raytheon began its lean transformation journey in 2001 after the Integrated Air Defense Center (IADC) was on the brink of being
closed. This was necessary to avoid layoffs and build towards a sustainable future. Within operations, employees have embraced the Lean and Six Sigma concepts as a part of that initial lean transformation, but are at the stage where the company wants to move to the next level.
There has been a renewed pressure within Raytheon to focus on affordability of its equipment. This has been driven by the US Department of Defense (DoD) which has increased the percentage of fixed costs contracts instead of cost-plus contracts. Given the fact that the company is heavily influenced by DoD pressures, most of their foreign contracts have also shifted to fixed costs, creating further incentive for operations improvement. These foreign contracts have seen increased competition in recent years, especially from Chinese and Russian defense companies.
Raytheon IDS has committed to a lean transformation at the enterprise level. However, since the Electronics Assembly (EA) cell has been dormant for several years, it did not benefit from the lean improvements that occurred throughout IDS. After winning contracts for at least 18 new Patriot Missile Defense systems from Taiwan and the UAE, EA had to expand rapidly to meet the expected downstream demand while also adopting some of the lean practices that other areas had already been working on for several years.
3.2
Problem Statement
Starting in 2010 with the Tauber project, there have been multiple continuous improvement projects that have attempted to improve the performance of the cell. However, EA Rack has struggled to sustain the impact of these interventions. As a result, the cell is still plagued by a number of core symptoms:
1. Excess inventory: Inventory levels are much higher than the number of assemblies that could be worked on. A main driver of inventory is high levels of idle time, which is more than 90% for single, double and triple bay racks.
2. A lack of prioritization: There are a number of assemblies being built, but there are no clear priorities.
3. Excessive fire fighting: There is a focus on removing short term barriers, not true root cause problems. Assemblies are removed from the line when there are issues, which are shown by a high ratio of idle time to build time.
During the internship, the top concern within EA was a lack of a standardized material flow process. This thesis explores the project that was undertaken at Raytheon to understand the current process and to present a potential future state. By focusing on improving the process and identifying problems in the current state, the goal is to identify areas of unpredictability which can be removed to help decrease variation in process and ultimately reduce cycle time.
3.3
Chapter Summary
This chapter discusses the motivation for change in the EA rack cell. Excess inventory, a lack or prioritization and excessive fire fighting are driven by a lack of a standardized material flow process. This thesis will discuss the interventions taken to attempt to improve on that process.
4
Current State Analysis of Raytheon IADC and EA
This chapter discusses the current state of comparable manufacturing areas within IADC and will show that high variability and inability to meet quoted cycle times is not specific to EA. However, the causes of these results were not explored further in areas outside of EA. This chapter will also discuss the performance of the FMDC kitting area and its effect on performance results in EA. Finally, there will be an in depth analysis of inventory, prioritization and continuous flow within the EA rack manufacturing cell.
4.1
Analysis of other IADC manufacturing cells
While conducting a current state analysis of EA, I was urged to talk to value stream managers in other areas of IADC to see if there were systematic challenges throughout the entire plant. While it was found that other areas were facing similar challenges meeting quoted cycle times, the reasons were not exactly the same as EA, but did help confirm that EA is facing larger challenges compared to the rest of IADC.
Using an 80/20 analysis approach, the top 80% of parts in terms of volume were analyzed for cycle time performance from January 2010 to March 2011. In addition to EA, the following areas were analyzed:
1. Circuit Cart Assembly (CCA)
2. Metal Fabrication
3. Cables (IADC)
4. Cables (SCC): Though not physically at IADC, the IADC oversees the management of this cables area in Portsmouth, RI.
5. Electronic Component Operations (ECO)
The data points for comparison are the actual and quoted cycle times, both of which include the time it takes to build the part until it is completed and delivered to the appropriate downstream cell.
Cycle time is defined as the time from the beginning of the production process and completion of the part or assembly. This includes production and idle time as well as rework and testing.
4.3 Analysis of Cycle Time Data
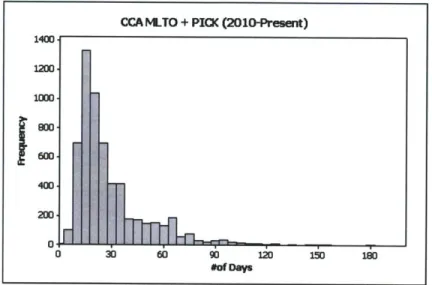
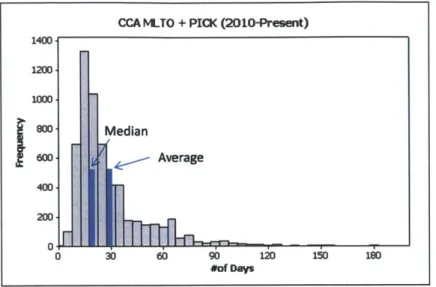
The first observation when looking at the data was that the data was skewed to the right. This is common in cycle time data everywhere, as there is a lower bound, but no upper bound. For example, the data for CCA is seen below:
CCA 1iTO + PICK (2010-Present)
1400 1200 1000. 900 GoW. 400 200 0.
o
30 6o 9b &Dys 120 150 ioFigure 4: Circuit Card Assembly (CCA) cycle time distribution (Jan 2010 - March 2011)
The skewness to the right can clearly be seen. To account for this in statistical analysis of the data, the median is used instead of the average. As seen in Figure 5, the average of this data is 29.04 days and the median is 21 days.
-Figure 5: Comparison of median and average in cycle time distribution
4.4 Cycle Time Predictability
Using the median and standard deviation of the sample data and comparing to the quoted lead time, the likelihood that a part will be completed on time can be computed. Although the data is not perfectly normal, by using the median the results will give us information that is directionally correct. The following equation was used in Microsoft Excel:
(Quoted Cycle Time - Median Cycle Time)
Ability to meet cycle time
=Normsdist
Sadr
eito
Standard Deviation
Resulting in the following results for each of the areas:
CCA M.TO + PICK (2010-Present)
1400 1200 000 Median 4<00 Average 0of -ay
0
30 60 90 120 15 180 #of DaysQuoted Cycle Median Cycle Standard Ability to Meet Area # of items Time (days) Time (days) Deviation (days)
Cycle Time CCA 6012 31.10 21.00 22.14 68% Metal Fab 748 32.20 14.00 26.42 75% Cables 1689 20.00 10.00 11.11 82% ECO 2162 43.83 27.00 17.73 83% SCC Portsmouth 1835 35.26 18.00 14.28 89% EA 6044 20.79 11.00 19.80 69%
Table 3: Cell Performance Jan 2010 - March 2011
As seen in Table 3, all of the areas struggle to meet their quoted cycle times and no area can reliably meet their quoted cycle time more than 89% of the time, with EA and CCA the two worst performing cells.
4.5
Model Validation
To validate the modeling assumptions, the predicted "ability to meet cycle time" was compared to the actual results from the data. This was done by counting the percentage of items that has cycle times lower than the quoted cycle time. This comparison can be seen in Table 4
Actual Model Difference
CCA 69% 68% 1% EA 72% 69% 3% Cables 79% 82% -3% Metal Fab 82% 75% 7% ECO 85% 83% 2% 5CC Portsmouth 87% 89% -2%
Table 4: Comparison of model versus actual results for cycle time performance
As seen in Table 4, the model accurately predicts the results of each area within +/- 7%.
4.6 EA and EA Rack performance
several other low volume products. The cycle time for EA and EA Rack both include the time from the beginning of the kitting process in FMDC. The cycle time performance data for the EA Rack cell was similar, but worse than EA as a whole. From the data for January 2010-March 2011:
Quoted Cycle Median Cycle
Standard
Ability to Meet
Time (days)
Time (days) Deviation (days)
Cycle Time
EA
6044
20.79
11.00
19.80
69%
EA Rack
1220
26.53
23.00
22.57
56%
Table 5: EA and EA rack cycle time performance predictions
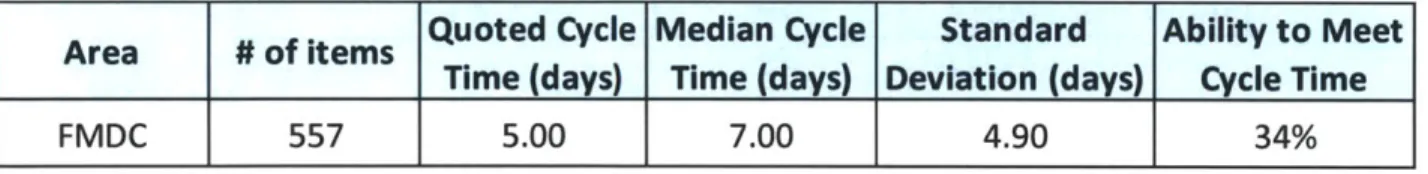
Although the data is from over 15 months, the data showed that the performance did not change much over the period. EA Rack products are typically more complex than the average EA part, which may help explain the worse performance, but is only one of many factors. FMDC Performance
Data for FMDC was taken from a different period, but still had similar results, with high variability and low likelihood to meet the quoted lead times. A smaller sample was taken, on 35 days from May to June 2011:
Area
# of items Quoted Cycle Median Cycle
Standard
Ability to Meet
Time (days)
Time (days) Deviation (days)
Cycle Time
FMDC
557
5.00
7.00
4.90
34%
Table 6: FMDC Performance (May-June 2011)
Since EA cycle time begins with the kitting process in FMDC, many of the parts are already behind schedule when they reach EA. This likely drives variation in EA, but the standard deviation in FMDC (4.9 days) is only approximately 25% of the variation in EA (19.8 days). However other issues such as incomplete kits delivered from FMDC could be a contributor to some of the statistical variation seen in EA.
Given the fact that FMDC does not reliably get the components for the single, double and triple bay racks to the floor in time, EA cell leads and managers compensate by ordering parts ahead of when they are actually due. However, this creates a lot of artificial demand for parts that may or may not be due. Although not the only driver, this behavior contributes to symptoms EA is experiencing including excess
inventory, unclear prioritization and lack of continuous process flow.
4.7.1 Excess Inventory
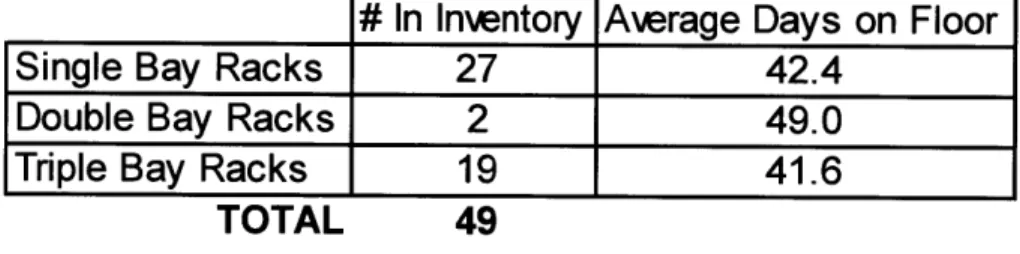
In a census taken in July 2011 of single, double and triple bay racks, there were 49 naked racks in production on the EA rack floor. However, there are only up to 10 benches that are capable of building these racks on each shift. If every operator possible was working on these racks, a maximum of 20 could even be in process on each day. In reality, assemblies spend a lot of time waiting for parts, waiting on a storage racks, waiting for inspection or waiting for missing parts. A summary of the inventory and amount of aging for single, double and triple bay racks taken in July 2011 is seen in Table 7:
# In Inentory Average Days on Floor
Single Bay Racks
27
42.4
Double Bay Racks
2
49.0
iple Bay Racks
19
41.6
TOTAL
49
Table 7: Inventory of single, double and triple bay racks in July 2011
Looking at historical data for the racks, the value added time can be analyzed by looking at the build time versus the average age at completion. A day is defined as two 6 hour shifts. The build time is the time spent building the assembly and the average age at completion is the entire time it spends on the floor:
Double Triple
e ayBay
Bay
Average Build Time
1.3 Days
3.7 Days
3.7 Days
Average Age at
47.5 Days
68 Days
68 Days
Completion
Value Added (%)
2.7%
6.4%
G.4%
Table 8: Build time versus age at completion for EA Racks
As seen in Table 8, the value added time is very small, 2.7% for single bay racks and 5.4% for the double and triple bay racks.
4.7.2 Prioritization
A deeper issue driving the increased inventory and high idle times is a general lack of prioritization on the floor. As part of a deeper analysis of the 49 naked racks in inventory on the floor, the racks required for the Patriot program were analyzed. Using intemal systems to retrieve downstream demand, in process racks were placed in order based on the percentage completed. In reality, racks are not assigned to higher level assemblies until they are completed, so ranking by percent completion is the closest approximation. The higher level assemblies require 1, 2, 3 or 4 of each rack per radar. In addition, each radar has specific due dates. For UAE, which has a contract for 10 radars, they are due in sequence with radar 1 being due before radar 2 and so on.
In Table 9 below, the impact of the lack of prioritization becomes obvious. Since assemblies are not assigned to a specific radar until completion, it does not make sense to say there is a correct within one part number. However, assemblies are being worked on for radars that are not due for several months, while other assemblies on the floor are already late or are due sooner. Assemblies for radars 6, 7 and 8 are being built while requirements for radars 3 and 4 have still not been satisfied. Four of assemblies
#13646434 are required for the high level radar #4, but they have not even arrived on the floor yet. This could be due to many reasons including part shortages and poor planning.
SFC 11474901-989008 13646451-988012 11456578-988009 11461581-989001 11474901-989009 13646434-988003 13646451-989001 13646451-989002 13646451-989003 13646451-989004 11456578-988006 11456578-989002 11456580-988012 11456581-988006 11456582-989002 11461581-988006 11468651-988014 11468651-988016 11468651-989004 11474901-989010 13646434-988004 11456578-988008 11456580-989005 11461581-988005 11463407-988007 11463407-988009 11468651-988011 11468651-988013 11468651-989003 11456580-989006 11463407-988008 11468651-989005 11463407-989003 5 5 5 5 5 5 6 6 6 6 6 6 6 6 7 7 7 8
Days at Total OMPLETE Operation IAging CMLT 0 42 1% 11 58 0% 4 24 r49% 0 66 59% 13 35 40% 3 91 M____ 5 5 0% 0% 5 _ f-0% 5 0% 19 70 0% 3 70 45% 44 45 5%o 61 65 f 0%
Number RTRTYPE Operation
3 110 3 10 4 140 4 120 4 40 4~ 10 4 Kit Cut 110 4 Kit Cut 110 4 Kit Cut 10 5 10 5 130 5 30 51 10 5 110 59 W 55% 0% )0 31 47 19% 140 2 35 49% )0 24 35 19% 10 3 _ 0% 20 7 7 12% 10 4 18 0% 30 1 11 0% 10 55 62 30% )0 31 54 28% )0 31 40 28% 10 12 53 0% 30 21 46 9% 30 0 67 12% 10 6 0% 10 31 54 5% 10 20 32 0% 10 6 38 0%
Table 9: Summary of inventory aging by high level radar assembly
When asking cell leaders what is a priority, they will often give different reasons for what is being built on different days. Due to a lack of long term capacity and production planning at the cell level and part shortages, cell leads often try to keep operators busy with what is ready to be built, regardless of true due dates or other problems that have not yet been solved.
4.7.3 Lack of continuous process flow
Excess inventory and a lack of prioritization are symptoms of a lack of continuous process flow. To analyze this further, a single bay rack was tracked on a shift by shift basis through completion. As seen in
test or rework and red signifies when there is idle time. Typically, when the item is "red" it is sitting in inventory on a shelf in the area or waiting to be built or reworked. For this specific assembly, it remained in production throughout the first five shifts. However, this is the most number of consecutive shifts the product was worked on for the remainder of the process.
1st Shift Hours 2nd Shift Hours 1st Shift Hours 2nd Shift Hours
Monday 20-Jun Assy 4.11 Assy 5.97 Thursday 21-Jul Idle Idle
Tuesday 21-Jun Assy 4.48 Build/Rework 2.20 Friday 22-Jul idle idle
Wednesday 22-Jun Assy 4.97 Idle Saturday 23-Jul Idle Off
Thursday 23-Jun Assy 3.31 Idle Sunday 24-Jul Idle Off
Friday 24-Jun Assy 4.27 Idle Monday 25-Jul Idle Rework 0.62
Saturday 25-Jun Idle Off Tuesday 26-Jul Test 0.19 idle
Sunday 26-Jun Assy 1.43 Off Wednesd 27-Jul Idle Idle
Monday 27-Jun idle Assy 2.98 Thursday 28-Jul Idle Test 1.55
Tuesday 28-Jun idle Assy 1.47 Friday 29-Jul idle Idle
Wednesday 29-Jun Idle Idle Saturday 30-Jul Idle Off
Thursday 30-Jun Assy 0.43 Idle Sunday 31-Jul idle Off
Friday 1-Jul Idle idle Monday 1-Aug Test 4.99 Idle
Saturday 2-Jul idle Idle Tuesday 2-Aug Idle Idle
Sunday 3-Jul Idle Off Wednesd 3-Aug Idle idle
Monday 4-Jul idle Off ff Thursday 4-Aug Idle Idle
Tuesday 5-Jul Idle Test 0.00 Friday S-Aug Test 3.S2 Idle
Wednesday 6-Jul Test 7.36 Test/Rework 2.58 Saturday 6-Aug Test 3.09 Off
Thursday 7-Jul Idle Test/Rework 1.87 Sunday 7-Aug Rework 0.95 Off
Friday 8-Jul Idle Idle Monday 8-Aug idle Idle
Saturday 9-Jul Idle Off Tuesday 9-Au idle Test/Rework 3.13
Sunday 10-Jul Idle Off Wednesd 10-Aug Test 3.33 Idle
Monday 11-Jul Idle Idle Thursday 11-Aug idle Idle
Tuesday 12-Jul Test/Rework 0.92 Idle Friday 12-Aug Test/Rework 1.81 Test 1.10
Wednesday 13-Jul idle Idle Saturday 13-Aug Idle Off
Thursday 14-Jul idle. Idle Sunday 14-Aug Idle Off
Friday 15-Jul Idle idle Monday 15-Aug Paint 4.37 Paint 0.03
Saturday 16-Jul Idle Off Tuesday 16-Aug Inspect 0.83 idle
Sunday 17-Jul Idle Off Wednesd 17-Aug Rework 0.01 Idle
Monday 18-Jul Idle Idle Thursday 18-Aug idle Idle
Tuesday 19-Jul Idle idle Friday 19-Aug Rework/Complete 4.42
Wednesday 20-Jul Idle Idle
Table 10: Summary of build process
From the Table 10, it can be seen that the product went off the production floor and into inventory several times. Including leaving the floor for rework, test and being put on an inventory rack between shifts, the part was moved at least 20 times. When a part encounters a stoppage in production, there is no process to deal with the problem. Given the fact that there are no clear priorities (section 4.7.2), cell leads will give operators any part that is ready to be built rather than solving the immediate problem. Without
inventory, it is easier to put another product into production (even if it is less urgent) than to work on these problems.
A summary of the idle versus build time for this part can be seen in Figure 6 below. The value added time was only 13% of the total time the part spent on the floor, which is better than the historical average from section 4.7.1, but the total build time was greater than average.
Figure 6: Pilot results, build time versus idle time
4.8 Discussion of Incomplete Kits
Although data was not available for further analysis on the number of incomplete kits within EA, a number of the root causes are known within the cell. First, kits are sometimes delivered to EA without all of the components. This is either deliberate (to begin building a part) or an error (FMDC mistakenly misses a part). Although it has been shown that some parts are not a pressing priority, some are on the
critical path and EA will begin building assemblies without all the required parts. There is no standard way to assure that the missing parts are delivered to that assembly when they are available. Second,
Build vs. Idle Time
50 -40 -30 -20 - 6.9 Days 13% of Total 10 - Time 0
Build Time Idle Time
4.9
Chapter Summary
This chapter showed that high variability is consistent across multiple manufacturing cells and is one of many reasons driving an inability to consistently meet quoted cycle times, especially EA and EA Rack. FMDC, which delivers kits to EA, is only able to meet its quoted cycle time 34% of the time, which forces EA to be consistently behind schedule. This drives some of the symptoms within the EA Rack area discussed such as excess inventory, unclear prioritization and lack of continuous flow.
5
Improving the material flow process in EA Rack
A project to look at improving the material flow process in EA Rack was underway when the internship began. The main driver of the project was to drive down the cycle time variation the cell was
experiencing. Although only one of many causes of the variation, the material flow process was something that was identified that was visual that could clearly be seen and improved quickly. The material flow process was defined as how parts are delivered to the floor, how they are stocked in
inventory and how they flow on the floor. This chapter defines the process and discusses the major issues that existed at the time of the internship. In addition, it offers results from the introduction of a material kitting cart that attempted to improve the material flow process.
5.1
Project Goals
The reason the project was undertaken was that there was an opportunity to improve the process of how material flows through FMIDC and EA. The project was also a priority, as it would help the cell support recent initiatives towards improved safety (through less heavy inventory all throughout the floor) and it would gain support with front line operators, who consistently listed problems related to material flow as their top complaint.
5.2 Define the material flow process
Given a lack of standardization the material follows a different and unique process every time an assembly is built. However, there is a general process that every assembly follows that describes the general flow of parts from beginning of kitting through completion of production. This can be seen below in Figure 7:
Figure 7: General process for material flow for single, double and triple bay racks
The major point to highlight from this figure is the loop from step 8 to step 7. As discussed in previous sections, assemblies tend to leave and come back to the bench several times throughout the entire build process. Although macro level data is not available for the cell, most of the time is spent after step 6. In Table 10 in the previous section, a sample part was shown to have spent over 50 days from step 6 until step 9. The time from steps 2 to step 5 was summarized in section 0, with the median kitting time averaging 7 days. The following sections will dive into some of these issues further.
5.3
Understand the symptoms
There were a number of symptoms that show the lack of standardization within this process. Three examples are discussed below:
Carts as Inventory Storage: Due to excess inventory there is not sufficient storage space on the production floor. Carts are used as backup inventory racks. In Figure 8 below you can see the kit for a triple bay rack that is being stored on a cart, which is not big enough to do so. The cart is being used because the incoming inventory racks are already filled.
Figure 8: Cart carrying a triple bay kit
Separation of components: Figure 9 shows a storage rack that was created for single, double and triple bay rack covers. Since completion of an assembly takes over a month, covers are stored on this rack instead of traveling with the part. At the end of the process when covers are attached it is a challenge to find the correct cover. Covers on this rack could be for assemblies in process, ones waiting for parts or even covers for parts not on the floor yet.
Figure 9: Covers rack is unclear
Excess Packaging: Operators spend time searching for, organizing and de-trashing (taking the packaging off) parts. In Figure 10 below, you can see the packaging of a single bay kit (top left), the packaging for those parts (bottom left) and small components in individual bags (right). Big parts are fairly easy for operators to identify, but with at least 30 smaller parts in each assembly, the operator has to spend considerable time finding each component and verifying the part numbers on each bag.
All three issues, although not exhaustive, show that there is a considerable opportunity for improvement and to standardize the material process throughout the entire production process.
5.4
Analyze
To further understand these issues, information was collected through analyzing data, working with the frontline operators and observing the process.
5.4.1 Kit complexity
Among the single, double and triple bay racks, the number of parts and size of the major assemblies varies. Among the six single bay racks, there were on average 47 components in each kit. Among the five double and triple bay racks, there were on average 84 components in each kit. Each kit has small and large parts. Single bay racks have 7 large parts, double bay racks have 13 and triple bay racks have 19. The remainder of all parts in each kit is small component parts and is typically delivered to EA within a covered tote box.
5.4.2 Assembly sizes
The large parts mostly consist of the base, chassis, and covers. These large parts take up a lot of space and are the main driver in the current lack of storage space. The bases of the racks have different sizes and the large parts have similar sizes as the base. Among the 11 single, double and triple bay rack bases, there were five major sizes as seen in Table 11.
General Dimensions
Length Width Height
34" 8.5" 8.5"
24.5" 8.5" 8.5"
24.5" 16.5" 8.5"
24.5" 24.5" 8.5"
19" 24.5" 8.5"
Operators had a major input into the diagnosis of the issues dealing with the materials flow process. Two of their major concerns that they brought to the teams attention were:
1. Incomplete Kits: There is no way for an operator to know if a kit has all its parts unless they go through and verify all the parts at the beginning of every shift. Often there are missing parts
because the kit was sent to the floor incomplete or a part was taken to finish another assembly. Many assemblies are "built to short" meaning that they do not have all the parts to complete production, but will be built until the part they need is not available. This drives increased inventory and confusion among the operators.
2. Lack of space: There is not a sufficient system for storage of the racks between shifts or visual management of the parts and their status on the line because of the excess inventory. Thus, carts are used to store the assemblies and are constantly moved around on the production floor.
These concerns are only a few of major issues facing the operators. Overall, the morale of the operators was strong, but most were frustrated due to the lack of standard process.
5.4.4 Observation
Considerable amount of time was spent with operators to understand the build process, understand their frustrations and to get them involved in the improvement project. As part of this process, we sat with one operator throughout a simulated build process of a triple bay rack to record the time he spent searching for parts and removing packaging. It was calculated that for he spends approximately 1.3 hours on looking for parts, reorganizing parts and removing the packaging of 84 total parts. A summary of the results is seen in Figure 11:
Figure 11: Non value-added time in assembly due to searching and de-trassing
Given the average build time of 3.7 days (44.4 hours) of a single back rack, the removal of all of this non-value added time would only save 2.9% of the time on the build process. Given that the average age at completion is 68 days, this did not seem like a significant direct savings. Regardless, the project team manager felt that the direct savings as a percentage of value added time and the indirect savings that would be achieved through a better process made the project a worthwhile effort.
5.5
Pilot Experiment
Despite the data showing that direct savings from operators will only amount to a maximum of 1.3 hours, there were still many opportunities to improve the process that would help the manufacturing cell reduce inventory and improve its ability to prioritize and introduce flow into the line.
To achieve these goals, several concepts were developed to help improve the material flow process. One concept that was settled on was a movable kitting cart that would enable mobile storage and kitting of the assembly as it went through the production process.
5.5.1 Concept
Working with external vendors, the project team developed an experimental kitting cart design that could
1.4 - Non-Value Added Time In Operations 1.3
1.2 - Assembly #11474901 1 -0.8 - 0.7 0.6 z 0.6 -0.4 -0.2
-Looking for / Detrashing Total