Dynamic Amplification Factor for Moment Resisting Frames in
Progressive Collapse
by
Renata Gomelskaya B.E. Civil Engineering
The Cooper Union for the Advancement of Science and Art, 2013
the Department of Civil and Environmental Engineering in Partial the Requirements for the Degree of
Master of Engineering in Civil and Environmental Engineering at the
Massachusetts Institute of Technology
June 2014
@2014 Renata Gomelskaya. All Rights Reserved.
Fulfillment of
MASSACHUSETTS INS1fUtE
OUTECHNO2OGY
J UN 13 2
014
iCR-ARIES
The author hereby grants to MIT permission to reproduce and distribute publicly paper and electronic copies of this thesis document in whole or in part in any medium now known or
hereafter created.
Signature of Author:
Certified by:
Certified by:
_____________Signature redacted
Department of Civil and Environmental Engineering May 9, 2014Signature redacted
Pierre Ghisbain Lecturer in Civil and Environmental Engineering Thesis SupervisorSignature
redacted
Dynamic Amplification Factor for Moment Resisting Frames in
Progressive Collapse
by
Renata Gomelskaya
Submitted to the Department of Civil & Environmental Engineering on May 9, 2014 in Partial Fulfillment of the Requirements for the Degree of Master of Engineering in Civil &
Environmental Engineering
ABSTRACT
Progressive collapse has been a prevalent research topic since a gas explosion caused the collapse of the Ronan Point apartment building in 1968. Progressive collapse occurs when an instantaneous loss of a supporting element causes failure in adjacent members leading to a large scale collapse of the structure. The General Services Administration (GSA) and the Department of Defense (DoD) have provided design guidelines regarding progressive collapse mitigation. The guidelines provide requirements for setting up static and dynamic, linear and nonlinear analyses. In particular, a dynamic amplification factor (DAF) of 2 is recommended to account for the dynamic effects when performing a static analysis. Recent studies have determined that the
GSA and the UFC guidelines provide an overly conservative dynamic amplification factor. In
this thesis, various frames were analyzed using SAP2000 for all four analysis methods and the results were used to make recommendations regarding a more appropriate dynamic amplification factor. Additionally, the role of dynamic and nonlinear effects were observed and compared for the four different analysis methods.
ACKNOWDLEDGEMENTS
First and foremost, I'd like to express my gratitude to my thesis advisor Dr. Pierre Ghisbain for his assistance throughout the thesis. He has provided guidance, advice and encouragement throughout this process and throughout the coursework this year. His willingness to always help his students is greatly appreciated. I would also like to thank Dr. Jerome J. Connor for his dedication and contributions to the High Performance Structures program.
Additionally, I would like to thank my parents for providing me with their support and
encouragement to follow my dreams. I am forever thankful for their unconditional love and care. To my little sister, I appreciate her constant bragging about my accomplishments. Nobody has been more proud of me than her. I would also like to thank my grandmother for constantly reminding me to eat and sleep this year.
I would like to thank my beloved David for his faith that I can accomplish anything I set my
mind to. He believed in me even when I didn't believe in myself. He provided me with the strength to never give up during this challenging year, and has always been there for me, any time, day or night.
Lastly, I would like to thank my fellow MEng students. They provided me with friendships, laughs and great times. They make this program enjoyable and have left me with memories to last a lifetime.
Table of Contents
I
Background ... 131.1 Introduction ... 13
1.2 Types of Building Collapse... 13
1.3 Exam ples ... 14
1.3.1 Ronan Point... 14
1.3.2 A lfred P. M urrah Federal Building ... 15
1.3.3 W orld Trade Center ... 15
1.4 Objective ... 16
2 Analysis Procedure ... 17
2.1 Linear Static ... 18
2.2 N onlinear Static... 18
2.3 Linear Dynam ic... 18
2.4 N onlinear Dynam ic ... 19
3 Dynam ic Am plification Factor ... 20
4 Im plem entation in SAP2000... 21
4.1 M odeling A ssum ptions ... 21
4.2 Loading Conditions for Analysis ... 21
4.3 Procedure for Linear Static Analysis ... 22
4.4 Procedure for N onlinear Static Analysis... 24
4.5 Procedure for Linear Dynam ic Analysis... 26
4.6 Procedure for N onlinear Dynam ic Analysis ... 29
5 2D Fram e A nalysis Results... 31
5.1 Introduction ... 31
5.2 Specifications ... 31
5.4.3 2x4 Fram e ... 49 5.4.4 3x2 Fram e ... 53 5.4.5 3x3 Fram e... 59 5.4.6 3x4 Fram e...62 5.4.7 4x2 Fram e...66 5.4.8 4x3 Fram e...72 5.4.9 4x4 Fram e...76 6 Conclusion ... 80
6.1 Dynam ic A m plification Factor... 80
6.2 D iscussion ... 82
6.3 Future W ork ... 84
7 References...85
8 Appendix ... 87
8.1 2x3 Span Exterior Rem oved Colum n ... 87
8.2 2x3 Span Interior Rem oved Colum n... 88
8.3 2x4 Span Exterior Rem oved Colum n ... 89
8.4 2x4 Span Interior Rem oved Colum n... 90
8.5 3x3 Span Exterior Colum n Rem oved... 91
8.6 3x3 Span Interior Rem oved Colum n... 92
8.7 3x4 Span Fram e Exterior Rem oved Colum n ... 93
8.8 3x4 Span Fram e Interior Colum n Rem oval ... 94
8.9 4x3 Span Fram e Exterior Colum n Rem oved ... 95
8.10 4x3 Span Fram e Interior Colum n Rem oval... 96
8.11 4x4 Span Fram e Exterior Colum n Rem oved... 97
List of Figures
Figure 1: Partial Collapse at Ronan Point Apartment Building... 14
Figure 2: Propagation of Collapse of the World Trade Center ... 15
Figure 3: Mass Source Definition (DEAD includes Self-Weight) ... 23
Figure 4: Linear Static A nalysis Definition ... 23
Figure 5: Graphical Representation of FEMA 356 Plastic Hinges... 25
Figure 6: Nonlinear Static Analysis Definition ... 26
Figure 7: Tim e History for Column Removal... 27
Figure 8: Linear Dynam ic Analysis Procedure... 28
Figure 9: Nonlinear Dynamic Analysis Definition... 30
Figure 10: D im ensions of the 2D Fram es ... 32
Figure 11: Dim ensions of the 2D Frames (cont.) ... 33
Figure 12: DAF for Horizontal Deflection for Various Column Removal Times for Soft Frame 35 Figure 13: DAF for Vertical Deflection for Various Column Removal Times for Soft Frame ... 35
Figure 14: DAF for Horizontal Deflection for Various Column Removal Times for Stiff Frame38 Figure 15: DAF for Vertical Deflection for Various Column Removal Time for Stiff Frame .... 38
Figure 16: Vertical Deflection at Free Node for a 2x2 Exterior Column Removal... 39
Figure 17: Moment in Member Above Removed Column for a 2x2 Exterior Column Removal 40 Figure 18: Plastic Hinge Comparison for 2x2 Exterior Removed Column ... 41
Figure 19: Vertical Deflection at Free Node for a 2x2 Interior Column Removal... 42
Figure 20: Moment in Member Above Removed Column for a 2x2 Interior Column Removal. 43 Figure 21: Plastic Hinge Comparison for 2x2 Interior Removed Column ... 44
Figure 22: Plastic Hinge Comparison for a 2x3 Exterior Column Removal ... 46
Figure 23: Plastic Hinge Comparison for a 2x3 Interior Column Removal ... 48
Figure 24: Plastic Hinge Comparison for a 2x4 Exterior Column Removal... 50
Figure 25: Plastic Hinge Comparison for a 2x4 Interior Column Removal ... 52
Figure 26: Vertical Deflection at Free Node for a 3x2 Exterior Column Removal... 53
Figure 27: Moment in Member Above Removed Column for a 3x2 Exterior Column Removal 54 Figure 28: Plastic Hinge Comparison for a 3x2 Exterior Column Removal ... 55
Figure 29: Vertical Deflection at Free Node for a 3x2 Interior Column Removal... 56
Figure 30: Moment in Member Above Removed Column for a 3x2 Interior Column Removal. 57 Figure 31: Plastic Hinge Comparison for a 3x2 Interior Column Removal ... 58
Figure 39: Plastic Hinge Comparison for 4x2 Exterior Removed Column ... 68
Figure 40: Vertical Deflection at Free Node for a 4x2 Interior Column Removal... 69
Figure 41: Moment in Member Above Removed Column for a 4x2 Interior Column Removal. 70 Figure 42: Plastic Hinge Comparison for 4x2 Interior Removed Column ... 71
Figure 43: Plastic Hinge Comparison for a 4x3 Exterior Column Removal ... 73
Figure 44: Plastic Hinge Comparison for a 4x3 Interior Column Removal ... 75
Figure 45: Plastic Hinge Comparison for a 4x4 Exterior Column Removal ... 77
Figure 46: Plastic Hinge Comparison for a 4x4 Interior Column Removal ... 79
Figure 47: Dynamic Amplification Factor for Various Number of Bays ... 80
Figure 48: Dynamic Amplification Factor for Various Number of Stories... 81
Figure 49: Vertical Deflection at Free End for a 2x3 Exterior Column Removal... 87
Figure 50: Moment in Member Above Removed Column for a 2x3 Exterior Column Removal 87 Figure 51: Vertical Deflection at Free Node for a 2x3 Interior Column Removal... 88
Figure 52: Moment in Member Above Removed Column for a 2x3 Interior Column Removal. 88 Figure 53: Vertical Deflection at Free End for a 2x4 Exterior Column Removal... 89
Figure 54: Moment in Member Above Removed Column for a 2x4 Exterior Column Removal 89 Figure 55: Vertical Deflection at Free End for a 2x4 Interior Column Removal... 90
Figure 56: Moment in Member Above Removed Column for a 2x4 Interior Column Removal. 90 Figure 57: Vertical Deflection at Free End for a 3x3 Exterior Column Removal... 91
Figure 58: Moment in Member Above Removed Column for a 3x3 Exterior Column Removal 91 Figure 59: Vertical Deflection at Free End for a 3x3 Interior Column Removal... 92
Figure 60: Moment in Member Above Removed Column for a 3x3 Interior Column Removal. 92 Figure 61: Vertical Deflection at Free End for a 3x4 Exterior Column Removal... 93
Figure 62: Moment in Member Above Removed Column for a 3x4 Exterior Column Removal 93 Figure 63: Vertical Deflection at Free End for a 3x4 Interior Column Removal ... 94
Figure 64: Moment in Member Above Removed Column for a 3x4 Interior Column Removal. 94 Figure 65: Vertical Deflection at Free End for a 4x3 Exterior Column Removal... 95
Figure 66: Moment in Member Above Removed Column for a 4x3 Exterior Column Removal 95 Figure 67: Vertical Deflection at Free End for a 4x3 Interior Column Removal... 96
Figure 68: Moment in Member Above Removed Column for a 4x3 Interior Column Removal. 96 Figure 69: Vertical Deflection at Free End for a 4x4 Exterior Column Removal... 97
Figure 70: Moment in Member Above Removed Column for a 4x4 Exterior Column Removal 97 Figure 71: Vertical Deflection at Free End for a 4x4 Interior Column Removal... 98 Figure 72: Moment in Member Above Removed Column for a 4x4 Interior Column Removal. 98
List of Tables
Table 1: DAF for Various Column Removal Durations for Soft Frame ... 34
Table 2: DAF for Various Column Removal Durations for Stiff Frame ... 36
Table 3: DAF for 2x2 Frame with Exterior Column Removal... 41
Table 4: DAF for 2x2 Frame with Interior Column Removal... 44
Table 5: DAF for 2x3 Frame with Exterior Column Removal... 45
Table 6: DAF for 2x3 Frame with Interior Column Removal... 47
Table 7: DAF for 2x4 Frame with Exterior Column Removal... 49
Table 8: DAF for 2x4 Frame with Interior Column Removal... 51
Table 9: DAF for 3x2 Frame with Exterior Column Removal... 55
Table 10: DAF for 3x2 Frame with Interior Column Removal... 58
Table 11: DAF for 3x3 Frame with Exterior Column Removal... 59
Table 12: DAF for 3x3 Frame with Interior Column Removal... 61
Table 13: DAF for 3x4 Frame with Exterior Column Removal... 63
Table 14: DAF for 3x4 Frame with Interior Column Removal... 64
Table 15: DAF for 4x2 Frame with Exterior Column Removal... 68
Table 16: DAF for 4x2 Frame with Interior Column Removal... 71
Table 17: DAF for 4x3 Frame with Exterior Column Removal... 72
Table 18: DAF for 4x3 Frame with Interior Column Removal... 74
Table 19: DAF for 4x4 Frame with Exterior Column Removal... 76
1 Background
1.1 Introduction
Progressive collapse refers to the phenomenon that occurs when a local failure in a building causes partial or full collapse of the rest of the building. ASCE 7 defines progressive collapse as "the spread of an initial local failure from element to element, eventually resulting in the collapse of an entire structure of a disproportionately large part of it" (ASCE 7-10, 2010). This phenomenon has been an issue many engineers have concerned themselves with since the collapse of the Ronan Point apartment building in 1968 where a gas explosion took out a load bearing wall causing partial collapse. Since then there have been many other instances of progressive collapse; however, it was cases of terrorism on the Alfred P. Murrah Federal Building in Oklahoma City in 1995 and the World Trade Center in New York City in 2001 that fostered intensive research on the topic.
1.2 Types of Building Collapse
The different types of progressive collapse have been described by Starossek (2009) as
follows:
Pancake Type Collapse
This type of collapse occurs when there is an initial failure of a vertical load bearing element. This failure causes a separation of structural components which leads to an impact and failure on the floor below. This failure propagates vertically throughout the building causing a
pancake type collapse.
Zipper Type Collapse
The zipper type collapse refers to the failure of tension elements. This is common in cable stayed or suspension bridges. The rupture of one cable causes the redistribution of forces and therefore overloads the adjacent cables. The combination of the redistribution of forces, the impulse due to sudden failure, and the concentration of static and dynamic forces in adjacent cables cause a failure prorogation in a transverse direction causing a zipper type collapse.
Section-Type Collapse
When a member under bending moment or tension is cut, the internal force transmitted until the cut are redistributed into the remaining cross section. This corresponds to an increase in stress that results in a rupture further along the member.
Instability-Type Collapse
This type of failure occurs when there is a failure of a bracing or stiffening element that stabilizes load-bearing elements. As a result of this failure, the load-bearing element is no longer stable and there is a sudden failure due to small perturbations causing immediate collapse or failure propagation.
1.3 Examples
1.3.1 Ronan PointIn May 1968, in Newham, England, the Ronan Point apartment building collapsed due to disproportionate progressive collapse. A gas explosion on the 18th floor took out a load bearing
precast concrete panel causing the partial collapse of a 22 story building. The loss of the column resulted in a chain reaction that caused partial collapse. The upper floors collapsing caused an impact on the floors below causing them to collapse as well as can be seen in Figure 1 below. The partial collapse of the corner bay caused disproportionate collapse of the whole building killing four people and injuring seventeen others. This collapse prompted interest in the engineering world and triggered research as well as significant changes in building codes (Pearson and Delatte 2005).
Figure 1: Partial Collapse at Ronan Point Apartment Buildina
1.3.2 Alfred P. Murrah Federal Building
In April 1995, a bomb exploded near the fagade of the Alfred P. Murrah Federal building
in Oklahoma City, OK. The bomb damaged three perimeter columns causing the transfer girder
to span three times the load it was designed for. As a result, the transfer girder failed causing the
upper floors to collapse as well. More than half the floor area ended up collapsing. The damage
was concentrated on the side of the building where the bomb exploded but part of the interior of
the building also collapsed. The explosion killed 168 people and injured another 800 people.
This attack increased the interest in progressive collapse research generating more studies to be
conducted on preventing such failure (Ruparelia 2013).
1.3.3 World Trade Center
Since the September 11th terrorist attack on the World Trade Center in New York City,
interest and research on progressive collapse has reached an all-time high. On September 11,
2001, the two twin towers were hit by Boeing 767 planes causing the progressive collapse of
both towers. The large impact from the planes caused structural damage as well as fires on the
floors that were struck. Although the towers were resilient to the impact of the planes, the fire
heated the steel causing additional failures that the towers could not resist. As a result, the
sections above the impact fell on the structure below as shown in Figure 2 below. This is an
illustration of a pancake type collapse. The impact of the falling structure caused failure
propagation all the way to the ground. The collapse of the World Trade Center caused the death
of more than 3000 people, as well as extensive damage to numerous surrounding buildings
(Seffen 2008).
1.4 Objective
One of the goals of this thesis is to analyze a set of frame varying in geometry and their ability to resist progressive collapse. The various geometry configurations can be found in Section 5.2. Each frame will be analyzed using four analysis methods: linear static (LS), nonlinear static (NLS), linear dynamic (LD), nonlinear dynamic (NLS). The four analysis methods are described in Chapter 2. The displacement and bending moment was observed for each of these frames for each analysis case. The maximum displacement and maximum moment were used to derive a dynamic amplification factor (DAF) for the static analysis cases. A static
load was applied without a DAF and compared with the results of the NLD analysis to determine the amplification factor for these results.
Currently, a DAF of 2 is used for the static loading condition to take into account dynamic effects of the structure. According to recent studies, it has been determined that this
DAF is overly conservative (Ruth et al. 2006). The frames will be analyzed using SAP2000. SAP2000 is an integrated software for structural analysis and design. This program was chosen
because it was proven to be "the most integrated, productive, and practical general purpose structure program on the market today" (SAP2000 Overview). Chapter 4 describes the analysis procedure using SAP2000 for each of the analysis cases. The other goal of this thesis is to use
2 Analysis Procedure
The U.S. General Services Administration (GSA) issued general guidelines for evaluating a building's progressive collapse potential. The document provides direct recommendations for the selection of the analysis procedure and evaluation of the results. According to GSA,
progressive collapse analysis is accomplished by implementing an alternate path for the load. The alternate path method requires a structure "to be able to bridge over vertical load-bearing elements that are notionally removed one at a time at specific plan and elevation locations"
(GSA 2000). This allows local failure to occur but provides the structure with alternate load paths by transferring loads to adjacent members.
GSA guidelines state the following loading combinations when analyzing progressive collapse:
Static Analysis: Pu = 2*(DL + 0.25LL) (1)
Dynamic Analysis: P, = DL + 0.25LL (2)
where DL= dead load, which is generated by SAP2000 automatically using element properties and material density; and LL= live load, which is dependent on the occupancy of the building. A small safety factor is implemented for the live load because it is assumed that at a time of an extreme event the full live load will not be acting on the structure. The factor of 2 in front of the static equation is called the dynamic amplification factor. Since the static analysis does not take into account dynamic effects of the building, this factor is used to predict the maximum affect under static load.
There are four analysis procedures that could be carried out for progressive collapse each being more complex, regarding computational efficiency, than the previous: linear static,
2.1 Linear Static
Linear static (LS) analysis procedure is the simplest and quickest to run. The static load combination is applied to the structure and a dynamic amplification factor of 2 is used in order to predict the nonlinear and dynamic effects of the building. However, its accuracy is limited to relatively simple structure. GSA resists the application of the linear static approach to structures with 10 stories or less. In simple structures, the nonlinear and dynamic effects are intuitive and can be predicted. According to the GSA guidelines, the structure is evaluated based on the demand to capacity ratio (DCR). The DCR is the ratio of the maximum moment determined by the computer analysis to the maximum plastic moment inherent to the beam. If the DCR exceeds 2, the structure is susceptible to progressive collapse and should be redesigned.
2.2 Nonlinear Static
The nonlinear static (NS) procedure takes into account possible nonlinearities that could occur and allows for plastic hinges to form in the structure. The static load combination with the same dynamic amplification of 2 is applied to the structure. A stepwise increase of the load is applied to the structure until the full loads are attained or the structure collapses. Nonlinearities are monitored throughout every step of this analysis. The loads are increased until the maximum amplified load is reached or until the structure collapses. The advantage to this analysis case is its ability to take into account nonlinear effects. The disadvantage to this analysis case is its inability to predict dynamic effects. In addition, computational time can be great due to
convergence issues. GSA guidelines recommend to only apply this procedure to structures where dynamic behavior can be easily predicted.
2.3 Linear Dynamic
Although dynamic analyses procedures are avoided due to their complexity, they are considered more accurate because they incorporate dynamic effects such as inertia and damping. For the linear dynamic (LD) analysis procedure, the dynamic load combination is applied to the structure and DCR's are calculated to determine susceptibility of the structure to progressive collapse. The initial conditions are set as the deflected shape of the undamaged structure under the load combinations. However, for linear dynamic analysis the initial conditions can be
neglected because they are trivial. This analysis procedure is restricted to structures where nonlinearities can be predicted. The disadvantage of this analysis procedure is its inability to account for nonlinearities which are significant in larger structures where the nonlinear patterns are not easily predicted. The advantage of this analysis is its ability to accurately predict dynamic effects while maintaining a quick computational time.
2.4 Nonlinear Dynamic
Nonlinear dynamic (NLD) analysis procedure is the most complex and reliable method. This analysis case takes into account dynamic effects while considering nonlinear effect of the elements. The NLD analysis is the most thorough method because it models the dynamic removal of the column and analyzes the time history of the structural response and allows the structure to enter the inelastic range. The advantage of this method is that it takes into account both the dynamic effects as well as the material nonlinearities. This provides the user with more accurate information regarding larger deformations, energy dissipation through material yielding, cracking, and fracture. The disadvantage is the complexity of the method. The evaluation and verification of the results is a complicated process and may involve several computer analysis reruns until a stable solution is found. Evaluation and validation may be very time consuming and may require peer review requirements set by building codes (IBC 2003). This process is very time consuming and the computer analysis task requires a long analysis time.
3 Dynamic Amplification Factor
The static load combination includes a dynamic amplification factor that is meant to account for the dynamic effect. For linear and nonlinear static analyses, the current codes require the same amplification factor of 2 to be applied to all static progressive collapse load
combinations. Using 2 for the DAF stems from the fact that the amplification factor really is 2 when a load is suddenly applied to a linear single degree-of-freedom system. There are some issues with this amplification factor for progressive collapse. The same factor is used for both the linear static and nonlinear static analyses. The LS model has to be amplified to take into account both dynamic and nonlinear effects. The NLS model takes into account the nonlinear behavior and therefore would only need to be amplified for dynamic effects. However, the same dynamic amplification factor is used for both procedures.
Since the LS method is advised to be used only for small scale structures where the nonlinear and dynamic effects are easily predicted, it is possible to use a dynamic amplification factor less than 2 (Ruth et al. 2006). An amplification factor of 2 is almost certainly conservative and can result in overdesigned structures. When LS analysis is used, the allowable load is
essentially that at the first hinge formation. When using NLS analysis, plastic hinges are allowed to form and therefore the allowable load is the collapse load. Therefore, NLS allows larger loads and is more conservative than linear analysis (Marjanishvili 2004). However, the same dynamic amplification factor of 2 is used. Once again, this can result in overdesigned structures.
It is desirable from an economical standpoint to not over-design structures. As a result, it is prevalent to determine a dynamic amplification factor to be applied to static analyses for progressive collapse. The purpose of this thesis is to look at small scale structures to determine whether the dynamic amplification factor used in the LS and NLS analysis procedures is conservative and whether it can be reduced.
4 Implementation in SAP2000
SAP2000 was used to model 2D frames for several combinations of number of spans and
stories. For each frame, two scenarios were looked at: a removal of an external column and a removal of an internal column. Linear static, nonlinear static, linear dynamic and nonlinear dynamic analyses procedures were implemented to predict the response of each frame to the removed column. The LS, NLS, and LD analysis cases were compared to the NLD analysis in order to determine a DAF.
4.1 Modeling Assumptions
When the frames were modeled, several assumptions were made in order to have consistent models and in order to simplify the analysis. The 2D frames considered are all moment connected. The connections to the foundation were modeled as fixed connections as well. Default hinge properties provided by SAP2000 which correspond to the hinge definition in
FEMA 356 were used for nonlinear analyses. The damping ratio was assumed to be 1% for all
dynamic analyses. An analysis time step of 0.001 seconds was used in order to ensure the dynamic effect was fully captured. A column removal time of 0.05 seconds was used as
determined by Section 5.3. The Newmark time integration method was chosen with common values of 0.5 for gamma and 0.25 for beta. The Newmark integration method provides generally good results and convergence times (McKay, Gomez, Marchand 2009).
4.2 Loading Conditions for Analysis
The analysis was performed using the load combinations mentioned in Equations I and 2. The self-weight of the beams and columns were generated automatically based on element
ability to use the concrete as a mass source for dynamic effects while still applying the dead load of the concrete to the frame. The nature of the building is unspecified; therefore the maximum service live load of 100 psf was included. This produced a live load of 0.1 k/ft on each beam.
4.3 Procedure for Linear Static Analysis
The analysis was run using the linear static option in SAP2000. The displacements and moments were determined for the model. The analysis procedure involves the following steps:
1. Build a 2D or 3D model in SAP2000 computer program with the column removed.
2. Define the mass source to include the specified dead load pattern with a multiplier of
I as shown in Figure 3 below.
3. Define a load case with a linear analysis type case and a static load case type.
4. Apply the static load combination without the dynamic amplification factor for the purpose of this thesis.
5. Apply the dead load in the form of acceleration in the vertical direction as can be seen
in Figure 4 below. This is done to convert the mass to a force.
6. Perform the linear static analysis in SAP2000.
7. Evaluate the results. Typically, the results are evaluated based on DCR values. For
XMass Source Data
Mass Source Name JMSSSRC1
ManSource- --
-r Element Sel Man and Addtional Mass
i Specijed Load Pattems
Mass Multmlier for Load Patterns -
---Load Pattern Muwpier
IDEAD 11
Add
Modify
Delete
OK Conej
Figure 3: Mass Source Definition (DEAD includes Self-Weight)
Load Case Data -Linear Static
Load Case Name -Noes - Load Case Type
Linear Static Set Def Name Modify/Show. StaticD
Stiffness toUse Analysis Type
(9 Zeminitial Condition Unstrested State ( Linez
' Stiffness at End of N eonliMea CaseW Nonhinear
Nahna Stage Construction
Mass Source IMSSSRC1 ILoad PatrrlFLIVE .
LI
I
In
UZ
Accel Loads Appled-Load Type Load Name Scale Factor
32.2
4.4 Procedure for Nonlinear Static Analysis
The analysis procedure involves the following steps:1. Build a 2D or 3D model in SAP2000 with the column removed.
2. Define the mass source to include the specified dead load pattern with a multiplier of I as shown previously.
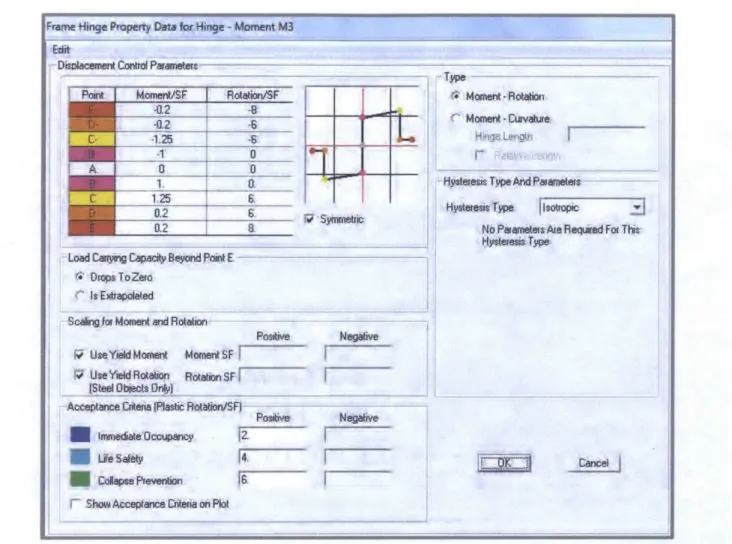
3. Define and assign nonlinear plastic hinges to ends and midspan of the beams and columns. Figure 5 below shows the graphical representation of the SAP2000 default plastic hinge definition which corresponds to the hinge definition in FEMA 356. Point A represents the origin, Point B represents yielding, Point C corresponds to plastic moment capacity, Point D indicates failure, and Point E is the residual strength.
4. Define a load case with a nonlinear analysis type case and a static load case type.
5. Apply the static load combination without the dynamic amplification factor for the
purpose of this thesis. The load combination includes live load and gravity acceleration. The nonlinear static analysis definition can be seen in Figure 6. 6. Perform the nonlinear static analysis.
7. Verify and evaluate the results. Once again, the deflections and moments will be used to compare results for the purpose of this thesis.
Frame Hinge Property Data for Hinge -Morment M3
Disolacaimert Control Paaeters -Point Moment/SF Rotatiorn/SF
-412 C- 125 _ _ A 0 1. 0. C 1.25 6. M 0.2 6.ymer 0.2 8
Load Caryig Capaity Beyond Point E 0 DropsToZero
IsExtrapolated
Scdg for Moment and Rotaihon
Positive Wo UseYieldMoment lomentSF
rw UseYieldRotation RotationSF
[Steel Objects 0n___
AcceptaneCriteia fPastic
Rotation/SF)-Posiive *
tunediate Occpiancy 12 Life Safety P4
Colse Pevention 6
R Show Acceptance Citeria on Plot
Type
rW Moment Rotaton C Moment -Curvature
Hinge Lenglh
H1ytesis Type And Puanete-Hygress: Type Ilotropic
NoPamates AreReqLad For Thi* Hlysteresis Type
Negative
Negative
Figure 5: Graphical Representation of FEMA 356 Plastic Hinges
toad Case Data Nonirear static
Load Case Nam - - -Notes
1Nonlinear Static Set Det Name j ModifY/Show.. Initial Corditions
r* Zero Initial Conditions -Start from Unstressed State r Continue from State at End of Nonlinear Case
Moa Load Case
Al Modal pedsAppied Lise ModeslromCase IMODAL
J
Loads
Appled-Load Type Load Name Scale Factor Load Patterr[ LVE Fa.25
AccelLoeI- ULIZ 32.2
Load Cae Type
Jstatic Dei gn
Anadyis Type-r Linear
4 Nonlinear
CNonlinear Staged Construction Geometric Nonlinearity Parameters
G None
(- P-Delta
' P-Delta plus Large Diplacement Mass Source MSSSRC1 Modify Delete Other Paraneters Load Application ResulttSavedr Nonlinear Parametea
i
Full Load Final State On Default Modify/ShOW. ly Modify/Show. Modify/Show CanoIcFigure 6: Nonlinear Static Analysis Definition
4.5 Procedure for Linear Dynamic Analysis
This procedure includes the following analysis steps:
1.
Build a full 2D or 3D model with column in place.
2. Perform a linear static analysis without dynamic amplification factors. Determine
static, unamplified loads in the removed column.
3. Build a 2D or 3D model with removed column. Apply equivalent reaction forces to
the joint where the column is removed. This models the presence of the column even
though it has been removed.
4. Define the mass source as mentioned in the previous analysis cases.
5.
Define a load case with a nonlinear analysis type case and a time history load case
type and a direct integration solution type.
6. Uniform time histories are used to apply live load, gravity, and equivalent reaction
forces to the structure.
7. Using the time history defined in Figure 7, the effect of the column is removed over
time. The linear dynamic analysis definition is shown in Figure 8.
8. Evaluate the results. Typically, the results are evaluated based on DCR values of the
peak value of the time history response. For the purpose of this thesis, displacement
and moment plots will be evaluated.
Fwi.n tim N~
~
x em Deqii Furctm...- --- --Tim VkeFirocton Graph-
-1tiD*GiaphG~I
mi t+++HHiFigure 7: Time History for Column Removal
0
0.05
l Tme (s)
V
EquivWent
Loads
... ... . ... -... .... . ... .... ... ... ... -... ... .... .. ... .I Twne History Functk>n Definitaw
I
Load Case Name Notes Load Case Type
lLineai Dynamic Set Dal Name Modify/Show... Time History Desig
Stiffnessto Use -Analysis Type~ Solution Type Zero ftilConditions -Unstressed State Linear Moda C Stiffness at End of Nonlineer C Nonlinear Direct ntegration
Transient
U M io tOde I MIODtAL
J
Loads Applied- -as Source
Load Type Load Name Function Soae Factor
jMSSSRC1
Load Patterr L VE I U NIFTH
j.25
Add
Load Pattern Column Loads UNIFTH 1
Accel U3 UNIFTH 322
Load Pattern Colurmn Loads Column Remove 1. dify
Delete
Show Advanced Load Parameters
Time Step Date -
-Nwnber of utput Time Steps 11OJ
Output TimeStep Size 11,MDE-03
Other Parameters
Dampng Popotional Damping Modiy/Show..
Time Integraton Newmak Modily/Show.. Cancel
Figure 8: Linear Dynamic Analysis Procedure
4.6 Procedure for Nonlinear Dynamic Analysis
The analysis requires the following steps:
1. Build a full 2D or 3D model with column in place.
2. Perform a linear static analysis without dynamic amplification factors. Determine static, unamplified loads in the removed column.
3. Build a 2D or 3D model with removed column. Apply equivalent reaction forces to the joint where the column is removed. This models the presence of the column even though it has been removed.
4. Define the mass source as mentioned in the previous analysis cases.
5. Define a nonlinear static analysis case applying the live load, gravity, and equivalent reaction forces. This is done to determine the deflected shape of the loaded,
undamaged column. This will be used as the initial conditions for the nonlinear dynamic case.
6. Perform a nonlinear time history analysis using the initial conditions determined in the nonlinear static analysis. Only apply the time history function defined in Figure 7 above to remove the column. The nonlinear dynamic analysis definition can be seen in Figure 9 below.
---- D
NamNotes----Set Dot Name Modfy/Show..
I
Iitial
Conditions-Zero niialCondtions-.Stathom UnstressedState
Continue from State at End of Noinea Cage Noninmar StatJ
LI e Moden fom Cae IMODAL I
Load Case Type
T irre Histry Ds
Anauis Type- SoluionType C Linw Modal
( Nonrieiw r Direct Integation
Geomtric Non*aityP*&tart
C None
rP-Delt
f~P-Deltaplus LatgeDisplacemet
Loads
Applied-Load Type Load Name Function Scale Factcw
Load PattefrjCo Loac Column nRem 1. MR 01111 IM-0Add JaM
Delate I Show Advanced LoadParameters
TumeStep Daa
---Number of OuWput Time Steps 110000
Output Time Step Size Othet Parameters Damping Tim Intertior Nonlinear Paimoel PropurtionalDaning Newmadk Default History Type- -Transient Mass Source Prv -Mw f1.OOOE-03 Modity/Show.. Modify/Show. Modify/Show
Figure 9: Nonlinear Dynamic Analysis Definition
Load Case Data -Nonlinear Direct Integration History
Load Case Name
!Nonei; Dynmic
5
2D Frame Analysis Results
5.1 Introduction
Analyses of 2D frames have been performed for several combinations of bays and stories. The frames range from 2x2 to 4x4 spans. Each frame was analyzed using all of the analysis procedures discussed: linear static, nonlinear static, linear dynamic, nonlinear dynamic. All four analysis procedures were used to compare dynamic amplification factors to determine if a factor
less than 2 can be used. For each frame span, two scenarios were considered. One model analyzed the removal of an exterior column and the other model analyzed the removal of an interior column. Vertical deflection at the free joint was observed as well as the moment in the beam directly above the collapse. These design criterions were used to compare the four analysis types to determine a dynamic amplification factor. Dynamic analyses time were varied
depending on how long the frame took to stabilize but typically varied between 5 seconds to 20 seconds.
5.2 Specifications
The 9 frames shown in Figure 10 and Figure 11 were used for the analysis cases. The dimensions can be seen in the figures below. Each beam had a cross section of WI 2x26 and each column had a cross section of W8x18. The width of each span was 24' and the height of each
story was 12'. The structural steel used had a modulus of elasticity of 29,000 ksi and yield stress of 50 ksi. The plastic hinges defined in Figure 5 were assigned to every beam and columns at the ends and midspan. Using these specifications, each analysis was run and post processed and can be found in Section 0 below.
2x2 W22E vOIN (a) 2W2 Frame 3x 1 2, - 22 Fra i(rn 213 Ramne AK W12-26 1d) 3x2 Fran* -e xW x16 ie) 3x3 Frame W12xI25 ____ W12i26 W2r1B
I
2X2 L (ce 2x4 FraneFigure 10: Dimensions of the 2D Frames
_______________________________ ________________________________
1
-T
,x2 Frame
I.- (K 4x3 Frae
m 44 Frame
Ofx?8
IS~1
Figure 11: Dimensions of the 2D Frames (cont.)
"j 2x26
41
dLA
5.3 Modeling Removal of a Column
An elastic static analysis was run with factored loads to determine the axial, shear, and moment in the column to be removed. The removal of the column is represented by deleting the column from the model and applying equivalent reaction forces determined from the static analysis. A time history function is defined in order to represent the presence of the column and
its removal over time. Two separate tests were run, where the beam and column sizes are varied, to determine the appropriate duration over which the column is removed. A 3x3 frame was used with the analysis output time step.
5.3.1 Column Removal for a Soft Frame
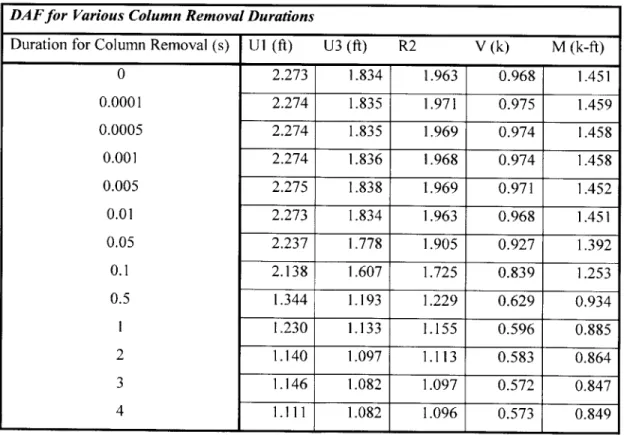
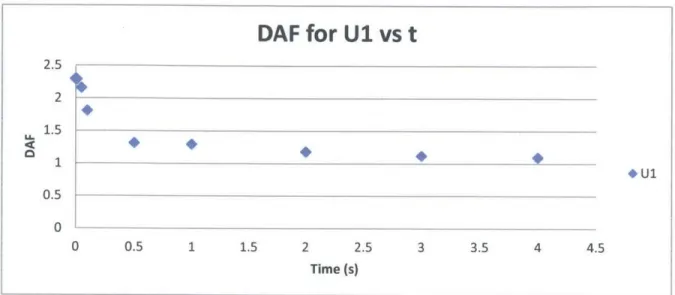
The first model represented a soft frame and had W12x26 beams and W8xl18 columns. The duration of the removal was varied from Os to 4s in increments for both tests and the results for DAF were observed and can be seen in Table I below.
Table 1: DAF for Various Column Removal Durations for Soft Frame
DAFfor Various Column Removal Durations
Duration for Column Removal (s) UI (ft) U3 (ft) R2 V (k) M (k-ft)
0 2.273 1.834 1.963 0.968 1.451 0.0001 2.274 1.835 1.971 0.975 1.459 0.0005 2.274 1.835 1.969 0.974 1.458 0.001 2.274 1.836 1.968 0.974 1.458 0.005 2.275 1.838 1.969 0.971 1.452 0.01 2.273 1.834 1.963 0.968 1.451 0.05 2.237 1.778 1.905 0.927 1.392 0.1 2.138 1.607 1.725 0.839 1.253 0.5 1.344 1.193 1.229 0.629 0.934 1 1.230 1.133 1.155 0.596 0.885 2 1.140 1.097 1.113 0.583 0.864 3 1.146 1.082 1.097 0.572 0.847 4 1.111 1.082 1.096 0.573 0.849
When the column removal duration is less than analysis output time step, the DAF is
greater than the case of the instantaneously removed column. In this case, looking at the DAF
between t=Os and t=0.0 Is, all the amplification factors are greater than those at t=Os and t=O.O Is
which have the same amplification factor. Since the output time step is greater than the time in
which the column is removed, the analysis is not capturing the full dynamic effects of the
removal. Therefore, it is necessary for the duration of the removal to be greater than the output
time step of the analysis.
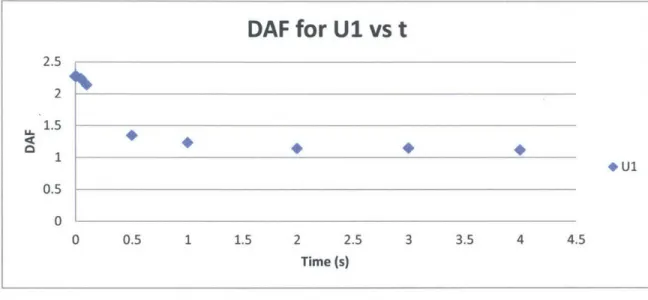
DAF for
U1
vs
t
2.5 2 1.5 01 0.5 0 0 0.5 1 1.5 2 2.5 3 3.5 4 4.5 Time (s)Figure 12: DAF for Horizontal Deflection for Various Column Removal Times for Soft Frame
DAF for U3 vs
t
2 1.5 U-*U3 0.5As can be seen in Figure 12 and Figure 13, the dynamic amplification factor for
horizontal and vertical displacements were plotted versus column removal duration. For a small duration for the removal, the dynamic amplification factor stays essentially the same. This means that a removal with a short duration is almost identical to removing the column instantaneously.
As the removal duration increases, the DAF tends to 1. This is to be expected because when a column is very slowly removed, the structures deflection will not be amplified by any dynamic effect.
5.3.2 Column Removal for a Stiff Frame
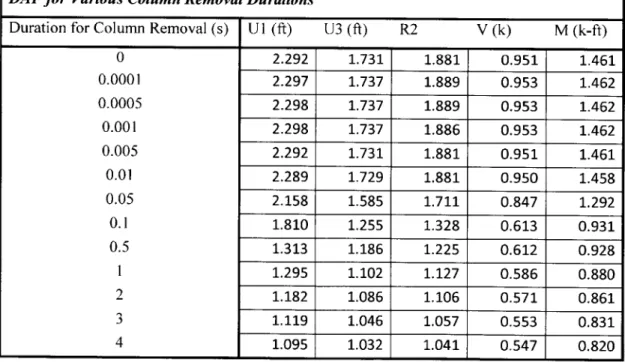
The stiffness of the frame was changed to determine whether the effect of the column removal time is dependent on the structure's properties. A 3x3 frame was used again with the same loading and the same analysis time step. The second model represented a stiff frame and had WI 8x86 beams and WI 2x50 columns. The duration of the removal was varied again from Os
to 4s in increments for both tests and the results for DAF were 2 below.
Table 2: DAF for Various Column Removal Durations for Stiff Frame
observed and can be seen in Table
DAF for Various Column Removal Durations
Duration for Column Removal (s) U 1 (ft) U3 (ft) R2 V (k) M (k-ft)
0 2.292 1.731 1.881 0.951 1.461 0.0001 2.297 1.737 1.889 0.953 1.462 0.0005 2.298 1.737 1.889 0.953 1.462 0.001 2.298 1.737 1.886 0.953 1.462 0.005 2.292 1.731 1.881 0.951 1.461 0.01 2.289 1.729 1.881 0.950 1.458 0.05 2.158 1.585 1.711 0.847 1.292 0.1 1.810 1.255 1.328 0.613 0.931 0.5 1.313 1.186 1.225 0.612 0.928 1 1.295 1.102 1.127 0.586 0.880 2 1.182 1.086 1.106 0.571 0.861 3 1.119 1.046 1.057 0.553 0.831 4 1.095 1.032 1.041 0.547 0.820
For a duration for the column removal near the time for the analysis output time step, the
DAF remains about the same meaning that the column is essentially instantaneously removed.
As shown in Figure 14 and Figure 15 below, the DAF tends to I when the column removal time is slow. This shows that for both frames, a stiff or a soft frame, the effect of the column removal is the same. Therefore, it would be beneficially to know exactly how the column is removed. It is crucial not to overestimate the time for the removal of the column because an overestimation of the time can cause the structure to be under designed. If the duration of the removal of a column is overestimated, the DAF can be underestimated since it tends towards 1, which can lead to under designed structures. According to McKay, Gomez, and Marchand (2009), the column removal time should be modeled as 1/20 of the structures natural period. Using a sample 2x3 frame to test this recommendation, the natural period of the frame is 1.03 seconds. Using 1/20 of the structures natural period corresponds with a removal time of 0.05seconds.Therefore, a column removal duration of 0.05s will be used for the remainder of the analyses.
DAF for
U1
vs
t
2.5 2 1.5 1 0.5 0 *U1 1 1.5 2 2.5 3 3.5 Time (s)Figure 14: DAF for Horizontal Deflection for Various Column Removal Times for Stiff Frame
DAF for U3 vs
t
2 1.5 LA-1 0.5$
*U30
- - -0 0.5 1 1.5 2 2.5 3 3.5 4 4.5 Time (s)Figure 15: DAF for Vertical Deflection for Various Column Removal Time for Stiff Frame
0
0.5 4 4..5-5.4 Results
Displacement response curves and moment response curves were plotted and looked at to
determine dynamic amplification factors. Displacements and moments for the amplified and
unamplified linear static analysis and linear dynamic analysis were compared to the nonlinear
dynamic analysis to determine DAF. The amplified nonlinear static (ANLS) analysis was
compared to the nonlinear dynamic by maximum displacement, maximum moment, and the
number of hinges formed.
5.4.1 2x2 Frame
5.4.1.1 Exterior Column Removed for 2x2 Frame
Figure 16 shows the vertical deflection at the node where the column was removed. As
previously mentioned, the linear static analysis was run without the dynamic amplification
factor. The amplified linear static results were plotted on the graph as well. The linear static
displacement of the free node is -0.82 feet and the amplified linear static deflection is -1.63 feet.
The linear dynamic analysis shows that the initial removal of the column causes amplification
but it ultimately stabilizes at the unamplified linear static deflection. The maximum displacement
for the linear dynamic analysis is -1.29 feet and the stabilized deflection is -0.84 feet.
Vertical Displacement vs Time for 2x2 Exterior Column
Removal
0.2 0 -0.2 2 4 6 8 10 12 -0.4 -0.6 -- Linear Dynamic -0.8 - Nonlinear Dynamic 8Linear Static (DL+0.25LL)The displacement in the nonlinear dynamic analysis case exceeds the displacement
shown for the linear dynamic analysis. The reason for this is the formation of plastic hinges in
the frame. Once the plastic hinges form, the forces have to redistribute to adjacent members to
transfer the load. The maximum displacement for the nonlinear dynamic analysis is -1.62 feet. In
this case, the amplified linear static analysis case compares best to the nonlinear dynamic
analysis. The maximum displacement for all the analysis cases can be seen in Table 3 below.
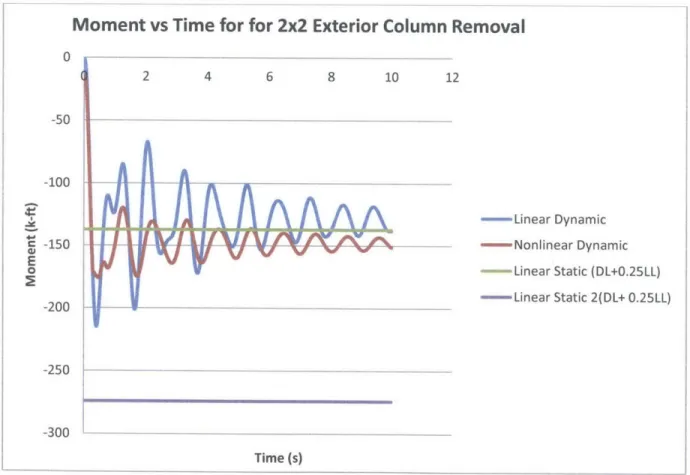
Figure 17 shows the moment response curve for the member above the removed column.
The maximum unamplified linear static moment is -137 k-ft and the amplified linear static
moment is -274 k-ft. As can be seen in Figure 17, the linear dynamic and nonlinear dynamic
moments are significantly less than the amplified linear static moment.
Moment vs Time for for 2x2 Exterior Column Removal
0
-50 -100 2 4 6 8 10 12 - Linear Dynamic - Nonlinear Dynamic Linear Static (DL+0.25LL) - Linear Static 2(DL+ 0.25LL) -250 -300 Time (s)Figure 17: Moment in Member Above Removed Column for a 2x2 Exterior Column Removal
4a. E 0 -150 -200 (
The maximum linear dynamic moment is -215 k-ft and the maximum nonlinear dynamic
moment is -152 k-ft. These values are significantly lower than the amplified linear static moment
of -274 k-ft. The dynamic amplification factors for the analysis cases can be found in Table 3
below.
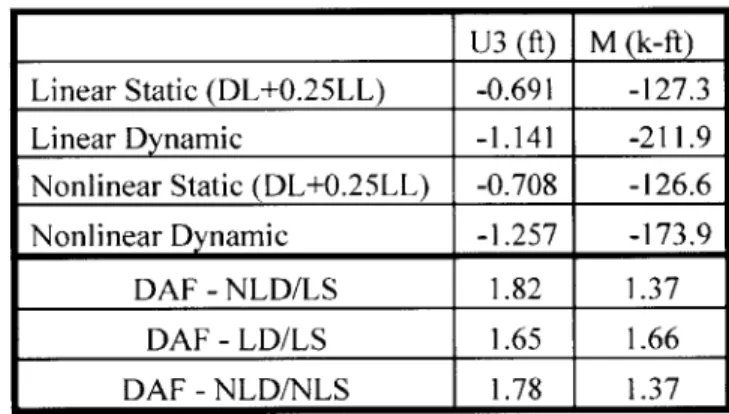
Table 3: DAF for 2x2 Frame with Exterior Column Removal
U3 (ft) M (k-ft) Linear Static (DL+0.25LL) -0.816 -137.0 Linear Dynamic -1.292 -215.1 Nonlinear Static (DL+0.25LL) -0.993 -152.4 Nonlinear Dynamic -1.618 -176.0 DAF -NLD/LS 1.98 1.28 DAF - LD/LS 1.58 1.57 DAF - NLD/NLS 1.63 1.16
Another situation to look at is the plastic hinges that form in the nonlinear analysis. Since
the nonlinear static model was run without an amplification factor to determine a DAF, another
nonlinear static model was created with a DAF of 2 to compare the accuracy of the nonlinear
static analysis to the nonlinear dynamic analysis. As can be seen in Figure 18, the nonlinear static
analysis was able to form all except one plastic hinge in comparison to the nonlinear dynamic
case. The amplified nonlinear static analysis shows a displacement of -1.34 feet which is a
similar displacement to the linear dynamic case.
Nonlinear Dynamic E
Nonlinear Static
p0 0c
5.4.1.2 Interior Column Removed for 2x2 Frame
Figure 19 shows the deflection at the midspan of the beam spanning the interior removed column. The unamplified linear static deflection is -0.37 feet and the amplified linear static deflection is -0.73 feet. The maximum linear dynamic displacement at midspan is -0.67 feet and stabilizes at the unamplified linear static deflection. The maximum nonlinear dynamic deflection is -0.73 feet. This is identical to the deflection determined by the linear static analysis using 2 for the DAF. The nonlinear dynamic case shows a permanent deformation of -0.55 feet which is greater than the linear dynamic case. This is due to the formation of plastic hinges in the nonlinear analysis.
Vertical Displacement vs Time for 2x2 Interior Removed Column
0 r
-
--
-
-1 2 1 4 q . - Linear Dynamic - Nonlinear Dynamic Linear Static (DL+0.25LL) -Linear Static 2(DL+ 0.25LL) Time (s)Figure 19: Vertical Deflection at Free Node for a 2x2 Interior Column Removal
-0.2 -0.3 -0.4 -0.5 -0.6 -0.7 -0.8
-1-
-
-
--T
Figure 20 shows the moment in the member being considered. The unamplified linear static moment is 114 k-ft and the amplified static moment is 228 k-ft. The maximum linear dynamic moment is 224 k-ft. The moment in the linear dynamic analysis is very similar to the linear static analysis with DAF included. The moment for the nonlinear dynamic analysis is smaller because when the plastic hinges form, the moment cannot exceed the plastic moment of that section. Therefore, for nonlinear dynamic analysis, the moment can never reach the linear dynamic moment because it is above the plastic moment.
Moment vs Time for 2x2 Interior Removed Column
2.50E+02
2.OOE+02
A
1.50E+02- Linear Dynamic
1.00E+02 --- Nonlinear Dynamic
0--Linear Static (DL+O.25LL)
- Linear Static 2(DL+ 0.25LL) 5.OOE+01 -O.OOE+00 1 2 3 4 5 6 -5.OOE+01 Time (s)
Table 4: DAF for 2x2 Frame with Interior Column Removal U3 (ft) M (k-ft) Linear Static (DL+0.25LL) -0.366 113.9 Linear Dynamic -0.671 224.2 Nonlinear Static (DL+0.25LL) -0.369 114.7 Nonlinear Dynamic -0.732 193.3 DAF -NLD/LS 2.00 1.70 DAF - LD/LS 1.83 1.97 DAF -NLD/NLS 1.98 1.69
As mentioned before, the NS case was run without a dynamic amplification factor. It is necessary to look at this case with the amplification factor to determine the accuracy of using a
DAF of 2 for this analysis case. The ANLS analysis shows a displacement of -1.38feet which
greatly exceeds all other cases for this frame. The deflection is large for the ANLS analysis because of all the plastic hinges that form. As seen in Figure 21, the members begin to yield and some begin to surpass immediate occupancy acceptance criteria. One hinge surpasses life safety acceptance criteria. The acceptance criterion is a function of the rotation about the plastic hinge. The detailed acceptance criteria can be found in FEMA 356. In this frame, the NLS analysis overestimates the response of the frame. The LD analysis would be reasonable to use in this case
since the responses are relatively similar to the NLD case. The LS case is reasonable to use as well; however, it overestimates the deflection and moment which could lead to an overly conservative design.
Figure 21: Plastic Hinge Comparison for 2x2Interior Removed Column
Nonlinear Dynamic
CI
LS F17 10 Nonlinear Static C LSK
cl0
I
L
5.4.2 2x3 Frame
The comparison of the analysis methods was repeated for a 2x3 frame in order to determine the effect of geometry on amplification factors.
5.4.2.1 Exterior Column Removed for 2x3 Frame
By looking at the displacement response curves for the analysis cases, it is evident that the linear static analysis with the dynamic amplification factor overestimates the deflection and that the linear dynamic analysis underestimates the deflection. The maximum linear dynamic displacement is -1.13 feet and its permanent stabilized deflection is -0.78 feet. The maximum nonlinear displacement is -1.36 feet and its permanent deflection is -1.15 feet. The maximum deflections for the different analysis cases can be seen in Table 5. The graphs for vertical displacement and moment can be found in Appendix 8.1.
Table 5: DAF for 2x3 Frame with Exterior Column Removal
U3 (ft) M (k-ft) Linear Static (DL+0.25LL) -0.745 -130.6 Linear Dynamic -1.134 -209.5 Nonlinear Static (DL+0.25LL) -0.759 -130.1 Nonlinear Dynamic -1.357 -174.6 DAF -NLD/LS 1.82 1.34 DAF -LD/LS 1.52 1.60 DAF -NLD/NLS 1.79 1.34
The moment response curves show that the amplified linear static analysis significantly overestimates the moment. The moment for the linear dynamic analysis is similar to the moment
Table 5 shows the maximum deflection and moment at the observed location. As
can be seen, all values for dynamic amplification are below 2 for this case. The linear static analysis overestimates the deflection and moment by a significant amount.
The plastic hinges were compared for the nonlinear static and nonlinear dynamic cases to determine the accuracy of the nonlinear static analysis case. Since the deflection and moment values in Table 5 don't include a DAF, another model was built with the DAF included to
determine the location and values of the plastic hinges. The amplified nonlinear static analysis shows a displacement of -1.61 feet which exceeds the nonlinear dynamic deflection. Therefore, the nonlinear static analysis case produces a more conservative design. However, it was fairly accurate in determining the locations of the plastic hinges. The nonlinear static analysis displays most of the plastic hinges that the nonlinear dynamic case displays with the exception of two hinges. p p LS 10 Nonlinear Dynamic B
Figure 22: Plastic Hinge Comparison for a 2x3 Exterior Column Removal
D
LS
~I]
10Nonlinear Static
5.4.2.2 Interior Column Removed for 2x3 Frame
The maximum linear dynamic deflection is -0.68 feet and the frame stabilizes at -0.37 feet which is the unamplified linear static deflection. The maximum nonlinear deflection is -0.729 feet and its permanent deflection is -0.539 feet. The amplified linear static deflection is
greater than the linear dynamic deflection and the nonlinear dynamic deflection at the same node. This demonstrates that the linear static analysis with a dynamic amplification of 2 overestimates the deflection at the damaged column. The displacement response curves can be found in Appendix 8.2.
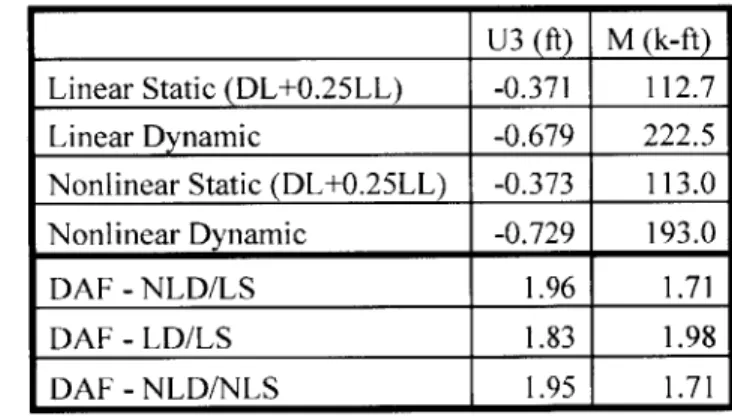
Table 6: DAF for 2x3 Frame with Interior Column Removal
U3
(ft) M k-ft
Linear Static (DL+0.25LL) -0.371 112.7 Linear Dynamic -0.679 222.5 Nonlinear Static (DL+0.25LL) -0.373 113.0 Nonlinear Dynamic -0.729 193.0 DAF - NLD/LS 1.96 1.71 DAF -LD/LS 1.83 1.98 DAF - NLD/NLS 1.95 1.71The amplified linear static analysis case overestimates the moment for the beam above the removed column. Due to the formation of plastic hinges, the maximum moment in the nonlinear dynamic analysis case is limited to the plastic moment. The maximum moment for the linear dynamic case is 223 k-ft and its final moment in the member is 120 k-ft. The maximum moment for the nonlinear dynamic case is 193 k-ft and the moment stabilizes at 125 k-ft for this case. The linear case overestimates the maximum moment which could lead to overdesign of the structure. The final stabilized moment for both the linear and nonlinear dynamic is on average
For this 2x3 span case where the interior column is removed, out of all the analysis tasks run, the linear dynamic analysis estimates the behavior of frame the best. The deflection is slightly underestimated but the moment is slightly overestimated in the linear dynamic analysis case. This would lead to a moderate design. Whereas, designing by linear static analysis with a dynamic amplification factor would lead to a conservative design. Table 6 show the dynamic amplification factors for each analysis case. As can be seen, the amplification factors are all less than 2.
Figure 23 shows the plastic hinges that form in the nonlinear dynamic analysis and the nonlinear static analysis. As can be seen, the nonlinear static analysis correctly depicts the location of the plastic hinges; however, this analysis case shows that the state of some of the plastic hinges exceed acceptance criteria by reaching the immediate occupancy and life safety limit states. Therefore, for this span frame, using a DAF of 2 for the nonlinear static analysis is very conservative.