HAL Id: hal-00317287
https://hal.archives-ouvertes.fr/hal-00317287
Submitted on 2 Apr 2004
HAL is a multi-disciplinary open access
archive for the deposit and dissemination of
sci-entific research documents, whether they are
pub-lished or not. The documents may come from
teaching and research institutions in France or
abroad, or from public or private research centers.
L’archive ouverte pluridisciplinaire HAL, est
destinée au dépôt et à la diffusion de documents
scientifiques de niveau recherche, publiés ou non,
émanant des établissements d’enseignement et de
recherche français ou étrangers, des laboratoires
publics ou privés.
machine vision
M. T. Syrjäsuo, E. F. Donovan
To cite this version:
M. T. Syrjäsuo, E. F. Donovan. Diurnal auroral occurrence statistics obtained via machine vision.
Annales Geophysicae, European Geosciences Union, 2004, 22 (4), pp.1103-1113. �hal-00317287�
Diurnal auroral occurrence statistics obtained via machine vision
M. T. Syrj¨asuo and E. F. DonovanInstitute for Space Research, University of Calgary, Alberta, Canada
Received: 21 March 2003 – Revised: 8 August 2003 – Accepted: 1 September 2003 – Published: 2 April 2004
Abstract. Modern ground-based digital auroral All-Sky
Im-ager (ASI) networks capture millions of images annually. Machine vision techniques are widely utilised in the retrieval of images from large data bases. Clearly, they can play an im-portant scientific role in dealing with data from auroral ASI networks, facilitating both efficient searches and statistical studies. Furthermore, the development of automated tech-niques for identifying specific types of aurora opens up the potential of ASI control software that would change instru-ment operation in response to evolving geophysical condi-tions. In this paper, we describe machine vision techniques that we have developed for use on large auroral image data sets. We present the results of application of these techniques to a 350 000 image subset of the CANOPUS Gillam ASI in the years 1993–1998. In particular, we obtain occurrence statistics for auroral arcs, patches, and Omega-bands. These results agree with those of previous manual auroral surveys.
Key words. Ionosphere (Instruments and techniques)
Gen-eral (new fields)
1 Introduction
The spatial structure and temporal evolution of the auroral luminosity distribution result from the time history of the so-lar wind-magnetosphere interaction and the physics of the magnetosphere-ionosphere interaction. Surveys of optical data obtained from the ground and from space have estab-lished the existence of the ever-present auroral oval, as well as variations in its overall brightness distribution and the lati-tudes of its poleward and equatorward boundaries (Feldstein, 1963; Akasofu, 1966). These are both local time (i.e. “LT”) and temporal (i.e. “UT”) variations. Simple examples of this variation are that the oval is on average at higher ge-omagnetic latitudes at dusk and dawn than at midnight (an LT variation), and that the overall distribution moves
equa-Correspondence to: M. T. Syrj¨asuo
torward and poleward as a consequence of magnetospheric energy loading and dissipation (a UT variation).
Within the oval, the spatial structure and overall brightness also evolve in time. Early auroral research led to the iden-tification of several types of aurora, some that have turned out to be characteristic of the ionospheric footpoint of spe-cific magnetospheric regimes (cf. Feldstein and Elphinstone, 1992), and others indicating ongoing dynamic activity. For example, near the equatorward edge of the evening sector auroral oval there is often proton precipitation in the absence of electron precipitation. This indicates field lines thread-ing the inner magnetosphere, earthward of Central Plasma Sheet (CPS) electron drift paths, and tailward of the inner edge of strong pitch angle scattering of CPS protons (Ejiri, 1978; Sergeev et al., 1983; Samson et al., 1992).
Specific electron auroral morphologies include arcs, patches, and Omega-bands. In this study, we use data from the CANOPUS (Canadian Auroral Network for the OPEN Program Unified Study) Gillam All-Sky Imager (ASI) (Ros-toker et al., 1995; Donovan et al., 2003). The instrument’s characteristics and typical data are discussed below. At this point, we define the auroral features mentioned here in terms of their appearance in a single ASI image. We define arcs to be elongated east-west aligned auroral structures that stretch across most or all of the ASI field-of-view (FOV), with thick-nesses (at ∼110 km) ranging from several to tens of kilome-tres. This definition is consistent with that used in previous manual statistical studies of auroral arc orientation, occur-rence, and thickness (e.g. Stringer and Belon, 1967; Gustafs-son, 1967; Akasofu et al., 1972; Nevanlinna and Pulkkinen, 2001; Knudsen et al., 2001). Omega-bands are distortions in the poleward boundary of the diffuse electron aurora, with azimuthal scale sizes that are typically comparable to an ASI FOV (Akasofu and Kimball, 1964; Opgenoorth et al., 1983). Patchy auroras consist of amorphous emission struc-tures with temporally evolving boundaries and scale sizes on the order of tens to hundreds of kilometres. During patchy auroras, the ASI FOV typically contains numerous patches.
Over the last forty years, a picture of the global mor-phology has emerged on the basis of extensive ground and space-based optical observations. This consists of the auroral oval, centred roughly on the geomagnetic pole, with a typi-cal latitudinal extent of 5–10◦ and an equatorward bound-ary that is typically at 65◦magnetic latitude at midnight and at somewhat higher latitudes at other local times (Feldstein, 1963; Akasofu, 1966). Arcs are a pervasive morphology, oc-curring at essentially all local times (e.g. Stringer and Belon (1967); Gustafsson (1967)), from the poleward boundary of the oval equatorward to the proton and/or electron isotropic boundaries (Lyons et al., 1988; Yahnin et al., 1997). Statis-tical studies indicate that arc occurrence peaks on the night side (i.e. Nevanlinna and Pulkkinen (2001)). Omega-bands are morning sector phenomena that occur either following or during substorm activity in the midnight sector (Akasofu et al., 1972; Opgenoorth et al., 1983, 1994). Patchy auroras occur in the late morning to dawn sector and under a range of geomagnetic conditions.
We restrict our definition of an auroral arc to elongated forms which are more or less L-shell aligned (i.e. east-west). The conditions under which arcs form typically last tens of minutes to several hours. This can be at least inferred from plots showing the location and alignment of arcs in the survey papers of Stringer and Belon (1967) and Gustafsson (1967). In recent years, north-south aligned auroral features have re-ceived considerable attention due to their demonstrated asso-ciation with transient magnetospheric phenomena (Hender-son et al., 1998; Zesta et al., 2000). While many north-south structures share the same fundamental morphology (i.e., they are elongated discrete auroral features) as typical east-west aligned auroral arcs, they are considerably more rare and are in general transient, lasting only one to several minutes.
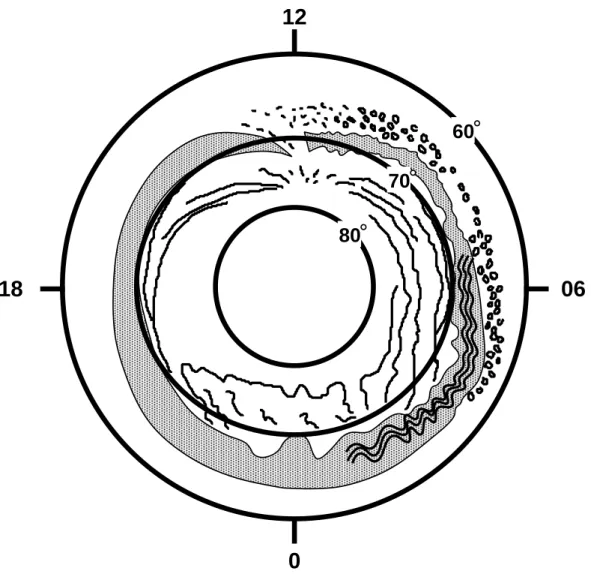
The schematic diagram in Fig. 1 illustrates the essence of the Akasofu auroral distribution. This picture was arrived at on the basis of early ground-based auroral surveys and contains phenomena that are ever-present (i.e. the oval), fre-quently occurring and lasting for periods of hours or more (i.e. arcs and patches), and more infrequent and typically associated with significant transient magnetospheric events (i.e. Omega-bands and the north-south auroral forms dis-cussed below). On a typical night, a single station (or set of stations) rotates under this distribution. The FOV of the CANOPUS ASI located at Gillam Canada is indicated in Fig. 2, as are the scan planes of the CANOPUS Gillam and Rankin Inlet Meridian Scanning Photometers (MSPs). In Fig. 3, we present keograms constructed using data from the Gillam and Rankin Inlet MSPs, obtained on three different nights. We also include six images from the Gillam ASI. The keograms illustrate the typical diurnal variation associ-ated with motion under the auroral oval, most notably in the auroral “motion” from higher to lower to higher latitude as the stations sweep through from dusk to midnight to dawn. Also clearly visible in the keograms are substorm associated changes in the auroral latitude and brightness distributions. Changes over each night in the character of the discrete au-roral features reflect a combination of diurnal variation and
geomagnetic activity. The six images are examples of arcs (A & C), patches (B & D), a north-south auroral structure (E – see below), and an Omega-band (F).
In recent years, the digital ASI has become an important tool in auroral and magnetospheric physics. As increasingly large ASI arrays, such as MIRACLE (Syrj¨asuo et al., 1998) and NORSTAR (Donovan et al., 2003) operate with con-stantly increasing frame rates and CCD size, the size of the resulting data set is becoming formidable. At the present time, the MIRACLE and NORSTAR arrays deliver upwards of 6 000 000 and 3 000 000 images annually. Despite the ad-vances in computer science, ASI images are mostly analysed manually. This approach is well motivated especially if the data are used, for example, in supporting satellite measure-ments, but does not fully utilise the whole data set. In gen-eral, analysing a large number of auroral images manually for a statistical study can be done (e.g. Nevanlinna and Pulkki-nen, 2001; Knudsen et al., 2001), but repeated analysis to refine results is difficult to justify. Furthermore, newer data sets are large enough that manual studies are not practical.
In this paper, we describe automated pattern recognition (herein referenced to as “machine vision”) techniques that we are developing for application to auroral studies. Fur-thermore, we present the results of applying these techniques to the CANOPUS ASI data set, delivering in particular the local time occurrence statistics of auroral arcs, patches and Omega-bands.
2 Machine vision approach to image classification
There is clearly strong motivation for developing techniques for automatic classification of ASI images. Such tools could be applied to large data sets in statistical studies of the au-rora, to cull enormous data sets quickly with the objective of identifying auroral events of a particular type, and to quan-tify the temporal evolution of the auroral distribution. Devel-oping such algorithms would also further clarify our under-standing of the aurora by forcing us to further develop what are presently somewhat subjective definitions of auroral type (for example, arc, patch, Omega-band, and north-south struc-ture), making them more objective and suitable for quantita-tive studies.
In this paper, we describe our initial attempts to develop and systematically apply automated pattern recognition tech-niques to a 350 000 image subset of the CANOPUS Gillam ASI data obtained between 1993 and 1998. More specifi-cally, we developed a “training set” by manually identifying good examples of each of the three auroral forms of interest here (i.e. arc, Omega-band, and patchy). We use techniques from the fields of pattern recognition and content-based im-age retrieval in order to classify each imim-age as belonging to one of the three classes (arcs, patches, and Omega-bands), or as “other”. Note that we attempt to separate east-west arcs from north-south structures by incorporating a quantitative assessment of orientation into our analysis. Our approach is to identify “features” that can be quantified (a simple
18
06
0
80
70
60
Fig. 1. Schematic of auroral distribution modified slightly from Akasofu (1966). Note that the original figure was constructed on the basis of ground-based observations made before global imaging from space was possible. As such, it incorporates a mixture of diurnal (local time) and temporal (universal time) variations.
example of a feature is average brightness), and that corre-spond to basis vectors that span a hyperspace that we call our “feature space”. In this way, a vector representation is gen-erated for each image in the overall data set. The objective is to develop features such that image-image distance in fea-ture space is a meaningful way of determining how similar the images are to each other in terms of our general under-standing of auroral morphology.
In principle, in a well constructed feature space, different hypervolumes correspond to different types of aurora. Hav-ing a trainHav-ing set consistHav-ing of several hundred auroral im-ages that have been classified as arcs, patches, or Omega-bands makes it possible to identify these hypervolumes. For any new image – referred to as a “query image” – its location in the feature space can be determined. Then, the image is classified based on the training set images that are closest to it in the feature space. If most or all of the closest training im-ages are, for example, arcs, then the query image is classified
as an arc. The same is true for patches and Omega-bands. The effectiveness of such image classification is strongly af-fected by the quality of the training set, and the features cho-sen upon which feature space is constructed. Furthermore, as in the case of polynomial fitting of data, it is more preferable to utilise lower, rather than higher dimensional representa-tions.
In an earlier study, we utilised a simple version of our present approach to separate images that contained, and did not contain aurora (Syrj¨asuo and Donovan, 2002). We found that a two-dimensional feature space (average brightness and peak brightness) had two subvolumes separated by an almost straight line, and that virtually all images on one side of the line contained aurora and all images on the other side were either of blanketing clouds or clear skies absent of aurora.
In what follows, we expand on our earlier work by em-ploying an extended training set, more features, and attempt-ing to classify auroral images as belongattempt-ing to one of three
types: arcs, patches, or Omega-bands. In the present study, we restrict our attention to elucidating the diurnal occurrence statistics of these three auroral types.
3 Instrumentation, data and training set
The CANOPUS ASI was operated at Gillam Canada (56.4◦ north and 265.4◦east geodetic; ∼67.3◦Invariant) from 1986 through to 2001 (Rostoker et al., 1995; Donovan et al., 2003). This was a typical instrument used in auroral research: a fish-eye lens provided a field-of-view covering the whole sky and, after optical filtering (through ∼2 nm band-pass filters), the image was intensified and captured by a CCD (charge-coupled device) camera. Prior to 1993, the ASI operated in a low spatial resolution mode, delivering images in three sci-entific wavelength (558, 428, and 630 nm) at a cadence of three images per minute per filter. During and after 1993, the spatial resolution was increased, the 428 nm measurements were dropped, and the frame rate decreased to one image per minute per filter. The higher spacial resolution images are 200×200 pixels with a 16-bit intensity reduced to a quasi-logarithmic 8-bit value. The exposure time for 558 nm im-ages was 1.6 s. In this study, we used more than 350 000 images (558 nm) collected from 1993 to 1998.
We identified four main categories of auroral appearance in the all-sky images:
0. No aurora: no visible auroral activity; 1. Arcs: one or more auroral arcs;
2. Patchy aurora: irregular patches of auroral intensity vis-ible in the whole field-of-view;
3. Omega-band: brighter shapes that resemble those seen when an Omega-band is visible in the field-of-view; 4. Other/Reject: shapes that cannot be put into any of the
previous categories, such as diffuse aurora, combina-tions of different types of aurora, north-south structures, etc.
All images in the category “no aurora” should be rejected before the shape analysis. Fortunately, this can be performed automatically as we demonstrated in Syrj¨asuo and Donovan (2002). The method is based on a sample set of images that have been manually classified as containing aurora or not containing aurora, and a two-dimensional feature space as described briefly in the Introduction above. Given an unseen image, we compare the average and maximum brightness to those in the sample set in order to identify most similar im-ages, whose classification can be used to determine the most likely class of the unseen image.
The rejection of “no aurora” category reduces the number of images to be analysed from 350 000 to 220 000. From the remaining categories, arcs are the most subjectively distinct and have been located in a less sophisticated automated fash-ion in an earlier study (Syrj¨asuo et al., 2001; Kauristie et al.,
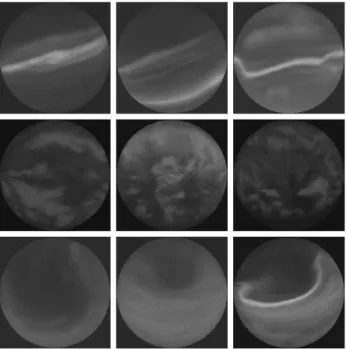
2001). Nevertheless, all categories represent a high-level hu-man concept that must be transferred into a numeric form. In order to capture this human concept, one of the authors (EFD) provided a training set consisting of 258 good qual-ity sample images for the categories of arcs (130), patchy auroras (109) and Omega-bands (19), which we judged to be the most unambiguous auroral types that were frequently encountered in the data set. Sample images from these cate-gories are shown in Fig. 4.
4 Image content classification
4.1 Content analysis and image feature space
A straight-forward and intuitive approach to image content analysis is to determine the most similar images, for a query image, in the training set. These previously unseen images can then be classified to the class of most similar images in the training set. Humans are experts at detecting similarity, but extracting the similarity automatically is not trivial.
In pattern recognition, a number of representative numeric features are used in classification of data (Therrien, 1989). For example, the average brightness in the image or the his-togram of intensity values can be used as features. Usually a single feature does not provide satisfying classification per-formance, and several features are used instead. The fea-tures’ form a basis of the multi-dimensional feature space. Each image – or its contents – can be associated with a point in this feature space. For example, using the features av-erage brightness Bmean and maximum brightness Bmax, the
resulting feature space is two dimensional. An image with
Bmean = 30 and Bmax = 100 can be represented by f =
[30, 100]. At the other extreme, a feature vector consisting of all pixel values in the image forms a 40 000-dimensional space (200×200 pixels).
Comparing the contents of images is performed by com-paring the feature vectors. A mathematically convenient so-lution is to use distances. In our two-dimensional feature space example above, a distance measure between two im-ages represented by f(1) = [30, 100] and f(2) = [50, 250] could be the Euclidian distance S =
f (1)−f(2) 2. A third
image f(3)= [10, 40] is closer to f(1)than f(2)and hence, more similar, too. Depending on the features, defining a dif-ferent distance may be more appropriate.
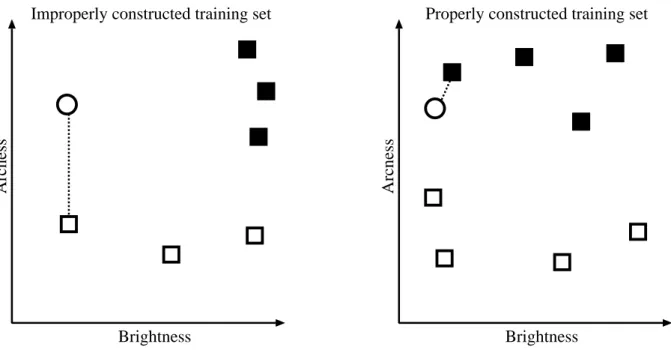
Intuitively, if two images have similar contents and if the features capture this property, the image locations in the fea-ture space should be close to each other. Conversely, dis-tant points in the feature space should correspond to dissim-ilar images. Unfortunately, this intuition can break down, because the features do not necessarily capture the human higher-level concept properly. This is illustrated in Fig. 5: using qualitative features representing brightness and “arc-ness” we have a query image and manually classified arc and non-arc images, which form the training set. We then clas-sify the query image to the class represented by the nearest image in the training set. In the left panel, the query image is
GILL
RANK
65
70
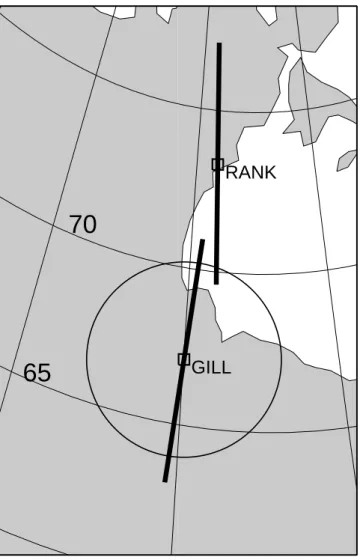
Fig. 2. The ASI used in this study is located at Gillam, Manitoba (56.4◦north, 265.4◦east). The circle indicates the Gillam ASI FOV assuming an emission altitude of 110 km. As well, we also show the FOVs of the Gillam and Rankin Inlet MSPs, again assuming an emission height of 110km. Contours of constant geomagnetic latitude (at 5◦spacing) and longitude (at 15◦ or 1 h magnetic local time spacing) are also shown.
classified as a non-arc despite its arcness – we are comparing a dim arc to a bright arc. In the right panel, we have sample arcs at all brightness levels and the query image is classified correctly. We included as many images of arcs, patchy auro-ras and Omega-bands as possible in our training set without excessively tedious manual labour.
4.2 Classification
Given a query image, we determine its location in the feature space and examine the nearby region. The closest training set images – or neighbours – are used to determine the category of the query image. If all neighbours represent the “arc” cat-egory, then the query image most likely also contains an arc. On the other hand, if there is no single dominant category among the neighbours, the classification of the query image is ambiguous.
As mentioned above, a single image feature does not usu-ally provide good classification results and several features are needed. We used features dedicated for (1) auroral
bright-ness, (2) north-south and (3) east-west aligned brightness dis-tribution, and (4) a multi-scale texture measure. The result-ing feature space is a hyperspace and the “meanresult-ing” of each basis is illustrated in Fig. 6. Once extracted, the features are normalised across the training data set. The total image-to-image distance is calculated as a weighted sum of individ-ual feature distances. Mathematical details are given in the Appendix.
We utilised a variation of the K-nearest-neighbours (KNN) classifier for determining the contents of an auroral image. A KNN classifier outputs the class to which the majority of the neighbouring samples belongs to, and it has been shown that its error is never more than twice that of a Bayesian classifier, which is the optimal classifier in a statistical sense (Devroye et al., 1996). Since our stricter classifier provides an output class only if all neighbouring samples are in the same class, we can assume that its error should be smaller or equal to that of a standard KNN classifier, because all problematic cases are rejected and left without classification.
A
B
960120
C
D
990119
E
F
00
01
02
03
04
05
06
07
08
09
10
11
12
UT (hours)
960216
Fig. 3. Keograms from three nights constructed from 558 nm data collected by the CANOPUS Gillam and Rankin Inlet MSPs. The latitudinal extent of the ASI FOV is indicated by the two horizontal black lines. We include six 558 nm ASI images from Gillam, showing arcs (A) & (C), patches (A) & (D), a north-south aligned auroral form (E), and an Omega-band (F).
Fig. 4. Sample images from the three main auroral shape categories. Rows from top to bottom: auroral arcs, patchy auroras and Omega-bands.
4.3 Automated analysis of temporal distribution
We used the previously described scheme to analyse several years worth of auroral images automatically in order to deter-mine the relative temporal occurrence of arcs, patchy auroras and Omega-bands. For each image a unique ordering of the training set was determined based on the distances between the query and training images. Only if the five most similar images belonged to the same category, the query image was given the same classification. All other images were rejected (class “other”). This approach left us with only the strongest cases of occurrences for each shape category and neglected more ambiguous auroral appearances. Finally, the individual occurrence distributions were smoothed and normalised by the total number of all images with auroral activity for the same time instant.
Figure 7 shows the resulting distribution curves. The clas-sification, which discarded ambiguous shapes, detected ap-proximately 17000 auroral arcs, 9700 patchy auroras and 600 Omega-bands. Because we cannot determine the ac-tual number of arcs, patchy auroras or Omega-bands in the whole image set, we studied only the relative occurrence within each category. Not surprisingly, auroral arcs occur mostly in the evening sector with a maximum at approx-imately 21 magnetic local time (MLT). Omega-bands and patchy auroras have clearly distinct maxima at 03:00 and 06:00 MLT, respectively.
4.4 Error analysis
The experimental error was determined by first re-classifying the training set. Here, one expects that each image should be
Image test set Correct classification (%) The training set with strict rules 99±0.5
The training set set with standard KNN 90±3 Auroral arcs (593/600) 99% Patchy aurora (533/600) 89% Omega-bands (59/500) 12%
classified to the category it represents. The analysis indicated that for any practical purposes, the classifier can be consid-ered errorless. For comparison, we also used the standard KNN classifier, in which all closest neighbours need not to be within one category. Now, even the problematic cases – for example, neighbouring samples are two arcs and three patchy auroras – are classified instead of being rejected as shapes which are too ambiguous . This results in poorer per-formance with a 90±3% correct classification.
To evaluate the classifier performance in the full data set, we analysed 1700 randomly chosen images and compared their manual and automatic classifications. Arcs and patchy auroras were accurately classified, whereas Omega-bands are clearly more problematic. Table 1 summarises the error anal-ysis.
5 Discussion
The image contents were analysed without using the tem-poral context – either in the form of (known) local time or by analysing the images as a sequence. The concept of “patchy auroras” is usually reserved for morning sector auro-ral shapes, and few auroauro-ral physicists would classify evening sector shapes as patchy auroras. However, individual images may resemble patchy auroras, especially in short-lived auro-ral activations. This is apparently also true for Omega-bands and leads to the slow rise in the respective distributions be-tween 17:00 to 24:00 MLT.
Many auroral images share similar numeric features, which may provide conflicting information regarding their actual content category. This behaviour is verified by ob-serving that only 12% of all ASI images (27 000 of 220 000) could be classified into one single category with confidence. We studied images which could not be classified into a sin-gle category, and, indeed, many of them seemed to contain visual features from more than one auroral category or other shapes, such as breakup auroras. An auroral arc may have brighter sections, which naturally results in numerical simi-larity to both arcs and patchy auroras.
Arcness
Brightness
Arcness
Brightness
Improperly constructed training set
Properly constructed training set
Fig. 5. Improperly constructed (left) and properly constructed (right) training set. The white circle denotes the query image while the squares denote the training set images with the black square being an image with an arc and the white square is one without an arc. The query image is connected to the nearest training set image by a dotted line. In the left panel, the query image is incorrectly classified as a non-arc. In the right panel, the training set has enough representative samples of arcs and the query image is correctly classified.
Feature 1 "Brightness"
Low contrast, aurora not much brighter than background
High contrast, bright auroral shapes
Big auroral blobs Small auroral blobs East to west aligned
North to south aligned Circular Feature 4
"Texture"
Even distribution,
no distinctive maxima Clear and distinctive maxima Many maxima - "multiple arcs"
A single maximum- "a single arc" Feature 2
"North-south"
Even distribution,
no distinctive maxima Clear and distinctive maxima Many maxima
A single maximum Feature 3
"East-west"
Fig. 6. Qualitative interpretation of the features. Feature 1 measures the over-all contrast and distinctiveness of au-rora in the image. Features 2 and 3 provide information about the distribu-tion of the aurora – a clear maximum in north-south distribution, combined with an even distribution in east-west direc-tion, usually represents an auroral arc. Similarly, many peaks presumably cor-respond to multiple arcs. Feature 4 is a proxy to “patchyness” or the size and shape of auroral blobs in the image.
for auroral arcs, patchy auroras and Omega-bands vs. magnetic local time. The sharp cut-offs around 16:30 MLT and 07:30 MLT are due to local day-light. Note that the occurrences are in-dividually normalised and do not repre-sent relative occurrence frequency be-tween arcs, patches and Omega-bands.
The accuracy of classification is very good when detecting arcs and patchy auroras. However, even though the classi-fication for Omega-bands does not appear particularly suc-cessful, we noticed that the majority of the images reported as Omega-bands contained a boundary between diffuse au-rora and background sky. If this boundary had looked like the Greek character , the classification would have been correct. One should also note that, while we used features specially designed for arcs and patchy auroras, we did not have an Omega-band feature that would utilise the shape of the boundary of background sky and aurora.
We did not have any training images for north-south aligned aurora in this study and we did not present any statis-tics for those shapes either. Intuitively, north-south structures and auroral arcs are apparently similar if either one is ro-tated 90◦. The features for north-south and east-west aligned auroral distributions apparently provide enough information to recognise arcs, and we believe that adding north-south aligned auroral structures in the training set is definitely worth exploring in the future.
6 Conclusions
We have applied machine vision techniques in analysing the contents of 350 000 auroral images automatically. First, one of the authors (EFD) provided a small training set consist-ing of sample images for different auroral shape categories. The automated process then examined a larger set of unla-belled images by searching for images similar to those in the training set. Content classification was accomplished by ex-amining the category labels of the most similar images.
Studying the classification errors indicates that the auto-mated analysis is consistent and accurate when classifying arcs and patchy auroras. However, there is a larger error in detecting Omega-bands. We believe that there are two major factor affecting the clearly worse classification with Omega-bands: (1) small number of representative samples in the training set and (2) no dedicated feature to detect or verify the existence of Omega-band-like shapes in the aurora. Nev-ertheless, the location of the peak of relative Omega-band occurrence is in agreement with previous manual surveys.
Improving the training set would result in more accurate results by occupying more of the feature space in which im-age comparisons are performed. However, using some unsu-pervised clustering technique might prove to be even more fruitful: instead of relying on a naming tradition based on (subjective) auroral shape classification, automated analysis utilising millions of images could result in a more accurate spectrum of auroral forms.
In a recent study (Syrj¨asuo et al., 2002), we searched for patchy auroras in the same CANOPUS data set using a differ-ent image-to-image distance measure. The search was per-formed in a content-based image retrieval fashion, in which the user provides a query image and the computer retrieves a fixed number of “similar” images (Rui et al., 1999; Smeul-ders et al., 2000). Essentially, the query image is analysed and the distance to all images in the data set is calculated. Then, the closest images are determined and these most sim-ilar images are then shown to the user. The performance of the more advanced classifier presented in this paper indicates that, in the near future, browsing auroral ASI data based on auroral shapes will be a realistic approach.
The required time for the actual classification operation for a single image is small enough to be implemented at the ASI stations in real time. Clearly, more studies are required, but one possible application is to capture images at increased temporal resolution and cull the resulting data on site. This would reduce the amount of data while maintaining superior temporal resolution during “interesting auroras”. Another in-teresting research direction would be to study the time evo-lution of the aurora utilising motion in a well constructed feature space.
Appendix A. Image features and similarity measure
Let I(x, y) be an auroral image. Indices i and j denote the two images being compared. Each image is first rotated so that pixel rows are aligned to the (magnetic) east-west direction (direction of x). Correspondingly, pixels columns are in north-south direction (y). The size of the image is
A1 Brightness
A heuristic intensity feature for auroral brightness is defined as
f1=[µ bmax]T, (A1)
where µ is the average brightness, bmaxthe maximum
bright-ness in the auroral image, and T denotes transpose. The distance S1or similarity between two images is simply the
Euclidean distance of the feature vectors
S1= f (i) 1 −f (j ) 1 2. (A2)
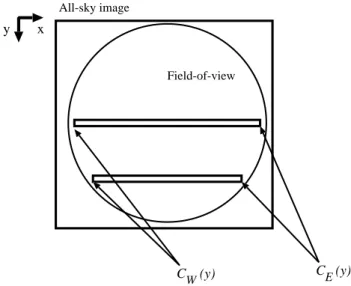
A2 Brightness distribution in (magnetic) N-S and E-W The feature representing the north-south distribution of auro-ral brightness essentially summarises the auroauro-ral brightness as a function of latitude within the FOV of the imager. How-ever, we cannot simply average image rows because the FOV is circular. For each image row y, we determine the eastern-most to the westerneastern-most pixel columns within the FOV, de-noted CE(y)and CW(y), as illustrated in Fig. A1. This is
done to compensate for the circular FOV. Now, the average brightnesses in each row
P (y) = 1 |CE(y) − CW(y)| CW(y) X x=CE(y) I (x, y) (A3)
are collected into a feature vector
f2= [P (0)P (1) . . . P (ymax)]T. (A4)
In practise, the distribution is binned to 16 bins and nor-malised between 0 . . . 1. The distance is defined as
S2=min k f (i) 2 −rot (f (j ) 2 , k) , (A5)
where f2 denotes the 16-element feature vector and
rot (f , k) denotes a circular shift of vector elements by k
positions. The circular shift provides invariance in the north-south direction: a bright arc in the north has a short distance to a bright arc in the south. The idea is illustrated in Fig. A2. The distribution in east-west direction is defined similarly, as well as the corresponding distance measure S3.
A3 Texture
The category of patchy aurora contains images in which the auroral classification should be based on the overall appear-ance instead of on a single identified auroral shape. Visually, patchy auroras resemble patterns of differently sized auro-ral “blobs”. Depending on the size and orientation of these blobs, the patterns – called textures – vary. For identify-ing different textures, we used a multi-resolution Gabor-filter technique. Essentially, the elements of the texture feature vector f4 can be associated with the response of 36 band-width filters that are tuned into different “auroral blob” scales and orientations. This is analogous to having “blob spec-trum” and comparing the spectra of images. The distance S5
x y
C (y)W C (y)E
All-sky image
Field-of-view
Fig. A1. Extracting brightness distribution: since the field-of-view produces a circular image, only a section of each row (east-west) contributes to the north-south aligned brightness profile. The east-ernmost and westeast-ernmost pixels for each row y are CE(y)and
CW(y). 2 4 6 8 10 12 14 16 0 0.2 0.4 0.6 0.8 1 1.2 Bin number Normalised brightness Distribution 1 Distribution 2 Distribution 2 after shift SHIFT
Fig. A2. The distance between two brightness distribution is the minimum distance obtained by circularly shifting one of the pro-files. Distribution 1 in the plot is a result of having an arc south of zenith and Distribution 2 is another arc but north of zenith. By shifting Distribution 2, we obtain a better match – smaller distance – with Distribution 1, which is desirable because both brightness distributions represent a single arc. Each distribution is binned into 16 bins before distance calculation.
is small if the spectra – average blob size and orientation – are similar. For details and the definition of the distance S5,
see Manjunath and Ma (1996) and references therein. A4 Feature weighting
We used the iterative technique described in Rui et al. (1998) to determine the value of the weight vector W used in
adjustment is easily programmed. We simulated five re-trievals with weight updating and averaged the weight vec-tors obtained by using each image in the labelled set as a query image.
Acknowledgements. CANOPUS is operated by the Canadian Space
Agency and its Principal Investigator is L. L. Cogger. This work was financially supported by the Alberta Ingenuity Fund (Canada) and the Natural Sciences and Engineering Research Coun-cil (Canada).
Topical Editor M. Lester thanks K. Kaila and another referee for their help in evaluating this paper.
References
Akasofu, S.-I.: The auroral oval, the auroral substorm, and their relations with the internal structure of the magnetosphere, Planet. Space Sci., 14, 587–595, 1966.
Akasofu, S.-I. and Kimball, D.: The dynamics of the aurora 1. Insta-bilities of the aurora, J. Atmos. Terr. Phys., 26, 205–211, 1964. Akasofu, S.-I., Kimball, D., Buchau, J., and Gowell, R.: Alignment
of auroral arcs, J. Geophys. Res., 77, 4233–4236, 1972. Devroye, L., Gy¨orfi, L., and Lugosi, G.: A probabilistic theory of
pattern recognition, Springer, 1996.
Donovan, E. F., Trondsen, T. S., Cogger, L. L., and Jackel, B. J.: Auroral imaging in Canadian CANOPUS and NORSTAR pro-grams, Proc. of the 30th Atmos. Studies by Optical Methods, in press, 2003.
Ejiri, M.: Trajectory traces of charged particles in the magneto-sphere, J. Geophys. Res., 83, 4798, 1978.
Feldstein, Y.: Some problems concerning the morphology of auro-ras and magnetic disturbances at high latitudes, Geomag. Aeron., 3, 227, 1963.
Feldstein, Y. and Elphinstone, R.: Aurorae and the large-scale struc-ture of the magnetosphere, J. Geomag. Geoelectr., 44, 1159– 1174, 1992.
Gustafsson, G.: On the orientation of auroral arcs, Planet. Space Sci., 15, 277–294, 1967.
Henderson, M., Reeves, G., and Murphree, J.: Are north-south structures an ionopsheric manifestation of burstybulk flows?, Geophys. Res. Lett., 25, 3737–3740, 1998.
Kauristie, K., Syrj¨asuo, M., Amm, O., Viljanen, A., Pulkkinen, T., and Opgenoorth, H.: Statistical study of evening sector arcs and electrojets, Advances in Space Research, 28, 1611–1616, 2001. Knudsen, D., Donovan, E., Cogger, L., Jackel, B., and Shaw, W.:
Width and structure of mesoscale optical auroral arcs, Geophys. Res. Lett., 28, 705–708, 2001.
Lyons, L., Fennell, J., and Vampola, A.: A general association be-tween discrete auroras and ion precipitation from the tail, J. Geo-phys. Res., 93, 12 932–12 940, 1988.
Manjunath, B. and Ma, W.: Texture features for browsing and re-trieval of image data, IEEE Trans. Pattern Analysis and Machine Intelligence, 18, 837–842, 1996.
Opgenoorth, H., Persson, M., Pulkkinen, T., and Pellinen, R.: Re-covery phase of magnetospheric substorms and its association with morning sector aurora, J. Geophys. Res., 99, 4115–4129, 1994.
Rostoker, G., Samson, J. C., Creutzberg, F., Hughes, T. J., Mc-Diarmid, D. R., McNamara, A. G. Vallance-Jones, A., Wallis, D. D., and Cogger, L. L.: CANOPUS – A ground-based instru-ment array for remote sensing of the high-latitude ionosphere during the ISTP/GGS Program, Space Sci. Rev., 71, 743–760, 1995.
Rui, Y., Huang, T., Ortega, M., and Mehrotra, S.: Relevance feed-back: a power tool for interactive content-based image retrieval, IEEE Transactions on Circuits and Systems for Video Technol-ogy, 8, 644–655, 1998.
Rui, Y., Huang, T., and Chang, S.-F.: Image retrieval: current tech-niques, promising directions and open issues, J. of Visual Comm. and Image Representation, 39–62, 1999.
Samson, J., Lyons, L., Newell, P., Creutzberg, F., and Xu, B.: Pro-ton aurora and substorm intensifications, Geophys. Res. Lett., 19, 2167–2170, 1992.
Sergeev, V. A., Sazhina, E. M., Tsyganenko, N. A., Lundblad, J. ˚A., and Søraas, F.: Pitch-angle scattering of energetic pro-tons in the magnetotail current sheet as the dominant source of their isotropic precipitation into the nightside ionosphere, Planet. Space Sci., 31, 10, 1147–1155, 1983.
Smeulders, A., Worring, M., Santini, S., Gupta, A., and Jain, R.: Content-based image retrieval at the end of the early years, IEEE Trans. Pattern Analysis and Machine Intelligence, 22, 1349– 1380, 2000.
Stringer, W. and Belon, A.: The morphology of the ISQY Auro-ral Oval 2. AuroAuro-ral alignments in and near the auroAuro-ral oval, J. Geophys. Res., 72, 4423–4429, 1967.
Syrj¨asuo, M. and Donovan, E.: Analysis of auroral images: detec-tion and tracking, Geophysica, 38, 3–14, 2002.
Syrj¨asuo, M., Kauristie, K., and Pulkkinen, T.: Search engine for auroral forms, Adv. Space Res., 28, 1605–1610, 2001.
Syrj¨asuo, M., Donovan, E., and Peura, M.: Using attribute trees to analyse auroral appearance over Canada, in IEEE Workshop on Applications of Machine Vision, 289–295, 2002.
Syrj¨asuo, M. T., Pulkkinen, T. I., Janhunen, P., Viljanen, A., Pelli-nen, R. J., Kauristie, K., Opgenoorth, H. J., Wallman, S., Eglitis, P., Karlsson, P., Amm, O., Nielsen, E., and Thomas, C.: Obser-vations of Substorm Electrodynamics by Using the MIRACLE Network, in: Proceedings of the Fourth International Conference on Substorms, edited by Kokobun, S. and Kamide, Y., 111–114, 1998.
Therrien, C. W.: Decision, estimation and classification, John Wiley & Sons, 1989.
Yahnin, A., Sergeev, V., Gvozdevsky, B., and Vennerstrøm, S.: Magnetospheric source region of discrete auroras inferred from their relationship with isotropy boundaries of energetic particles, Ann. Geophys., 15, 943–958, 1997.
Zesta, E., Lyons, L., and Donovan, E.: The auroral signature of Earthward flow bursts observed in the magnetotail, Geophys. Res. Lett., 27, 3241–3244, 2000.