OCT
1
DIFFERENTIAL EDUCATIONAL OPPORTUNITIES AND RESIDENTIAL CHOICES:
A CASE STUDY OF MIGRATION IN THE BOSTON METROPOLITAN AREA
by
LEONARD M. HENNY
SUBMITTED IN PARTIAL FULFILIMENT
OF THE REQUIREMNTS FOR THE
DEGREE OF MASTER OF
CITY PLANNING
at the
MASSACHtBETTS INSTITUTE OF
TECHNOLOGY
August, 1966
Signature of Author
Signature of Thesis Advisor ...-...
.oJames M. Beshers, Associate Professor
Accepted by
TABLE
Q1.
CONTENTS
Page
INTRODUCTION . . . . . . . . . . . . . . . . . . 1
Socio-Economic Migration Patterns Between Boston, its Suburbs and the Rest of the United States ...
3
Differential Educational Opportunities and Residential Choices . . . . . . . . . . . . . . . . . . 16
THEORETICAL FRAM0VORK . . . . . . . . . . . . . . . 20
Migration and Education ... . . . .. 20
Formulation of Hypotheses . . . . . . . . . . . . 23
VERIFICATION OF HYPOTHESES . . . . . . . . . . . . . I-1
PART I: DIFFERENCES BETWEEN CENTRAL CITIES AND SUBURBS . . . I-1
Testing for Spuriousness . . . . . . . . . . . . 1-3
Methodology ... . . .. .... .. .1-4
PART II: DIFFERENCES BETWEEN C0MUNITIES ... . . ... . II-1 Description of Magnet Factors . .. .. .. .. 11-5
1) Educational Opportunities . . ... 11-5
2) Tax Base . . . .... .. . .. ...
11-7
3) Accessibility . . . . . . . . . . . . . 11-9
4) Juvenile Delinquency . . . . . . . . . . II-10
5) Discrepancy Between Social Services and
Social Needs . . . . . * . .. .... 11-11
6) Employment and Prepondernace of the Single
Dwelling Unit . . . . . . . . . .... 11-12
EDUCATIONAL OPPORTUNITIES AS A MAGNET FACTOR .
Relations Between Input Factors and Output Factbrs Relations Between Other Input and Output Factors
. . .
11-18
11-22
. . .
11-25
School Inputs Related to the Tax Efforts of Communities
QUALITY OF SCHOOL SYSTEMS AND SOCIOECONOMIC COMPOSITION OF
CO1MUNITIES . . . .
Selective Inmigration and Differential Educational
Opportunities. . . . . . . . . . . . . . . .
Disparative in Selective Migration . . . .
.
11-28
.
11-29
11-35
11-37
TABLE OF CONTENTS (continued)
Page
Testing for Spuriousness . . . . . . . . . . . . 11-40
Methodological Problems . . . . . . . . . . . . II-42
Verification . ... .. ...
.
...11-43
The Impact of Other Magnet Factors . .. .. ... 11-45
SIMSARY . . . . . . . . . . . . . . . . . . . III-1
is affecting the pattern of mobility of families in the metropolitan area. Part I studied the relation between the rates of education-specific inmigration into the central city and into the suburbs of Metropolitan Areas of the North East Region in the United States. It was found on the basis of
Census data in print, that suburbs experience a higher rate of inmigration of highly educated families than central cities. To test to what extent these families moved to the suburbs in response to shifts in white collar employment, or to enjoy the status derived from owning a single home, a particular
sub-group of movers was studied: those who moved to the suburbs with a job in
the central city and choosing to live in an attached dwelling unit or
apart-ment. In this analysis I used U.S. Census data available on computer tape,
based on a sample of 1/1000 inhabitants. It was found that highly educated, higher income families with a job in the central city tend to move at a
greater than average frequency to the suburbs and tend to choose at a greater than average frequency to live in an attached dwelling unit. This led to the conclusion that, since these families are of relatively high education and in the age of having school children, there is evidence that part of this "flight to the suburbs" was "educational flight": to take advantage of the generally better quality of educational opportunities in the suburbs compared to the education available in the central city.
In Part II the emphasis was shifted from the central city-suburbs dichotomy to an analysis of the distribution of families of specific socio-economic characteristics with children in the school going age over the seventy-six communities of one metropolitan area. The information for this analysis was retrieved from the BRPP data bank, combined with statistical data provided by the Massachusetts Department of Education. It was found
that there are wide differences in educational opportunities among the seventy-six communities, and that most of the communities with high ranking educational facilities tend to attract high proportions of high status families as new residents, while communities ranking low on the quality of their school systems, tend to attract disproportionately many families of low socio-economic status, and few or none of high socio-economic status. I identified seven communities which ranked high on the quality of educational facilities as well as on the rate at which they attract high incame families with school going children. These cammunities did not consistently rank high
on "magnet factors" other than educational facilities such as level of tax base, accessibility to the central city, incidence of juvenile delinquency,
the extent of discrepancy between social services and social needs in the community, preponderance of the single dwelling unit, and employment. This led to the conclusion that the choice of community of residence by this category of movers was most probably primarily determined by the favorable educational opportunities provided by these particular communities.
INTRODUCTION
A problem common to many central cities in the United States is that they are losing an important segment of their popula-tion to surrounding suburbs. Often this loss is painted as being to the disadvantage of the central city, because it allegedly de-prives the city population of local leadership, tax paying ability and socio-economic heterogeneity which is one of the prime character-istics of the city as a social institution.
It is often assumed that the population which is moving out
tends to be on the average of higher socio-economic status than the population which remains or moves into the city. If this process is in fact occurring and were to continue it is feared that the obvious result will be a disparative growth in socio-economic terms between
the central city and its environing suburbs in a metropolitan area. A symptomatic statement is offered in a lead article in the Wall Street Journal:
'Pessimists point to the persistent flight
of better heeled tax payers from central to suburban cities and the continuing in-flux of needy poor, often minority groups with larger broods, to take their place. They note, too, that the central city is
saddled with the greatest deterioration
and congestion. And they are pessimistic over the ability of cities to substantially
diver-sify their income sources beyond the property
tax or to command sufficient helpings, at State or Federal aid to meet their growing
needs.n,2
1. Louis W7irth: "Urbanism as a Way of Life", American Journal of Sociology, Vol. 44, July, 1938, pp.1-24.
2. Mitchell Gordon, "Doomed Cities?" The Vall Street Journal, October 16, 1962.
I suggest that the doomsday interpretation of the trends discerned in the recent past requires important revision.
I come to this conclusion on the basis of the following analysis of migration flows between the city of Boston, its envir-oning ring of suburbs and the area outside the boundaries of the
3
-Socio-Economic Migration Patterns Between Boston, Its Suburbs and the Rest of the United States
In this thesis, socio-economic status will be symbolized in terms of educational attainment, income level and occupation.
In this introductory study I will focus upon educational attainment as indicative for socio-economic status. The use of other personal characteristics, such as incame level or occupation would unlikely alter the conclusions in a decisive way.
On first glance there is ample evidence that the central city is in deed losing its segment of well educated people.
For the purpose of analysis the population of twenty-five years and over is divided into three segments: those of four or more years of college education, those who have had no more than
eight years of education and the remaining segment in between; those with more than eight years elementary education but less than four years of college.
An examination of the Census reveals that during the
period 1955-1960, 8,000 highly educated persons moved out of Boston to the ring of suburbs in the metropolitan area. During the same period 2,400 moved from the ring to the city. This means a net loss from the central city to the suburbs of 5,600 persons of high educa-tion.
However, 5,200 persons of high education moved into Boston from outside the metropolitan area.
A crucial element in this migration process is how many
persons with high education moved from Boston to outside the metro-politan area.
If the net loss to suburbia was 5,600 and the gain from
outside the Metropolitan Area was 5,200 and there were no out
migra-tion to outside the metropolitan area, the highly educated populamigra-tion
would remain approximately stable.
In other words, the net loss in educated people from the
central city of Boston equals approximately the net loss of the city
of Boston to the rest of the United States, outside the metropolitan
area.
The following calculation was undertaken to estimate this
out migration: the education-specific outmigration can be statistically
approximated by ccamparing the differences between the education-specific
categories in the 1950 and 1960 Census. Allowances should be made for
(a) the intra-metropolitan migration, (b) the inmigration from outside
the metropolitan area, (c) education specific mortality, (d) changes
in the educational attainment of the indigenous population.
Values computed to ascertain the gross outmigration of
popula-tion with high educapopula-tion from Boston to the rest of the United States
outside the SMSA, during the period 1955-1960, follows on the next page.
5
-(1) Population of high education'
1955
(2) Gain from suburbs
(3) Loss to suburbs
(4)
(5) (1) plus or minus (4)
(6) gain from aging
(7) loss due to death
(8)
(9) (5) plus or minus (8)
(16) gain from outside the SNSA
(11) loss to outside the
SMSA
(12)
(9)
plus (10)
(13)
RESIDUAL(14)
population of high
education 1960
See page 6
See page 7
See page 9
32,315
2,400
8,000
- 5,6005,600
26,715
5,300
2,300
+ 3,0003,000
29,715
5,200
RESIDUAL
5,200(+R)
5,200
34,915
34,915
2,915
32,000
1.
2.3.
RE: (1)
The population of high education in 1955 is not available
in the U.S. decennial Census of Population. However an estimate can be made by interpolation:
Population with educational attainment
of four years college or more 1950 ... 32,635
Population with educational attainment
of four years college or more 1960 ... 32,000
Net decrease in population with educa-tional attainment of four years college
or more, period 1950-1960 ...
635
Estimated annual decrease: 64
Decrease over five year period: 320 Estimated population with educational
attainment of four years college or more
7
-RE:
(6)
Each year the population gains in highly educated people
when a new cohort of youngsters graduate after four years of college
attendance.
How many Boston youngsters graduated in the period
1955-1960 and remained in Boston, or had already graduated after four
years of college before 1955, but attained age twenty-five during
this period is unrecorded. However the number can be approximated
by comparing the age cohort of youngsters with education of four
years of college or more of age twenty-five to twenty-nine in 1950
with the age cohort of highly educated youngsters of age twenty-five
to
twanty-nine in 1960.
None of those aged
twenty-five to twenty-nine were,in 1960,
twenty-five in 1955. Some of those aged twenty-five
-
twenty-nine
in 1960 had come from outside Boston.
The total population with high education in 1960 was 32,000.
7,600 of those had come to Boston from outside of Boston in the period
1955 to 1960.
This is 24%.
Of the total population of ages twenty-five
-
twenty-nine
in 1960, which was 21,400, 5,200 did not live in Boston in 1955.
This is also 24%.
Consequently, it is safe to assume that
76%
of the highly
educated Bostonians of ages twenty-five
-
twenty-nine in 1960 was
gained by Boston resulting from aging and/or graduation in Boston
itself.
Quite surprisingly the number of highly educated young-sters of ages twenty-five - twenty-nine in Boston is available in the Census for 1950, but not for 1960. In this computation it
was assumed that, since the total population with educational
attainment of four years college or more had hardly changed between 1950-1960 (being 32,635 in 1950 and 32,000 in 1960), the twenty-five through twenty-nine age group with high educational attainment had most likely also remained stable or gained somewhat in proportion to the total age group. The age group of twenty-five - twenty-nine year
olds with high educational attainment was 6,860 persons in 1950, and
was assumed to be 7,000 in 1960.
Applying the 76% ratio to this subpopulation, it appears that Boston has gained during the period 1955-1960 some 5,300 persons with high educational attainment, due to aging and conversion of lower
-
9
-RE:
7
Loss due to natural attrition was estimated by a straight
application of rounded age-specific death rates to the population of
high education of 1950.
Age Group Death Population Number of Deaths Survivors Age
1950
Rate
1950
1950-1960
1960
19
25-29
2.0
6,860
140
6,720
35-:
30-34
3.5
4,700
170
4,620
40-35-44
5.0
8,518
430
8,085
45-45-54
12.5
6,015
750
5,265
55-55-64
27.5
3,
530
1000
2,530
65-65
+
71.0
2,925
2100
823
75
4590
The loss due to deaths over the ten year period was 4,590.
It was estimated that over the five year period (1955-1960) the City
lost 2,300 persons with high educational attainment as a result of
natural attrition.
The loss of highly educated people to outside Boston can
now be deducted as being the residual. Hence, the total loss to
outside the metropolitan area is estimated to have been 2,915, or
nearly 3,000.
Group
6039
44
54
64
74
+The important point in the "doomsday interpretation" of metropolitan migration patterns during the late 1950's is that low
status population is replacing high status population in the central city, and this indeed holds true for Boston during the period 1955-1960.
If the outmigration had not taken place between 1955 and
1960 the proportion of highly educated persons in the population
twenty-five years and over would have been
6.6%,
where in fact the
proportion had became in 1960
5.2%.
For lowly educated persons the
percentage would have been 15.6%, where in fact it had beccme in
1960 16.4%.
Thus the ratio indicating the resulting disparity
between highly and lowly educated people changed from 1 : 2.49 to
1 :
3.01.
Obviously, if this trend is to continue into the future
the central city is indeed doomed to lose more and more highly
educated people and is to gain proportionately in persons with low
levels of education.
Two very important aspects are however neglected in this
somber presentation of the dilemma for the central city.
First the rate of inmigration of highly educated people
is substantially higher for highly educated people than for people
with low levels of education.
Second, people with low levels of education can be assisted
in achieving higher levels of education, at least for the next
genera-tion.
Concerning the first point:
if the exodus of highly edr ated
people to the suburbs can be stemmed the unfavorable trend in the ratio
between highly educated segments and segments with low education in
the central city population is apt to reverse.
To quantify this
ob-servation
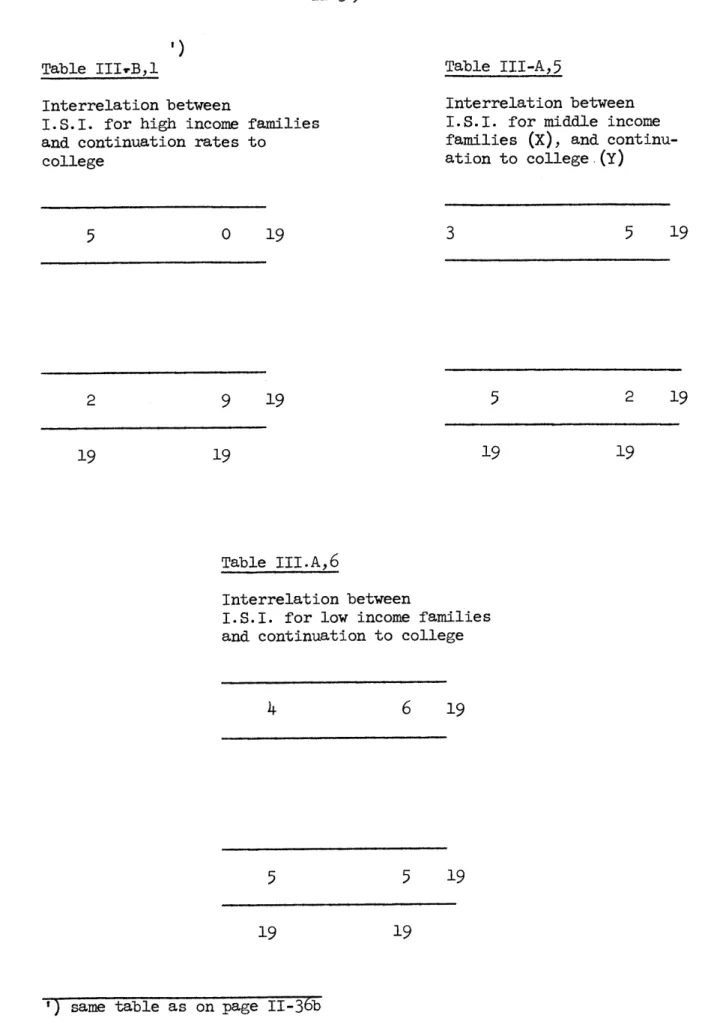
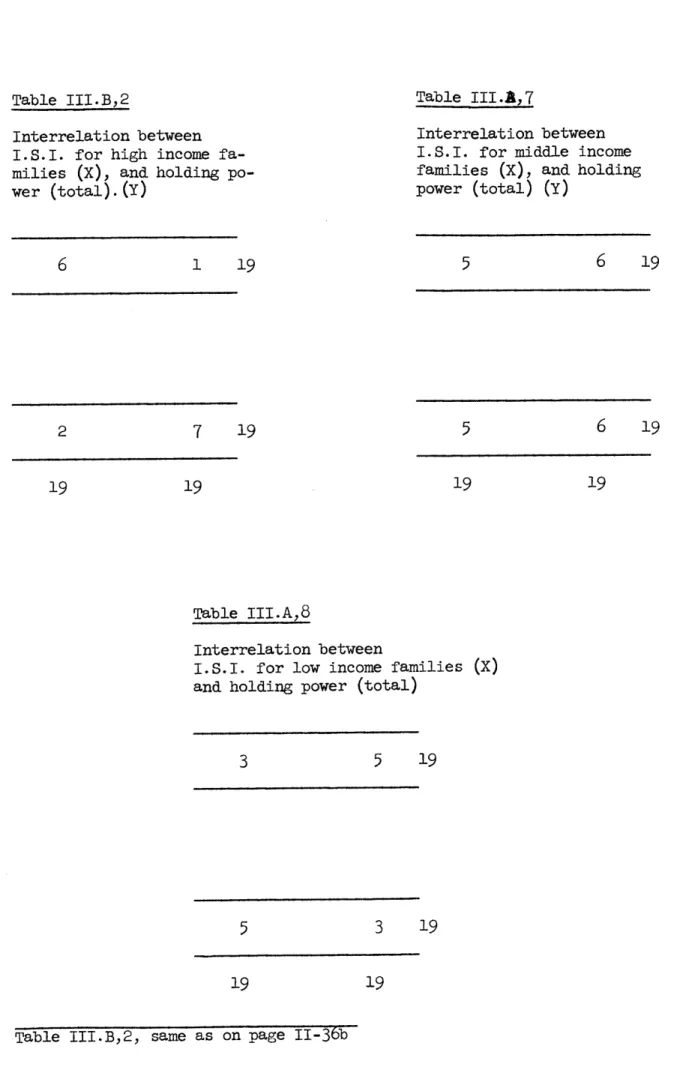
I have developed an Index of Disparitive Inmigration.
- 11
-The purpose of this index, which is described and qualified
in more detail in the Appendix, is to measure to what extent the migration flow between two or more geographical areas results in terms of inmigration in an a-proportional concentration of people of specific socio-economic characteristics in one sub-area as compared
to all other distinguished sub-areas forming together the total study area, which is studied as a closed system.
Table ooo shows the score of Boston on the Index of Dis-parative Inmigration as compared with the score of the combined suburbs on the index.
According to Table 000 there is presently no disparative
inmigration between the central city of Boston and its surrounding suburbs in educational terms. In fact the score of the city of Boston on the Index of Disparative Inmigration exceeds the score of the combined
suburbs surrounding the city by a factor of 2-1/2.
What these calculations indicate is that there is no lack of interest among the highly educated segment of the population to take
residence in the city. This interest comes to expression in the fact that actual residential choices by highly educated people in the central
city outweigh residential choices of this category in the suburban ring, if compared in relative terms with the actual residential choices
of less educated segments in the population.
Thus it is safe to state that, although high educated people generally moved out of the city, at the same time many moved in too.
INIEX OF DISPARITIVE IN MIGRATION, SCORE FOR BOSTON AND FOR SUBURBS BOSTON High education (college or more) Low education (less than highschool)
(1)
non-movers a in 00043.4
287.5
b 13.087.0
(2)movers from out-side the SMSA
a in 000 12.1
21.5
b5
36.0
64.0
(3)
ratio of(2)
On
(2)2.75
0.74
330.9
100.0
33.6
100.0
SUBURBS High education (college or 153.1 22.0 101.4 28.1 1.27 more)1.36
Low education (less than 548.0 78.0 257.1 72.0 0.93 highscholl)7M.1
100.0358.5
100.0I.D.I. for Boston RATIO of I.D.I. for Suburbs
(4)
I.D.I. ratio of high on low3.71
3.71
1.36
-
2.75
-
13
-This situation provides an important opportunity for future policies. For if it is held desirable to retain a balance in the proportional distribution of status levels in the central city population there truly is sufficient influx of persons of
high status; and the major emphasis should be to retain the
in-flux once it settled in the city.
Concerning the second point: in 1962 Boston high schools
ranked 52nd among seventy-six metropolitan communities in college entrance. 23% of Boston's high school graduates continued their education to a four year college in 1962. This is less than half
the rate of the communities which send the largest proportion of high school graduates to a four year college.
As is evident from Dr. Conant's "slums and Suburbs", two types of secondary education have actually developed in the northern cities. Education in the central city has become strongly oriented
towards vocational preparation, while education provided by some suburban school systems has nearly completely specialized on college entrance preparation.
Although academic courses are provided by high schools in
the central city; the school systems of some suburban communities pro-vide disproportionately more, and it is not surprising that parents who want their children to continue into college, move away from the
central city to increase the educational opportunities of their children. As for Dr. Conant, he writes: "Many of these well-to-do families who have same years ago sent their children to private schools, now find the costs prohibitive and admission difficult because of
increasing selectivity at the better known private schools."1
This situation provides an important challenge to central
city school systems: in the first place to provide an abundance of academic stimulus to children of less affluent families, and also to induce affluent families to remain in the city.
Thus, an increase in the segment of educated citizens in the population can came primarily from two sources: by the conver-sion of children of families with little parental education into youngsters with higher levels of education, and by the attraction and retention of new families with high parental education, all through the cycle of family formation.
As will be shown in Part I of this thesis a strong segment of the influx of highly educated people cames into the central city
as single individuals or as young couples and moves out again as a starting family. To know what makes these families move out is one of the prerequisites for formulating a policy. Generally, core cities have responded by embarking on massive physical renewal programs to make the city more attractive to those who are inclined, and feel free, to avoid the city as a place bf residence if general amenities are more appealing elsewhere.
In this thesis I will search for evidence that educational opportunities in public education outside the central city, though not THE single factor, have been at least a very important considera-tion in the decision of a substantial segment of the populaconsidera-tion which moved from central cities to suburbs in the late 1950's.
-15-If this evidence can be presented the implication is clear. If, among the central city's planning objectives there is the target to attract and retain high status families, physical renewal will have to be accompanied and associated with renewal
of educational institutions. Current planning practices are still very remote fram inter-marriage between physical and educational plans as would be required to achieve such targets.
Differential Educational Opportunities and Residential Choices The purpose of this thesis is to establish what link, if
any, exists between the quality of educational facilities of a com-munity and the rate at which a comcom-munity attracts new residents of
specific socio-economic characteristics.
The picture which arises from a study of the current literature is somewhat contradictory. On the one hand there is evidence that families in their residential choice do take the
availability, or nearness, of quality educational facilities into
account. On the other hand it is clear that educational opportunities are only one factor among many others which induce a family to move, or which affect a family to choose residence in one location rather than in another location within a metropolitan area.
This study will focus upon the Boston Metropolitan Area, consisting of seventy-six communities as defined by the U.S. Census of 1960. Some of the evidence however will be derived from a wider geographical area, particularly the North East Region.
In the first part of the thesis I will analyse the socio-economic characteristics of migration flows between the central city and the surrounding suburbs.
In this part the major source of information is the U.S. Census of Population 1960, special subject report on migration, and
-17
-In the second part I will analyse the community-specific distribution of movers, and compare the socio-economic characteristics of movers versus non-movers, and the comparative weight of community characteristics or "magnet factors" with which the extent of inmigra-tion can be associated.
In this part the major source of information will be a survey conducted by the Boston Regional Planning Project in 1963/1964.
Migra-tion flows into seventy-six communities of the Boston Metropolitan Area will be analysed in terms of level of income and occupation of movers
and non-movers, where the level of income and occupation is chosen in
such a way as to overlap with probable educational attainment. Socio-economic characteristics were analysed in terms of
educational attainment, income level and occupational status of head of household. Due to constraints resulting from the use of various mutually independent data source, it was impossible to analyse
socio-economic migration flows according to the three criteria of educational attainment, income level and occupational status in combination. Thus, in Part I migration flows are analysed in terms of educational attainment whereas in Part II the analysis takes into account income and occupation.
As is well known there is an intimate relation between the three criteria of socio-econamic status which is (analysed in a large body of sociological literature) maybe more clearly evident from the consistency among the elements of the socio-economic status score, in use by the U.S. Bureau of the Census which is summarized in the following table:
1
Socio-Economic Status Consistency All three components consistent
Occupation and education consistent, incme high Occupation and education consistent, income low Occupation and income consistent, education high
Occupation and income consistent, education low Education and income consistent, occupation high
Education and income consistent, occupation low
All inconsistent, education highest, occupation lowest All inconsistent, occupation highest, income lowest All inconsistent, occupation highest, education lowest All inconsistent, education highest, income lowest All inconsistent, income highest
Heads of Families
13,215
4,912
6,107
2,558
6,751
4,950
2,287
188
640
622601
2,173
45,004
Percentaige28.8
61.8
9.4
100.00
In this study the components of socio-economic characteristics were given this following definition:
Status High Status Education 4 years college or more
Income
More than
$10,000
Occuoation
Professional
Middle Status More than $5,000- Not taken into
high school $10,000 account
Less than college
Low Status high school less than Not taken into
only $5,000 account
-
19
-The categorization is based upon the major criterium
that average income for profeshionals with educational attain-ment of four years of college or more is $10,000. For other
occupations (except for managerial where average income is $13,400), it is less than $10,000; e.g. for clerical and sales with four years of college, average income is $6,000). Average income of
high school graduates, regardless of occupational status is $4,970
or rounded is $5,000.1
1. U.S. Census of Population, 1960. Subject Report Occupation by Earnings and Education, Table 2.
TIEREICAL
FAIM
Migration and EducationOn a national basis, modern migration can be interpreted as fulfilling a function of balancing out geographical income
in-equalities. Since the beginning of the industrial revolution the main streams of migration have been from low income areas to high income areas: between countries as well as within countries, from
the rural to the urban areas, from small towns to large cities, and recently from central cities to suburbs. The flow of migrants has
thus been considered as a flow towards economic opportunities. This consideration finds its reflection in the importance which economists and city planners give to the economic base
con-cept. This concept entails that the future size and socio-economic composition of the population of a community is (approximately) determined by the future size and composition of new employment
opportunities in that community.
The validity of this interpretation has been amply demonstrated for large urban areas, as for example by Charles Leven in his case
study of the Elgin Dundee Area "Theory and Method of Income and
Product Accounts for Metropolitan Areas", and by the work of Charles
Thiebout and Walter Is-ard.
However, an important aspect in this interpretation of the process of migration has so far been largely overlooked. This is, that to improve its economic opportunity a family is apt to search for the best educational opportunity for the children to achieve better
- 21
-economic opportunities for the next generation. Only recently there
are trends in the literature which point to the aspects of differential educational opportunities in geographical terms, and the importance of
educational opportunities in family migration and inter-generational
social mobility.
Evidence is becoming available that in inter-continental migra-tion other factors, particularly educamigra-tional opportunities do affect the
direction of major migration flows.
"3tudies have shown that areas that are losing population particularly their young people, spend less per student on education
than those which are growing."1
Educational opportunities seem to become of even larger importance
when considering migration flows within metropolitan areas. Whereas economic opportunities are still a considerable determinant affecting migration flows between central cities and suburbs, this factor loses importance in affecting migration flows between the various suburban communities ringing the central city of a metropolitan area. It is here that educational opportunities seem to gain in importance as a magnet factor.
The higher mobility of higher educated people comes from two major sources. On the intra-metropolitan level: highly educated people are likely to respond more readily to differential employment opportunities, because high salary differences in absolute terms
between geographical regions makes it worthwhile for them to move
larger distances.
On the inter-metropolitan level, highly educated people tend to be more free of locational constraints because their salaries give them choice over the full range of the housing supply in
combina-tion with alternative means of transportacombina-tion. They are therefore less tied down to the location of their job, or to the availability of affordable housing, and as a result are more likely to respond
readily to the differential quality of community services, particularly educational facilities, available for the education of their children.1
It is the major hypothesis underlying this thesis, that besides other factors, educational opportunities provided by a com-munity form an important "magnet factor" in attracting new families or bringing about a shift in the socio-economic composition of the population of a community.
1. James M. Beshers and Eleanor N. Nishuira: "A Theory of Internal Migration Differentials" Social Forces, Vol. 39, 1960-1961.
-
23
-My main hypothesis, derived from the foregoing discussion
is that at least for a segment of the population a residential move
partly fulfills the function of improving the economic opportunity
of the head of the household, and partly fulfills the function of
improving the educational opportunity
for the children in the family.
How to describe the segment of the population for which
the hypothesis is
most valid?
My first subhypothesis is that the effect of education as
an income generating factor is best recognized by those who have
themselves gone through the experience of obtaining quality education
and obtaining high earning power. Highly educated, high income
earning parents are more likely to attach great value to the
educa-tion of their children than parents with relatively low educaeduca-tion
or parents with high education but low
earnings.
It should be remembered at the
same time that at a national
level persons with high educational attainment tend to migrate at a
higher rate and tend
to move over longer distances than persons with
1
low educational attainment.
In part I of the thesis I will verify to what extent the
two hypotheses hold true for migration flows between central cities
and suburbs. In part II I will verify to what extent the hypothesized
relation holds true for inmigration flows within the seventy-six
com-munities of the Boston Metropolitan Area.
1. James M. Beshers and Eleanor N. Nishiura: "A Theory of Internal
Migration Differentials", Social Forces, Vol. 39, 1960-1961.
- 24
-TABLE 01
SELECTIVE OUTMIGRATION
(N BOSTON TO SUBURBS
Non-Movers
in Boston
8.8
9.7
8.6
5.6
4.0
5.0
12.714.4
15.016.4
100.0
Movers From Central City to Suburbs
13.0
9.2
5.0
6.0
11.0
13.0
18.0
11.0
7.0
6.0
99.2
0-5
5-9
10-14
14-19
20-24
25-29
30-34
35-44
45-54
55-64
65+
7
- 25
-TABLE 02
PARENTAL EDUCATION
Less than eight years Eight years
One to Three years high school Four years high school
One to three years college Four years or more college
Non-Movers in Boston
18.0
18.0
20.030.0
7.0
6.0
99.0
Movers to
Suburbs9.0
9.0
19.0
55.0
35.0
12.091,
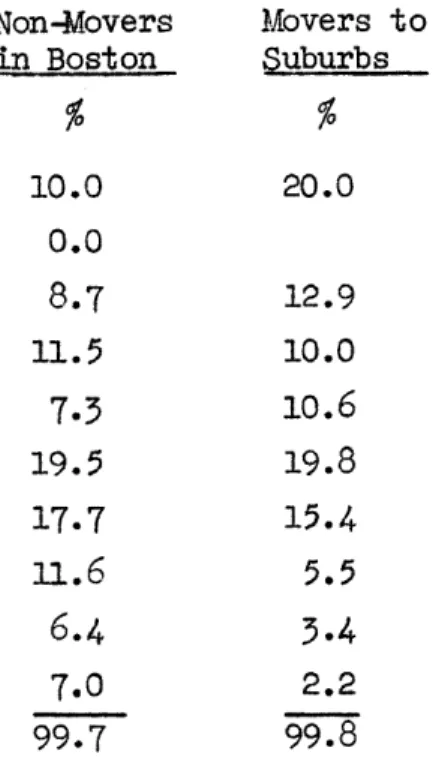
TABLE 03
OCCUPATION
Non-Movers
Movers to
in Boston
Suburbs
Professional
10.0
20.0
Farmers and Farm Managers
0.0
Managers and Proprietors
8.7
12.9
Clerical and Kindred
11.5
10.0
Sales Workers
7.3
1o.6
Craftsmen Foremen
19.5
19.8
Operatives
17.7
15.4
Service Workers
11.6
5.5
Laborers
6.4
3.4
Occupation not reported
7.0
2.2
-
27.-TAABL
04
Non-Movers
in Boston
som-paMovers to
Suburbs
Under
$
2000,--S
2000,-
to
$
29,-*
3.000O-
to
t
3.999,-$
4.000,- to
S
4.999,-$
5.000,- to
$
5.999,-$
6.ooo,- to $
6.999,-47000,-
to
$
9.999,-$
1
0.
0 0 0,-
to
$
14.000,-$
15.000,- and over
6.1
5.2
7.4
10.6
14.0
11.6
24.8
14.8
4.8
100.0
2.5
2.2
4.8
7.6
14*2
13.8
30.0
17.0
7.5
100.0
VERIFICATION OF HYPOTHESES Differences Between Central Cities and Suburbs
Under the corresponding nul hypothesis there would be no statistical association between the level of parental education and the proportion of family moves to areas of relatively high educational opportunities.
Is there statistical evidence to reject the nul hypothesis as far as migration between central cities and suburbs is concerned?
Assuming as a working hypothesis later to be corrected1 that on an aggregate basis the quality of public education available
in the suburbs is generally better than in the central city, there is statistical evidence that in the Boston Metropolitan Area higher educated households move from the central city to the suburbs at a substantially higher rate than the lower educated households.
Table 001 shows that, comparing persons who lived in the central city of Boston in 1955 and who still live there in 1960 (the non-movers), with persons who lived in the central city in 1955 and who had moved to the suburbs of the Boston Metropolitan Area in
1960, a relatively large proportion of movers tend to be in the very
young ages (5-9) and in the ages of family formation (25-44).
Movers from the suburban ring into the central city also tend to move at a higher incidence at the ages of family formation (although the cut-off point is here younger: 25-34), but significantly, there
is no accompanying high incidence among the youngsters in the school going ages.
1-2
Comparing movers and non-movers by educational attain-ment, the movers tend to have substantially higher levels of education (Table 002). For those who moved to suburbia the pro-portion of persons with college level education is twice as high as for those who remained in the central city, while the propor-tion of those having no more than eight years of educapropor-tion was half as high.
Similarly, occupation-wise, the proportion of education-intensive occupations such as professionals among those who left the city is twice as high as for those who remained in the city, while the proportion of service workers was half as low (Table
003).
It is interesting to note that socio-economic differences between those who moved from the central city to suburbia, compared with those who remained in the city are stronger in respect to age,
education and occupation than in respect to income. The greatest
differences as far as income is concerned occur at the very low income level vhere the proportion of income below $3000. - among those who remained in the city is more than double the proportion
among those who moved to suburbia. At the other end of the income scale the differences are much less pronounced. In fact the strong-est exodus occured in the middle income categories where income is between $5000. - and $10,000.
Testing fQ Spuriousness
The foregoing observations can be readily made by the analysis of U. S. Census data, available in print.
The tables however, do not reveal to what extent these general findings are spurious in the sense that it may well be that the highly educated households who moved to the suburbs, maybe moved following shifts in employment, or maybe moved to the suburbs to
enjoy the fresh air, the mowing of the lawn, the status derived from owning a single dwelling unit or other "magnet factors" which are
generally mentioned as inducing- households to move from central cities to suburbs.
To eliminate the possible influence of these factors I have prepared a special analysis of the Census data available on computer tape which enables me to compare the characteristics of households who moved fram the central city into apartments or at-tached dwelling units in the suburbs, keeping their job in the central city.
Of these households it cannot be said that they moved for
employment reasons, since their job remained in the central city, neither can it be argued that they moved to the suburbs to achieve the pleasures connected with the single dwelling unit, since
general-ly, attached dwelling units and apartments are available in the
central city in the same or greater variety of choice as in the
1-4
MethodologyThe following analysis is based upon information retrieved from the U. S. Census Data Bank, available on computer tape, repre-senting a sample of 1/1000 for the population of the North East Region of the United States (see map).
The hypothesis to be verified in this analysis is that for a segment of the population, of those who moved frm the central
city to suburbia, the move was in response to factors other than shifts in employment or the availability of the single dwelling unit.
Furthermore, it is hypothesized that, if highly educated people tend to move to suburbia frcm the central city at a higher incidence for reasons other than shifts in employment or choice of
single dwelling unit, their move is most probably, at least partly
in response to better educational opportunities in the suburbs. The corresponding nul hypothesis is that:
a) family heads with high education move at the same rate as, or
at a lower rate than other family heads to suburbs, while keep-ing their job in the city, and,
b) that family heads with high education who move to the suburbs while keeping their jobs in the city will choose at the same
rate as, or at a lower rate than others to live in attached
dwelling units or apartments; types of dwelling units which are abundantly available in the city itself.
HN-SUPERIOR (PT.1
GREEN SAY PORTLN
- TiCA-ROME
-SCH4 REYAD MNCHESTER LOWELLCE
BAY CITY FICHBURG HAE IL
MUSKEGON-MUSKEGON HEIGHTS SGNWF
EM R BOTN KO
SAGINAW~~~ PTSEDESTEROKO
MASN MILWAUjKEE LASN FLINT DERI UFL HESTER LDFALROR
._KENOSHA GR ND RAPIDS gfAGHANATON HARN
ROCKFORD KALAMAZO ERIE ALLENTOWN
-BET E
ACKSON ANOR SCRAL N PROViDENCE-PAWTUCKET
.- CHCAGO OUTH END BOLED CLEVELAND Yo STOWN-WARREN El E DN.RTO-OWC
MCIA DOGERAYONDESTCOAOAKONITSUG TO E
~
tN EFOT AYE LE CANTO RT NBUR ORWALN
SPRINGORTELRI WHEEI N OHNTADNEWYOR
NCIE
COLUMBUSE-IDK SECATURIE GR EI EHATE HALO - AMDDLTO N ASHTNGTONNPHELADELPN
CHALETO
LeIMAlta Statitica AreS ude th dreGi
-~N E ASVLE SHAN
PEOLORSVLL LEXBENINGTONRO RtCHMOND
ROANOKEIN LYHNCH UGTE S.A PTNWc
uNu
GN-~~~~~NWPR I, C BBLIMR ININPOI[ MUCI -ALATCCT
SPRINGFIEL. URBOADAFO LI TS ONT
1-5
Verification
The use of U. S. Census tapes for social analysis poses
some problems of information retrieval which are discussed in more
detail in the Appendix. Here it may be sufficient to note that
the extremely small size of the sample makes it necessary to combine
social categories which preferably should be kept distinct.
Diagram I represents the information tree, obtained by
com-bining the following categories:Region of residence: ... ...
Location of residence in SMSA (1960):...
Previous location of residence in SMSA (1955):. Location of place of work in SMSA:. ...
Type of dwelling unit: ...
Educational attainment:...
Level of income: ... .
N.E. Region
central city, suburb
central city, suburb
central city, suburb
single, attached, apt.
high school,
3
years
college, 4 years or
more
up to $5,000
$5,000 - $10,000$10,000 or more
It will be clear that an analysis into such detail is impos-sible by using the conventional Census tabulations, available in print. Most cross tabulations in print combine only two or three of the seven
selected categories.
Unfortunately, the output loses a great deal in strength as a result of the comparatively small sample. By narrowing down to these
seven categories I obtain of the 35 million persons in the North East Region, information about some 400 cases.
Consequently, I have had to combine the levels of formal educational attainment and levels of earnings into two categories: a) persons of educational attainment up to the high school level
with salaries up to $5,000.
b) all other persons: those of high school level education with
earnings above $5,000. and those with education beyond high school with earnings of any level.
This division finds its justification upon the following grounds:
1) Any other division (e.g. comparing all persons with
high school level education with persons of educational attainment beyond high school) would leave too many cells with zero entries, which would make comparisons futile.
2) Most high school graduates who earn more than $5,000 have most probably attained some informal education through
on-the-job training, which makes them educationally comparable to low level
college graduates or college dropouts.
3) The analysis is essentially focussed upon residential choices. The freedom of choice is in fact limited by the level of education and income of the person. The assumption here is that whenever a person has an income over $5,000 or, an education of more than high school his observed choice of residence is more nearly in concert with his actual desires. For those with an education of high school or less, with an income below $5,000 the observed choice need not necessarily reflect actual desires.
DIA
R-AVMI
RESI PEwT DOU5C DtLPVSN--.RE10IN., PLACE OF
WOW Q(N T&A L C ITY
Live. ir CL-Mr~.AL c frY
.M4vu~o Fftet1 a uvr-s i v-Lt tA 41 7L'T4L
I-I
N014 NO IElk S U 8 U04 AL APr ti vS. tidVeo I P^OurS ioe SM-A
M40vao r-abi
& rt.,r w-4 L c r
- I I p p
393
2 3
f
5r
/
/
5~
.
3
17
17
/
E C)U Arl 0 A/L E3S- fOIE TH4AN H.S.
It8
3
1
J
2 06
7
3
~
6~74:
~fMN
IOUJ NOA~-z
Z07;
r226
-L3S
OR
38
By combining the data as described in the above I find
that the over-all ratio between: (a) persons of educational at-tainment of no more than high school level with earnings below $5,000 and (b) persons of educational attainment beyond high school with salaries above $5,000 is roughly low : high = 1 : 1.
The ratio between these two categories for those living in central cities is low : high = 1 : 0.87, and for those living
in the suburbs is low : high = 1 : 1.72. This means that central cities have a stronger concentration of households which have no more than high school education and earn no more than $5,000 a year.
Comparing movers and non-movers I find that the over-all ratio between the two categories of persons is low : high = 1 : 2.06
for the movers, and low : high = 1 : 0.89 for the non-movers. This
means that for each high school graduated person earning less than $5,000, who moves, we find more than two college graduated persons, or persons with income over $5,000 who moves.
For persons moving into the suburbs the ratio is low : high = 1 : 3.25, while for those moving into the central city the ratio is
low : high = 1 : 1.23. Hence, persons moving to suburbia are generally
higher educated and have higher earnings than people moving into the central cities, regardless where they came from.
If they came from outside the metropolitan area to a suburb the ratio is low : high = 1 : 8; i.e., chances are that for every lower
educated low income earner there are eight higher educated high salary
earners who move from outside a metrolpolitan area into a suburb with a job in the central city, while for people moving into the central city the ratio is low : high = 1 : 0.77.
I-8
It should be noted that these data refer to the combina-tion of all major Standard Metropolitan Statistical Areas of the North East Region with a population of over one million, including Buffalo, Boston, New York City, Newark, Paterson, Pittsburgh, and Philadelphia.
It is interesting to compare these findings with the earlier analyses of the education-specific inmigration into the Boston
Metropolitan Area.
It should be noted that in the earlier analysis which
considered inmigration into the Boston Metrolpolitan Area, a compari-son was made between people of educational attainment of high school
only and people of educational attainment of four years college or more. In the analysis above, for the North East Region as a whole,
a compariosn is made between people having no more than high school
education and an income of no more than $5,000 and people having more
than high school education or an income of more than $5,000.
Taking into account this difference of categorization, it is appropriate to check whether there appears to be a difference between the education-specific inmigration into the Boston Metropolitan Area
compared with the over-all education-specific inmigration for the whole North East Region.
As stated before, for the region as a whole the ratio is low : high = 1 : 0.77, i.e., chances are that for every person with
only eight years of education and earnings under $5,000, there is 3/4 of a higher educated, high salary earning person (0.77), who moves from the outside of a Metropolitan Area into the central city. For Boston
the ratio is low : high = 1 : 0.56, i.e., chances are that for
every migrant into the city coming from outside the Metropolitan Area with education less than high school there is only 1/2 of a migrant with education more than high school level (0.56), com-ing from the outside of the Metropolitan Area into the central city.
This points to the likelihood that Boston is in a
com-paratively disadvantageous position as far as influx of highly educated persons is concerned.
This difference may partly be attributed to the relatively small size of the central city of Boston, compared to the Boston Metropolitan Area as a whole. Considering that there is the tendency for lower income families to concentrate in the core of the metropolitan area, wherever this core is relatively small it will tend to be more homogeneously settled with a low income population. As a result, the chances that low income people will migrate to that area are also higher.
However, as pointed out before, in spite of the apparent
loss in absolute terms, the present inmigration from outside the
Metropolitan Area still results in a positive influx of higher educated people, relative to the influx of lower educated people, if conrpared to the influx which might be expected percentage wise (see Page 10, point one).
I-10
Going back to my analysis of education-specific migra-tion flows for the North East Region as a whole, I now shift from considering inter-metropolitan migration to intra-metropolitan migration: patterns of migration within metropolitan areas.
The following observations can be made:
First movers coming from a suburb to the central city
of the same metropolitan area tend to be of low educational levels;
coming from a suburb to a central city, less movers are of low educa-tional backgrounds with low earnings than of high educaeduca-tional back-ground or with high earnings. The ratio here is low : high = 1 : 1.75.
Second. in the opposite direction, moving from the central city to the suburbs, the ratio is low : high = 1 : 2.30.
Third- in analyzing the choice of types of dwelling units among these movers from the central city to suburbia I find that the ratio between lowly educated, low paid earners and highly educated people is low : high = 1 : 2 for those who choose a single dwelling
unit; for those who choose an attached dwelling unit the ratio is low : high = 1 : 3, and for those who choose an apartment the ratio
is low : high = 1 : 2.33. Compared with the over-all ratio of the
distribution of the two education/income categories over the types of dwelling units the following picture emerges:
Ratio of People With Law Education and Low Earnings Over People With High Education or With High Earnings:
Single Dwelling Attached
Apart-Units Dwelling ments
All Persons Liv-
U
ing in the metro- low : high = 1 : 1.51 1 : 0.73 1 : 1.67
politan area Those who moved
from the central low : high = 1 : 2 1 :3 1 :2.33
city to suburbs,
keeping job in central city
I-11
The strongest difference is found among those who choose an attached dwelling unit, in the sense that a higher preference
for this type of a dwelling unit was expressed by relatively educated,
high salary earners who moved from the central city to the suburbs, than by low educated movers.
In addition, the choice of an attached dwelling unit by higher educated movers from the central city to suburbia was much higher than might have been expected upon the basis of the over all choice of this type of housing.
The above findings lead to the conclusion that higher educated persons do move at a more than expected rate to suburbia, and do choose at a higher rate than others for an attached dwelling unit. Hence, the nul hypothesis has to be rejected, which adds evidence to my main
hypothesis that at least a segment of the higher educated population, moves to suburbs to take advantage of better educational opportunities.
In Part II I will go into more detail to which suburbs the identified sub-population tends to move, and what the specific character-istics of these suburbs are in terms of educational facilities as cca-pared with other "magnet factors" of these communities.
PART II
DIFFERENCES BETWEEN C01&lUNITIES
In Part I it was demonstrated that there is evidence that
the uneven quality in educational facilities between central cities and suburbs has affected the pattern of socio-economic in migration into the central cities and into the suburbs.
In this section I will analyse to what extent the
geographical-ly uneven quality in educational facilities between metropolitan
com-munities has affected the pattern of residential choices of families among the seventy-six communities in the Boston metropolitan area.
As pointed out before1 it was assumed that the quality of educational facilities in suburbs is generally better than in the central cities. This generalization requires in fact substantial qualification.
Although there is evidence that the quality of educational facilities in the Boston metropolitan area is on the average better
in the suburbs than in the central city, it stands out that the
quality of educational facilities varies enormously among suburbs,
and that the quality of a number of suburban school systems stand at a lower level than the school system which serves the central city.
The main hypothesis of this thesis is, as stated before,
that families in their choice of residence seek to improve the educa-tional opportunities of their children, and that this concern for
II-1 See Page
good education in the community of their choice will be more evident among highly educated, high status parents than among parents with little education and low status.
Under the corresponding nul hypothesis there would be no relationship between the quality level of the educational facilities of a community and the rate at which the community
attracts new residents of specific socio-economic characteristics.
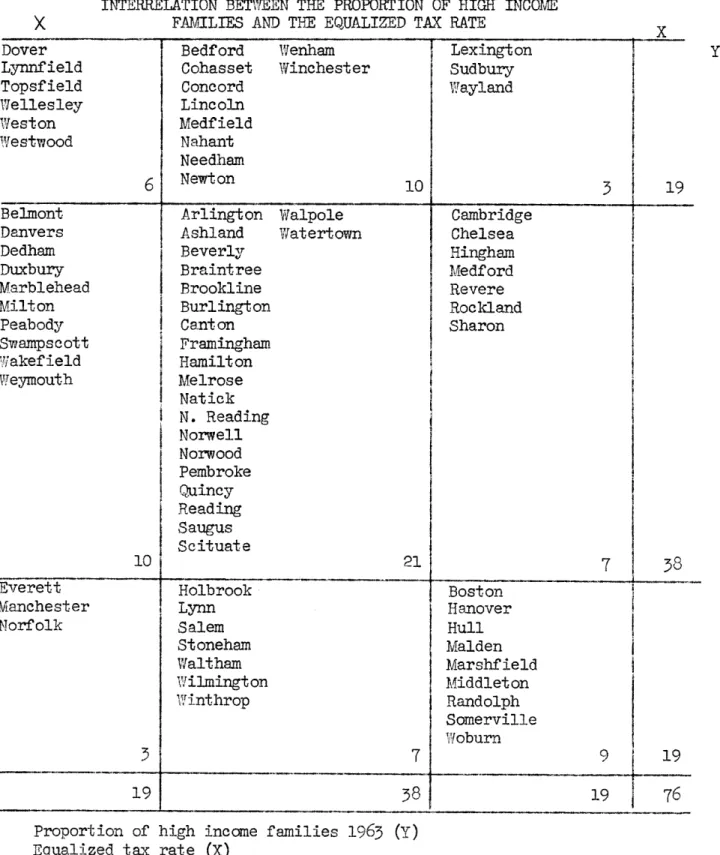
For purpose of analysis the seventy-six communities of the Boston metropolitan area, including the central city of Boston
were ranked (a) according to the rate at which they attracted new
residents of specific socio-economic characteristics and (b) according to the quality level of their school systems. A description of the
measurement of the rate at which a comunity attracts families of
specific socio-economic characteristics is available in the Appendix. In analyzing to what extent certain communities attracted
new residents of specific socio-economic characteristics as a result
of the quality of their school system it would not be enough to only demonstrate a relationship between quality of school system and status-specific in migration, because, quality of schools is not the only "magnet factor" by which a family is attracted to one community rather than to another.
If a community ranks high according to the quality of its
educational facilities, but is also attractive in same other respects, it is unclear to what extent in migration is in response to the quality of the schools or to some other "magnet factor" or combination of
11-3
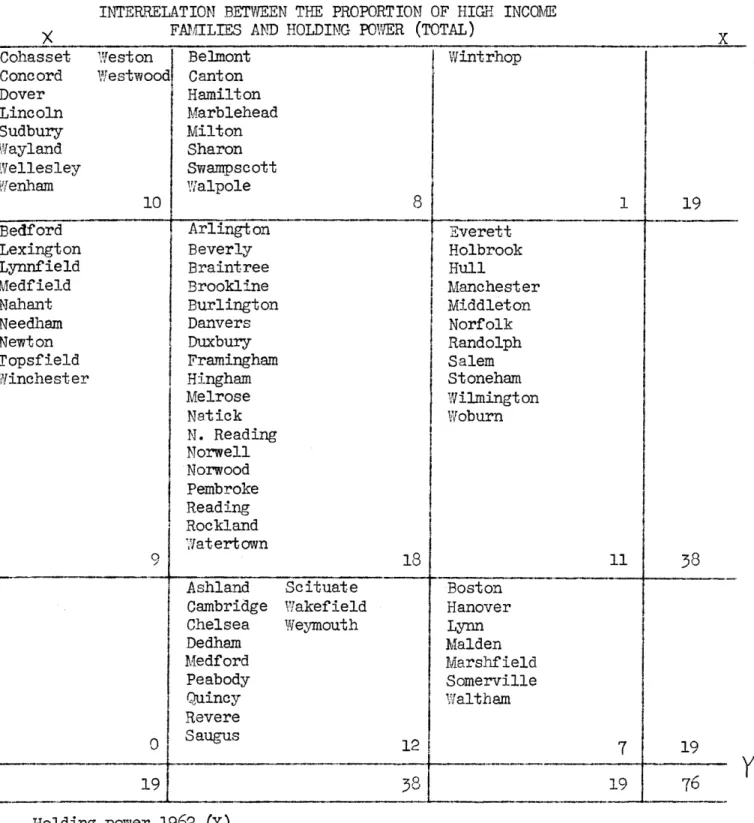
To compare the weight of educational facilities as a
magnet factor among other magnet factors, the seventy-six com-munities were, in addition to being ranked according to the quality of their school systems, also ranked according to four other magnet factors.
The selected choice criteria or magnet factors are in order of appearance: quality of education, level of tax base,
distance to the central city, incidence of juvenile delinquency, the level of social services compared to social needs, employment, preponderance of the single dwelling unit type.
The indices used to express quantitatively the distribu-tion of the weight of these magnet factors over the seventy-six communities are described below. For more detailed description the reader is referred to the bibliographic sources.
4 4z)C) t0,C C) t 0 ri 15 5 0 WE E