HAL Id: hal-00735614
https://hal.archives-ouvertes.fr/hal-00735614
Submitted on 26 Sep 2012
HAL is a multi-disciplinary open access archive for the deposit and dissemination of sci-entific research documents, whether they are pub-lished or not. The documents may come from teaching and research institutions in France or abroad, or from public or private research centers.
L’archive ouverte pluridisciplinaire HAL, est destinée au dépôt et à la diffusion de documents scientifiques de niveau recherche, publiés ou non, émanant des établissements d’enseignement et de recherche français ou étrangers, des laboratoires publics ou privés.
A. Herrero-Langreo, Bruno Tisseyre, J.M. Roger, T. Scolach. How to sample to calibrate a spatial model : application for modelling wine water status.. IXth International Terroir Congress, Jun 2012, Dijon, France. 6 p. �hal-00735614�
1
HOW TO SAMPLE TO CALIBRATE A SPATIAL
MODEL: APPLICATION FOR MODELLING
VINE WATER STATUS
Herrero-Langreo A.1,2, Tisseyre B.2, Roger JM.2, Scholach T.*1
1
Fruition Sciences SAS., Cap Omega, Rond-Point Benjamin Franklin, Montpellier 34000, France.
2
UMR-ITAP/ Montpellier SupAgro – IRSTEA. 361 rue Jean-François Breton BP 5095, 34196 Montpellier Cedex 5, France
*thibaut@fruitionsciences.com
ABSTRACT
Several studies have shown that vineyards are spatially variable at within field scale. Characterizing this variability could be used to improve grape and wine production, by adapting management practices and harvesting to the vineyard variability. The goal of this work is to calibrate a spatial model by coupling high quality, high cost punctual vine measurements with low cost medium-high density ancillary data sources. For operational constraints, the number of measurements required to calibrate the model have to be as small as possible. The approach we propose is tested on a particular but significant example: the spatial variability of vine water status.
Exposed leaf area (ELA), trunk circumference (TC) and Pre-dawn leaf water potential (PLWP) were measured in 49 sites in a non-irrigated Syrah block. A sampling method was applied to rank these sites according to their suitability to represent the statistical variability on ELA and TC. The first selected sites were used for the calibration of a model relating ELA and TC with PLWP. The model was validated with the remaining sites.
The proposed method allowed the model calibration using only 3 sites. From 3 to 9 sites, the model performance improved for each additional site used for calibration from a Standard Error of Prediction (SEP) of 0.12 MPa to 0.10 MPa. The block statistical variability was well represented with the first 9 chosen sites.
This study proves the suitability of the approach to calibrate a spatial model describing plant water status spatial variability. The obtained site selection showed to be well suited to represent the within field variability and optimize site number and location for the calibration of the model. The work deals with an important operational constraint for the commercial application of spatial models: reducing the number of measurements needed for their calibration. This is a first, essential step for vine growers to be able to
spatially optimize vine management and harvest.
Key Words : sampling, vine water status, ancillary information sources, modelling Mots –Clés : échantillonnage, état hydrique de la vigne, variables auxiliaires, modèle spatiale.
2
1 INTRODUCTION
It has been extensively shown that vineyards are spatially variable at within block scale [1]. Differential management of this variability could allow optimization of vineyard management practices, and consequently to differentiate and improve grape and wine quality [2]. There is, nevertheless, an important limitation for identifying spatial variability in a vineyard: the cost or impracticality of taking direct measurements with enough spatial resolution. Measurements of soil properties, plant water status, nutrient or health status, quality attributes or even measurements of biomass are usually too costly and time consuming to be directly measured with enough spatial resolution. One extended solution is to use ancillary information, easier and more affordable to measure, in order to estimate high quality, high cost related attributes [3].
Between those high quality vine measurements, plant water status has been extensively indicated as a crucial parameter greatly affecting grape and wine quality and production [4-6]. In this regard, Acevedo-Opazo et al. [7], proposed a conceptual spatial model based on ancillary information sources to estimate vine water status spatial variability at within field scale. Nevertheless, to be operational, even if a spatial model has been developed an important constraint for its practical application is its calibration for a particular field or conditions. If the variable to estimate is expensive and/or too time-consuming, the model could only be used operationally if it can be calibrated with a small number of measurements. In some cases, the affordable sample size could be as low as 3 to 5 measured locations per field. Aiming to overcome this constraint, the goal of this work is to propose a sampling method to optimize the location of high cost vine measurements in order to calibrate a regression spatial model with a very small number of measured sites (3-10). The spatial model proposed by Acevedo-Opazo et al. [7] to estimate vine water status spatial variability at within field scale was used as a case study.
2. MATERIALS AND METHODS
2.1 Study Case: Spatial model for the estimation of plant water status
According to the work by Acevedo-Opazo et al. [7], a linear regression model relating ancillary data sources and plant water status is considered in the current work. Based on the results of this study, growth and vigour
3 vine measurements were used as ancillary information sources for estimating plant water status.
2.1 Site description
The experiment was carried out on a 1.2 ha unirrigated Syrah field , established in 1990 with 1 m spacing between vines and 2.5 m between rows, with the vines trained in a vertical shoot positioning system. The soil is considerably variable in soil water availability and vine growth [8]
2.2 Measurements
The database presented by Acevedo-Opazo et al., [7] comprised plant water status measurements as well as Exposed Leaf Area (ELA), and Trunk Circumference (TC) was used in this work. All variables were measured on 49 sites, arranged in a regular grid. Each site was identified with a georeferenced position in the field with a stand-alone GPS receiver (Garmin Etrex).Vine water status was measured as predawn leaf water potential (PLWP) between 3:00 and 5:00 a.m. using a pressure chamber [9] on a date corresponding to a significant water restriction. Three adjacent vines were measured at each sampling site and averaged to obtain a site value (si). Exposed Leaf Area (ELA) was measured manually using the method of Murisier and Zufferey [10] in order to assess the seasonal vegetative growth. Trunk circumference (TC) was measured 10 cm above the graft of each target vine, as an integrative attribute taking into account the average vigor of the vines from the date of plantation.
2.3 Sampling method
Kennard and Stone method (K&S) [11], based on experimental design theory and aimed for linear regression models is proposed for the calibration of the spatial model. The approach of the method is to select the sites to be used for calibrating the model according to their values on the ancillary variables (i.e ELA and TC). The criterion for the site selection is to maximize the variance gathered by the sampled sites according to their values on the ancillary variables. The method provides a rank of sites. This rank describes the order in which the different sites need to be sampled in order to maximize the variance for each sample size, this is, in order to optimize the calibration of the model for any given affordable number of PLWP measurements.
4
2.4 Mapping
Mapping was done with the 3D field software (Version 2.9.0.0, Copyright 1998–2007, Vladimir Galouchko, Russia). Inverse distance weighting was used for interpolation because of the limited number of data (n=49) in the field.
3 RESULTS AND DISCUSSION 3.1 Spatial model
The spatial model was able to explain most of the variation on PLWP in the parcel (R2=0.85) when using all available 49 measurements for the calibration of the model. The Standard Error of Calibration (SEC) was 0.1 MPa. This value represents best expected performance of the chosen spatial model to explain the within block spatial variability of PWLP.
3.1 Results of the sampling method
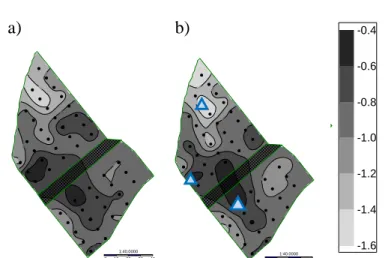
The proposed method allowed the model calibration using only PLWP measurements taken on 3 sites. From 3 to 9 sites, the model performance improved for each additional site used for calibration from a Standard Error of Prediction (SEP) of 0.12 MPa to 0.10 MPa. The SEP represents the error when applying the calibrated model to estimate plant water status in sites of the parcel where only auxiliary measurements are available. The standard deviation (STD) of PLWP within the block was 0.258 MPa. The STD value accounts for the error produced when the average PLWP of the block is considered as a general estimation of PLWP for every site. Thus, the spatial model calibrated with only 3 sites provides in this case a significant improvement over using the average of the block as a general estimation of PLWP for every site.Figure 1 a) shows plant water status (PWLP) zones estimated in the parcel through the spatial model calibrated with the 3 sites selected by K&S. When compared to the zones obtained with 49 PLWP measured values, shown in Figure 1 b), similar spatial structure can be observed in both cases.
5 -1.40 -1 .20 -1.20 -1.00 -1 .00 -1.00 -1 .00 -0.80 -0.80 -0.80 -0.80 -0.80 -0.60 -0 .60 1:40.0000 0 10 20 30 40 a) b) -1.40 -1 .4 0 -1.20 -1.2 0 -1.2 0 -1.00 -1.00 -1 .00 -1 .0 0 -0.80 -0.80 -0.80 -0.6 0 1:40.0000 0 10 20 30 40 -0.4 -0.6 -0.8 -1.0 -1.2 -1.4 -1.6
Figure 1 : Observed (a) and estimated (b) PLWP values using the spatial model calibrated with 3 sites, selected through K&S. the Geographical location of the selected sites is marked in the figure.
4 CONCLUSIONS
This work dealt with an important operational constraint for commercial application of spatial models in viticulture which is:” how to reduce the number of measurements needed for the calibration of a spatial model?” The case study here focused on a linear regression spatial model based on ancillary information sources. The spatial model was used to estimate the spatial variability of vine water status at a within field scale. This case study is relevant for the wine industry because of its commercial implication in terms of vineyard water status management and its direct impact on yield and wine quality.
A sampling algorithm based on experimental design was tested for the selection of sites to be used in the calibration of the model. The method provides a rank of sites based on one or more ancillary information sources (AIS), i.e, plant based measurements such as trunk circumference and exposed leaf area. Measurements of plant water status taken at these selected sites can then be used to calibrate a model that relates plant water status with relevant AIS. The resulting model can be applied to the rest of the field at each location where AIS are available. Once the spatial structure of the field has been highlighted by AIS, then, the information provided by selected sites can be used to estimate the spatial variability of plant water status within the field.
The current work proves that such a spatial model can be calibrated using a very reduced number of measurements (3 measurements of plant water
6 potential taken at the time when plant water status of the field needs to be characterized). The calibrated model allows the delineation of different homogeneous within-field zones. This information could be used as a decision tool for improving the management of field operations like irrigation.
This method can be extended to other variables provided the availability of relevant AIS with a convenient resolution adapted. In general terms, this approach could be used to better characterize the spatial variability of key production parameters (such as yield, water status of quality parameters like sugar content) at spatial resolutions that are cost prohibitive to generate with targeted measurements.
Thus, this work represents a first step towards the optimization of vineyard management practice for routine practices in a commercial context.
REFERENCES
1. R. G. V. Bramley, 2005. Aust J Grape Wine Res., 11(1), 33-42.
2. B. Tisseyre, H. Ojeda, J. A. Taylor, 2007. Jour. Int. Sci. Vigne Vin., 41(2): 63-76. 3. R. G. V. Bramley, J. Ouzman, P. K. Boss, 2011. Aust J Grape Wine Res., 17(2):
217-229
4. C. V. Leeuwen , O. Trégoat, 2009. Jour. Int. Sci. Vigne Vin., 43(3): 121-134. 5. H. Ojeda, C. Andary, E. Kraeva, A. Carbonneau, A. Deloire, 2002. AJEV., 53(4):
261-267.
6. L. G. Santesteban , J. B. Royo, 2006. Sci. Hort. 109(1): 60-65
7. C. Acevedo-Opazo, B. Tisseyre, J. A. Taylor, H. Ojeda, S. Guillaume, 2010. Precis. Agric., 11(4): 358-378
8. G. Coulouma, B. Tisseyre, P. Lagacherie, 2010. in Proximal soil sensing. Progress in
soil science series., R. A. Viscarra-Rossel, A. B. McBratney, and B. Minasny (eds).
Heidelburg, Germany.
9. P. F. Scholander, H. T. Hammel, E. D. Bradstreet, E. A. Hemmingsen, 1965. (148): 339.
10. F. Murisier and V. Zufferey, 1997., Revue suisse Vitic. Arboric. Hortic, 29: 355– 362.