POINT SOURCES IN HOMOGENEOUS
POROELASTIC MEDIA
Matthijs W. Haartsen and M. Nafi. Toksoz
Earth Resources LaboratoryDepartment of Earth, Atmospheric, and Planetary Sciences Massachusetts Institute of Technology
Cambridge, MA 02139
ABSTRACT
In a porous medium saturated with a fluid electrolyte, mechanical and electromagnetic disturbances are coupled. The coupling is electrokinetic in nature since it is due to an excess of electrolyte ions that exist in an electric double layer near the grain sur-faces within the material. Mechanically-induced streaming currents generated by point sources in homogeneous, isotropic porous media are presented. The electrically-induced streaming current is shown to be second-order in the electrokinetic coupling coefficient and can be neglected. This decouples the mechanical behavior from the electromagnetic behavior with respect to the induced fluxes and simplifies the analysis of the relative fluid flow and dynamic streaming current.
We used Biot theory to calculate the amount of induced relative flow by the solution to Green's function. The transport coefficients-conductivity, dynamic permeability, and the electrokinetic coupling coefficient-and their sensitivity with respect to porosity, dc permeability, and frequency changes are evaluated. Conductivity decreases with increasing dc permeability. It has a k
0
1/2 dependence when grain surface conductances are more important than the bulk fluid phase conductivity.Stationary phase relative flow and streaming current solutions are calculated for an explosive and vertical point source acting on the bulk and a volume injection source acting on the fluid. The streaming currents are induced both by
P
andS
waves. The streaming current decreases with increasing fluid conductivity. This is consistent with the decrease of the diffuse double layer thickness and (-potential.The porosity effect on the streaming current induced by S waves is different from the currents induced by the P waves. The porosity affects the bulk moduli of the solid. Its effect, combined with the frame bulk modulus and compressibility of the saturating
fluid, determines the streaming current amplitude induced by aP wave versus porosity. The increase in streaming current amplitude induced by S waves with increasing poros-ity is due to the decrease of the shear frame modulus with increasing porosporos-ity. The streaming current behavior with respect to dc permeability is found to differ for sources applied to the elastic frame and volume injection sources.
INTRODUCTION
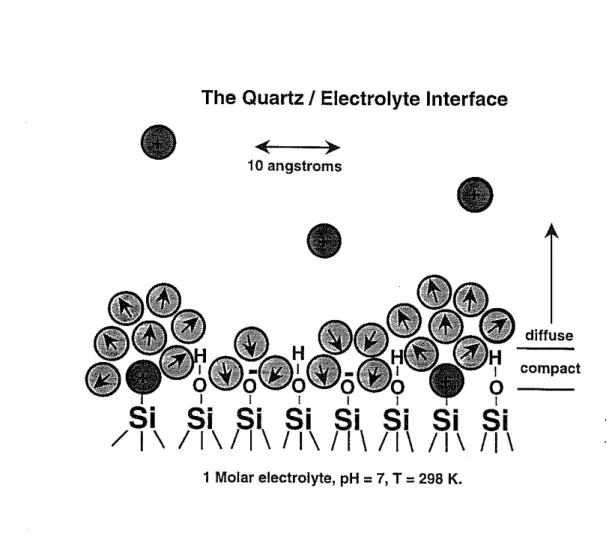
Electrokinetic phenomena are usually studied with respect to solid and liquid interfaces. When two phases of different chemical composition are in contact, an electric potential difference develops between the two interfaces. The anions from the electrolyte are adsorbed to the solid interface (i.e., a quartz matrix), leaving behind a net excess of cations distributed near the wall, and producing an electric double layer. There are several models of the electric double layer. One is the Gouy-Chapman type model (Bockris 1970; Dukhin and Derjaguin, 1974), a diffuse layer model where the counter ions are attracted to the surface only by electrostatic forces. Another model of the solid/fluid interface which is currently favored is largely due to Stern (1924). He argued that the electrolyte ions and structured (hydrogen bonded) water molecules are not only electrostatically but also chemically adsorbed to the surface of the solid. This adsorbed Helmholtz layer (Overbeek, 1952; Bockris, 1970), contains immobile adsorbed ions and can also include ionized surface sites present on the grain surfaces, as shown in Figure 1. Beyond this first layer of bound ions, there is a diffuse distribution of mobile ions whose position is determined by the Poisson-Boltzman statistics. In the diffuse layer the ions are under the continued influence of the ordering chemical and disordering thermal forces. The Stern model is therefore a composite of a Helmholtz layer and a Gouy-Chapman diffusion zone. The separation plane between the mobile and immobile charge is the hydrodynamic slipping or shear plane. The potential at this shear plane is called the (-potential, the value of which is often used to characterize the double layer. The electric potential in the neutral electrolyte (no excess charge) is defined to be zero. Modifications to the Stern model have been proposed. In particular, Grahame (1947) suggested splitting the Helmholtz layer into an inner and outer region. The inner region is populated by dehydrated ions stuck to the bare solid with specific adsorption forces, while the outer region would contain the partly hydrated ions and structured (hydrogen bonded) water molecules that touch a hydrated solid rather than stick to a bare solid. There is experimental evidence suggesting that long-range chemical forces from adsorption sites on the quartz surface may align water molecules for up to several hundred molecular distances away from the wall, as discussed in Derjaguin
et
al. (1987).
An important aspect of the adsorbed layer is the fact that chemical adsorption of dissociated 0H- andH+ ions at the quartz surface is more dominant than adsorption of the electrolyte anions in determining the potential (Gaudin and Fuerstenau 1955;
the theoretical Stern model with respect to aqueous organic electrolyte solutions, are in Anderson (1959) and Fuerstenau and Modi (1959). The adsorption mechanism involves a combination of electrostatic attraction and long organic (hydrocarbon) chain associ-ation (Van der Waals attraction) which can be incorporated into the Stern framework of a double layer description.
In this paper, we study the effects of dynamic relative motion between a solid and monovalent anor6anic electrolytes. The Stern electrical double layer description is used to characterize the grain-electrolyte interfaces. The fluid is assumed to be an ideal electrolyte, thus restricting salt concentrations to be less than 1.0 mol/I. At this mo-larity the ion separation distance becomes such that electrostatic interaction energy becomes significant compared to thermal energy. There are numerous phenomena at the shear plane defined by its (-potential. Examples of these 'electrokinetic phenomena' are electroosmosis, electrophoresis, and the streaming potential (Bockris, 1970). The (-potential is fundamental in all these kinetic phenomena and will be discussed later in this paper.
Our overall goal is to provide theoretical/fast numerical tools to analyze future ex-perimental streaming current data as a function of fluid chemistry and permeability in porous material. An advantage of measuring streaming currents is not to have to know the value of the grain surface conductance if one wants to determine the (-potential. In inhomogeneous media (I.e., layered media), an imbalance of dynamic streaming currents across an interface causes electromagnetic radiation. A so-called seismoelectric conver-sion has occured (Haartsen et at., 1996). To quantify such a conversion it is important to understand the effect of fluid chemistry and the permeability of the porous material on the dynamic streaming current.
The first part of this pap lr discusses the macroscopic transport coefficients and their sensitivity to porosity and dc permeability. The second part derives descriptions of dynamic streaming currents induced by point forces (vertical and explosive point forces). The last part shows the streaming current behavior with respect to important lithological parameters.
MACROSCOPIC TRANSPORT COEFFICIENTS
Transport equations to describe electrokinetic phenomena in a porous medium can be treated within the framework of nonequilibrium thermodynamics (Groot and Mazur, 1984). For linear processes the flux/force equations relating the conservation equations for fluid flow and current flow, when there are electric potential and fluid pressure gradients, are:
1..
=
O'(w)E+
L(w) [-V'P+
iwptuJ'Iii = k(w) [-V'P
+
iWPf:i!,]+
L(w)E,7]
(1)
where
J...
is the electric current density, cr(w) is the frequency dependent conductivity of the two-phase medium, k(w) is the dynamic permeability, L(w) is the dynamic elec-trokinetic coupling coefficient, and 'TJ the fluid viscosity. The electric field strength Ecan be expressed as the gradient of a potential, E = - \7<P. The pressure P in the pore fluid which has a density Pf, Y. is the displacement in the bulk material and w is the relative fluid-solid motion. The dots above they.andw vectors denote a derivative with respect to time. The first term in equation (1) is the conduction current contribution and the second term is the streaming current contribution to the total current. The forces which drive the relative flow are a combination of pressure gradients set up by a compressional wave and by grain acceleration. The relative flow caused by grain accel-eration can therefore be due both to compressional and shear waves. The first term in equation (2) represents Darcy's law. The second term in the same equation describes the amount of fluid flow caused by the electric field that drives the hydrated mobile excess charge in the diffuse boundary layer-an osmosis phenomenon.
The fact that the cross-terms have the same coupling coefficients L(w), a symmetry which is one of the fundamental results in the theory of irreversible processes, is a statement of Onsager reciprocity (Onsager 1931a,b). The coefficient equality implies that the action of the electric field on the charge density is reciprocal to the action of the fluid pressure on the charge. In other words, the mobility of the ion is independent of the charge moving through the fluid or the fluid moving around the charge.
In order to give explicit expressions for electrokinetic coefficient L for porous media, the capillary model is often taken. The porous medium is assumed to be a composite of a bundle of capillaries. This approach-to obtain expressions for the electrokinetic coupling coefficient-is taken by Levine et al. (1975), Broz and Epstein (1976), Ander-son and Koh (1977), Donath and Voigt (1986), Manzanares et al. (1991), and others. Another approach is to study the behavior of these coefficients numerically. Jin and Sharma (1991) developed a numerical model for electrochemical and electrokinetic cou-pling in an inhomogeneous porous medium. Their network approach solves the coupled transport processes in inhomogeneous charged membranes/pores. The numerical re-sults provide insight into the relationships between pore structure, flow properties, and coupling coefficients. They conclude that several obvious characteristics of real porous media are not present in capillary-based network models. These differences between the model and experiment are discussed systematically in Sharma (1988) and Kuo et al..(1988). Their streaming potential measurements conducted on mixtures of alumina and silica yield results that differ significantly from that predicted by a simple, weighted average capillary tube model. The streaming potential was found to be a function of the grain sizes of the individual components. This grain size effect on the streaming potential in artificial spherical grain sands is also observed in data collected by Schriever and Bleil (1957).
Wurmstich and Morgan (1994) solved 3-D static transport equations by a finite difference scheme to investigate whether streaming potential measurements in boreholes and at the surface can be used to monitor subsurface flow and to detect subsurface
(5) flow patterns in oil reservoirs. Their model was limited by inadequate knowledge of the electrokinetic cross-coupling coefficients, which are important for determining streaming current/streaming potential magnitudes as a function of medium properties.
The coupling coefficients used in this paper, which are frequency dependent, are explicitly obtained by a volume average procedure of Maxwell's equations coupled to Biot's equations (Pride, 1994). Two possible functions that smoothly connect the low and high frequency regimes of the transport coefficients are:
k(w) = [[1-
i~~r2
-
i~r
(3) ko Wtm Wt[
-2
rl/2
L(w) . w m d32-
WPt2
(4) = l-I--(1-2c>00-)(l-i ldfrf)
Lo w, 4c>~ A ."The transition frequency
w,
separates the low frequency viscous flow behavior from the high frequency inertial flow and is defined by,</J 1)
W t =
-C>ooko Pt
and the dimensionless number m by, </JA2
m
==
C>ooko.
This number consists only of geometry terms and is model-dependent. The static coupling coefficient L
o
is given by,(6)
(7) where I<
t
is the relative fluid permittivity, ( is the zeta potential, c>oo is the tortuosity (normally a number between 3 and 10) and </J is the porosity. The J~ factor in equation (4) determines the viscous skin depth andJ.
is a measure of double layer thickness and depends on the electrolyte concentration, C. The pore length parameter, A, is the same as defined in Johnson et al. (1987).An important factor affecting the electrokinetic coefficient is the (-potential, as shown in equations (4) and (7). Theoretical determination of (remains problematic due to the complexity of the adsorbed layer. The (-potential employed in this paper is taken from experimental studies. A variety of researchers have determined the (-potential as a function of electrolyte concentration from streaming (-potential data. The (-potential values we used are based on saturated NaCl, KCl quartz samples at T
=
25°C and pH = 7, determined by Gaudin and Fuerstenau (1955), Sidorova et al. (1975) and Hidalgo-Alvarez et al. (1985). Pride and Morgan (1991) applied regression analysis
to their combined data and obtained the following expression for the (-potential as a function of electrolyte concentration;
((V)
=
0.008+
0.026Iog10 (C). (8)There have been few studies determining the (-potential for naturally occurring geo-logical samples such as sandstones. Sharma et al. (1987) determined the (-potential from streaming potential data for unclean samples of Berea sandstones. They obtained (-potential values at pH= 7 andT = 25°Cfor a 10-4_10-3M NaCI electrolyte which
are comparable to the values obtained using equation (8) for a specific concentration. Jouniaux and Pozzi (1995) determined (-potentials from streaming potential data for Fontainebleau sandstones under triaxial stress up to failure.
Morgan et al. (1989) and Ishido and Mizutani (1981) determined (-potentials as a function of temperature experimentally from streaming potential data. Morgan found that ( was independent of temperature for crushed Westerly granite in 10-2M NaCI
at pH
=
5.5, while Ishido and Mizutani found ( to change in magnitude by about -65 mV;aC for quartz in 10-3M KN03 at pH = 6.1. Streaming potential data collected
in artificial spherical-grain sands (Schriever and Bleil, 1957), show that the (-potential has a positive temperature coefficient whose approximate value is 0.039
;aC,
and the streaming potential has a positive temperature coefficient of 0.0535rC.
More experi-mental work is needed to understand the (-potential versusT relation. In our numerical calculations we used a constant 298 K temperature.Sensitivity of Transport Coefficients to Porosity and DC Permeability
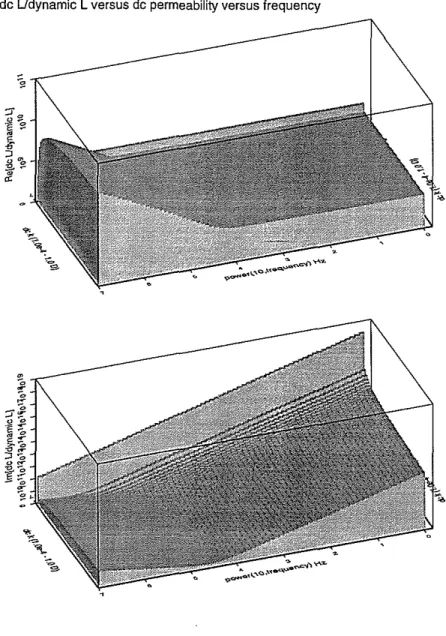
To investigate the transport coefficient behavior with respect to porosity and perme-ability changes, we calculate the ko/k(w) and Lo/L(w) ratios as a function offrequency using equations (3) and (4). The real and imaginary parts of theko/k(w) andLo/ L(w) ratios versus porosity are shown in Figures 2 and 3; the same ratios versus permeability are shown in Figures 4 and 5.
There is a distinct frequency relaxation present in the k(w) and L(w) transport coefficients. This relaxation frequency demarcates the transition from viscous flow to inertial flow. The k(w) relaxes at frequency WI, with Wt given by equation (5), while
L(w) relaxes at a frequency wt/m, with m given in equation (6). The k(w)
ampli-( ) 1/2 4a
2 Wt [
tude decreases as wwhen w
>
Wt, while L w decreases as w when w>
=;:;=
seeRe[ko/k(w)] and Re[Lo/L(w)] in Figures 2 and 3 and equations (3) and (4 )].
The conductivityIT(w), which controls the conduction current, relates current density to electric field strength and is defined in Pride (1994),
IT(w)
=
<p[:~
+
~
(Cern+
Co,(w))] . (9)With Cern and Cos, the conductances due to electromigration and osmosis along the grain-pore fluid interfaces are, respectively,
C( )-
(EOKf()2[1 _
'3/2JWPf]-2os W - - ~ ,
2d71 71 (11)
(12) with q, the elementary electron charge; C, salinity; k, Boltzmann's constant; T, tem-perature and
d,
the Debye length, which is a measure of the thickness of the diffuse double layer and defined as,_
~2z2n
d-- EOKfkT
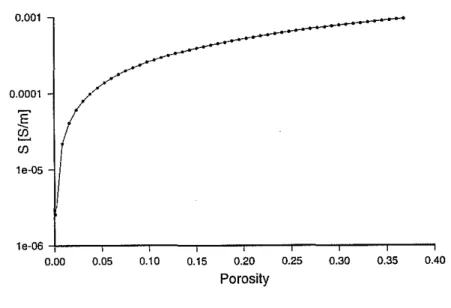
with z the ion valence and n the ionic concentration. Uf is the conductivity of the fluid. Figures 6 and 7 show the conductivity versus porosity and permeability. Conduc-tivity increases monotonically with increasing porosity. ConducConduc-tivity does not change linearly with porosity due to porosity dependence in the A[m], pore length parameter.
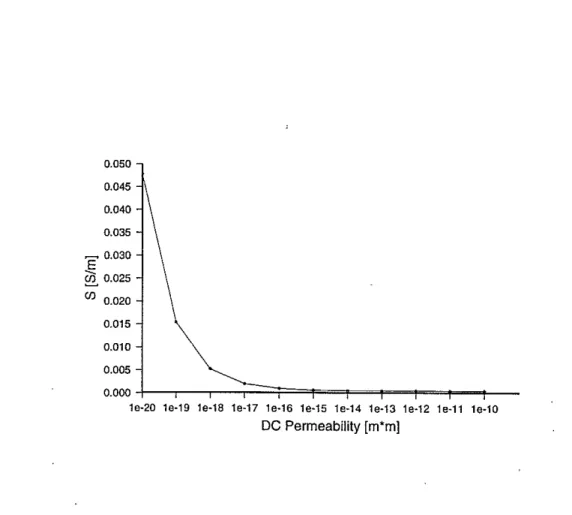
Conductivity decreases with increasing permeability. At a 10-16 m2 permeability, the A parameter becomes comparable in value with the sum of osmotic and electromi-gration conductances. At a constant porosity and permeabilities less than 10-16 m2,
the surface conductances become more important than the fluid phase conductivity. In Figure 7, this behavior shows itself as a sharp increase in conductivity at the low permeability end of the figure. Physically this situation occurs when the pore space is filled with clays which do not decrease the porosity but greatly enhance the surface-to-pore-volume ratio and therefore enhance the conduction along the pore surfaces. Mechanically-Induced Streaming Currents
The macroscopic current den sity in equation (1) has three distinct contributions: diffusion current density, conduction current density, and streaming current density. If
frequencies are in the seismic frequency range of interest macroscopic diffusion currents can be neglected. We will concentrate on the dynamic mechanical streaming current contribution to the total macroscopic current. From the transport relations we deduce the streaming current induced by relative flow. Since there is an electrically- and a mechanically-induced relative flow, we also have electrically- and mechanically-induced streaming currents. Substituting equation (2) into equation (1), the total streaming current can we written as,
(13) We neglect the electrically-induced part of the streaming current since it is second-order in electrokinetic coupling coefficient LICs/kg], which was also derived by Neev and Yeatts (1989). Defining an effective fluid density operator (Pride et al., 1993) that controls the magnitude of the wave-induced relative flow PElkg/m3] - iwE(wj' the mechanical part of the streaming current can be written as,
The relative flow vector is obtained by a Green's function solution (see appendix). This relative fluid flow, driven by pressure gradients and grain acceleration, is determined from linearized force balances. In Pride
et
al. (1993) a geometric condition on nonlinear flow in a homogeneous poroelastic medium is obtained. The nonlinear convection term of fluid flow is considered negligible if the pore radii are less than 100 p.m for water solution-saturated media under a maximum allowed strain of10-6 . It is assumed that the above conditions are satisfied in the numerical modeling. Therefore, the effect of turbulence upon electrokinetic phenomena (i.e., streaming potentials/currents) can be ignored in this study (Rutgerset
al., 1957; Kurtzet
al., 1957).Measurements to determine the electrokinetic properties of capillary surfaces or porous media have been traditionally performed under a static electric potential gradi-ent or pressure gradigradi-ent. Transigradi-ent streaming potgradi-ential modeling using Biot's consolida-tion work in the quasi-static limit to obtain quasi-static flow, which drives a streaming current through a porous medium, was studied by Chandler (1981) and Chandler and Johnson (1981). The performed experimental studies of diffusive flow from transient pressure pulses in various porous structures, where streaming potentials were used to monitor fluid pressure, show that the Biot slow wave can be detected with the stream-ing potential. Chandler (1981) proposed a streamstream-ing potential-based loggstream-ing tool that would indicate permeability variations.
Dynamic measurements of streaming potentials and streaming currents are discussed by Packard (1952), Groves and Sears (1975), Sears and Groves (1978), and Cerda and Non-Chom (1981). Their experiments are based on sinusoidally alternating fluid flow through capillaries and porous media to measure electrokinetic phenomena.
Direct measurements of streaming currents can be found in Hurd and Hackerman (1955) and Rutgers
et
al. (1957). They argue that investigations of electrokinetic phe-nomena traditionally have been restricted almost exclusively to measurements of the streaming potential because of the exceedingly low streaming currents. The advantage of measuring streaming currents is to not have to know the value of the surface con-ductance to determine the (-potential, which needs to be determined when streaming potential measurements are made. An additional disadvantage of streaming potential measurements is their sensitivity to temperature due to the temperature-dependence of resistivity. Groves and Sears designed an experiment to measure alternating streaming currents resulting from monochromatic sinusoidally alternating fluid flow.In this paper, we investigate numerically the effect of porosity, permeability and fluid chemistry on the dynamic streaming currents caused by point forces in porous media. The numerical results are useful in designing an experiment to measure dynamic streaming currents generated by point sources/transducers in poroelastic media. The theoretical streaming current prediction could possibly be used to invert for a medium parameter, such as permeability, from dynamic streaming current data, provided the data is sensitive to the particular medium parameter.
(15)
(16)
(17)
DYNAMIC STREAMING CURRENTS MECHANICALLY
INDUCED BY POINT FORCES
We obtain the relative flow vector generated by vertical point forces and explosive point forces (volume injection sources) by using the relative flow Green's function solution for a point source applied to the frame and fluid [equations (A-I) and (A-7
)1.
The dynamic streaming current components can be determined by substituting this relative flow vector into the mechanical streaming current equation, (14), and using electrokinetic coefficient L(w) defined in equation (4). We first calculate the streaming current components generated by a vertical point source applied on the frame. Then the streaming currents for an explosive point source applied on either the solid or fluid phase are given.Vertical Point Force on Solid
The mechanical streaming current is calculated for a vertical point force (parallel to the symmetry axis) at the origin, F(x) = i8(x). Using Green's theorem, we obtain,
!o
"
8
8
w = GW •F(x )dx = gWi -1jJ"'V-'l? - --y"'V-'l?* v-s 8z 8z with, 1jJ=
~
[C
2- HM+
GC
PE] C PI 2 HM 2 pBPE 2 2 y=w P I -C+w
C---Hw PE-Mw PBPIwhere GW, gW,'l?, 'l?* are defined in equations (A-I), (A-6), (A-2) and (A-4), respectively. Writing out in component form the following equations are obtained,
J;
=
8~
W2pEL(w)i:[
ZW5
H;2)(lr)+
mW~,
H;2) (mr)+nW~2H;2\nr)]kze-ik.zdkz (18)
J:
=
8~w2PEL(w)
i:
kz [W$Ha2)(lr)+
W~,Ha2)(mr)
+W~2Ha2)(nr)] e-ik;zdkzdkz (19)
where the introduced variables,
W;
andW;,
withp = (3V 0<1V 0<2 are defined as,W
T [3 1jJB(ws)+
--yB*(ws), 1jJA1(ws)+
--yAt(ws), 1jJA2(ws)+
--yAi(ws), -1 1 W$ = Gf!..E.k2+
1jJB(ws)+
--yB*(ws) Pi Z W~,=
1jJA1(ws)+
--yAt(ws) W~2 = 1jJA2(ws)+
--yA2(ws), (20)with B(ws),Aq(ws) defined in equation (A-3) and B*(ws),A~(ws)defined in equation (A-5 ), with q
=
1 V 2.Explosive Point Source on Solid and Fluid
The relative flow vector for an explosive point source at the origin can be obtained by taking the divergence of the relative flow Green's function with respect to the source coordinates.
w = \7gW _,p\7\72iJ> - 1'\7\72iJ>* (21)
where GW,gW,iJ>,iJ>*,,p,1' are defined in equations (A-1), (A-6), (A-2), (A-4),
(16 ) and (17), respectively. The two relative flow components are,
JS = -iw2p L(w)
/00
[mW" H(2)(mr)+
nW" H(2)(nr)] e-ik,zdk (22)r 81r E -00 cq 1 0;2 1 z
(23)
(24) with Aq(ws) defined in equation (A·3) and A~(ws) defined in equation (A·5), with q
=
1 V 2. In isotropic media only compressional waves are generated by an explosive point source.The relative flow vector caused by a volume injection source is,
T
=
~w2p
L(w)/00
k.[w
z H(2)(mr)+
W z H(2)(nr)] e-ik,zdkz 8 E .:. 0;1 0 0:2 a z
7r
-00
where the introduced variables,
W;
andW;,
with p= O!l V0!2 are defined as,W~l = W~l = (,pAl
+
I'Ai)k;l
W~l
=
W~2=
(,pA 2+
I'A;) k;2w
=
\7Y'J
with
Y'J
defined in (A-7).The induced mechanical streaming current components are,
J..:
= -8~
W2pEL(w)i:
[mW~l
Hi2)(mr)+
nW~2Hi2)(nr)]
e-ik,zdkz(25)
(26)
J..~
=4~w2PEL(w)
i:
k z[W~lH~2\mr)
+
W~2H~2\nr)]
e-ik,zdkzwhere the introduced variables,
W;
andW;,
with p = O!l V0!2 are defined as,Wr - WZ -A
a1 - 0:1 - 1 W r -WzO!z- 0':2--A2
(27)
(28) with Al and A2 defined in equations (A-8).
The following horizontal wavenumbers were used in the above,
[
2 ]1/2 [ 2 ]1/2
Stationary-Phase Solutions
The method of stationary-phase yields an asymptotic solution to integrals of the form (Ben-Menahem and Singh, 1981; Bender and Orzag, 1978; Bleistein and Handelsman, 1986)
K('>-) =
L:
g(()ei>'f(()d(. (29)In the above expression,
.>-
is a large valued, positive constant. Because.>-
is large, the integrand oscillates rapidly and the contributions to the integral tend to cancel except near the stationary value of f((), the value (0 where / ((0) = 0 (the prime indicates differentiation with respect to (). The leading order asymptotic behavior of the integral is then controlled by contributions from a small region around this stationary point. The desired asymptotic approximation to this equation is[
2 ]1/2 "
K('>-) ~ 1r g(( )eiA!(0)+(i,,-/4)sgn! (0)
.>-1J"((0)1
0
.
(30)(33) The solution will be inaccurate, and the method of stationary phase invalid, if the integrand is not regular (Bleistein and Handelsman, 1986).
An additional simplification can be made by applying the large-argument asymptotic forms for the Hankel functions (Abramowitz and Stegun 1964),
Ha
2)(z)~
f2
e -i(Z-,,-/4)V;-;
H1
2)(z)~
f2
e -i(Z-3,,-/4). (31)V;-;
Substituting equations (31) into equations (18) and (19), and into equations (22 ) and (23), and into equations (26) and (27), show that these far-field streaming current fields are of the form K('>-) suitable for application of the stationary-phase approach. The terms in each integral represent the contribution of shear, fast, and slow waves to the dynamic streaming current components. The stationary phase value k
o
is different for the three wave types. Considering the first term in the integral for the radial component in equation (18), the quantity analogous to i'>-f(() in equation (29 ) is- i [kzz
+
Ir] = iR [kzcos(--y) - / sin(--y)] (32)where z
=
-Rcos(--y) and r=
Rsin(--y). Hence, (=
kz and.>-
=
R.Setting,
df _ () kzsin(')') _
d( - cos ')'
+
w2 .2 1/2 - 0(:w -
kz )and solving for kz gives the stationary wavenumber for the S-waves, kg
=
(-wcos(')')/(3. Similarly, the analogous quantity for the compressional waves are kO" = (-wcos(')')) /0!1and k~2 = (-wcoSh))j"'2' Using these values for the wavenumbers ko and applying
the stationary-phase asymptotic solution in equation (30) gives the following far-field dynamic streaming current fields.
Vertical Point Force on Fluid
Js
=
-W2PEL(W - -)sin(i) [WWr(k(3) -iR"-- (3 "0 e ~+ -
W Wr (k"') -iR-"'-"0 e " Ir 47rR (3 . "'I "1
W Wr (k"2) -iR-"'-]
+-
0:2 ~O e Q"2"'2
J'= W2p L(w)cosh)
[~WZ(k(3)e-iR~
+
~Wz
(k"')e -iR:, z E 47rR (3 (3 0 "'I "1 0W WZ (k"2) -iR-"'-]
+-
0:2 0 e "'2"'2
where
W;
andW;,
with p= (3V "'I V "'2 are defined in equations (20). Explosive Point Source on Solid and FluidJ s= W2PEL()W isin(i) [W Wr (k"') -iR-"'-- " 0 e " I
+
-W Wr (k"2) -iR-"'-]~ e Q'2r 41fR [tl cq Q2 Q;2 0
(34)
(35)
(36)
(37) J sz = _ 2 L( )icos
h )
[~Wz
(k"') -iR::,+
~Wz
(k"2) -iR:2 ]W PE W 4 R 0:1 0 e Q:2 0 e
7r "'I "'2
where for the force applied on the solid
W;
andW;,
with p=
0:1 V0:2 are defined inequations (24) and for the force applied on the fluid
W;
andW;,
with p = 0:1 V "'2 are defined in equations (28). The "W" coefficients are now written with argument ko
to emphasize that they are computed at the appropriate stationary-phase wavenumber. Since there is no low-frequency approximation, the solutions can be used to explore the changes in radiation pattern as the frequency of the source increases. To compute the total radiation pattern of a given source, it is more convenient to reorganize the terms in equations (34), (35), (36) and (37) to express separately the p/ast , Pslow-and S - wave amplitudes. By simple arrangements the following radiation patterns are obtained.
Vertical Point Force
(38)
(40)
where
W;
andW;,
with p=/3
V(>1 V(>2 are defined in equations (20).Explosive Point Source on Solid and Fluid
(41) (42) where for the force applied on the solid
W;
andW;,
withp = (>1 V(>2 are defined inequations (24) and for the force applied on the fluid
W;
andW;,
with p = (>1 V(>2are defined in equations (28).
DYNAMIC STREAMING CURRENTS FROM POINT FORCES
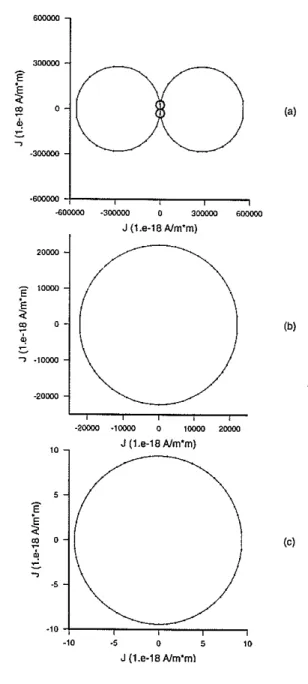
Streaming currents are generated by both compressional and rotational waves. We will discuss these mechanically-induced streaming current responses generated by an unit strength vertical point force, by an explosive point force acting on the solid frame and a volume injection source acting on the fluid.In Figure 8, the stationary-phase radiation patterns at 200 Hz are shown for a vertical point force where equations (38) and (39) are used, and an explosive point source on the solid and a volume injection source where equation (41) is used. The correctness of the stationary-phase solutions were checked against synthetic seismograms computed using the discrete-wavenumber method. This method evaluates the integral expressions by discretizing the integral over the wavenumber using FFT methods to perform the frequency integrals (Bouchon and Aki, 1977).
The streaming current radiation pattern parameters are calculated at a permeability, k = 1O-12m2, salinity, C = 1O-3moljl and a 20 % porosity (see Figure 9). The unit force strength vertical point force induces the largest streaming current magnitudes compared to the other point sources, as shown in Figure 8. The rotational mechanical waves induce in this case approximately 10 times larger streaming currents compared to the streaming currents induced by the compressional waves in a medium with 20% porosity.
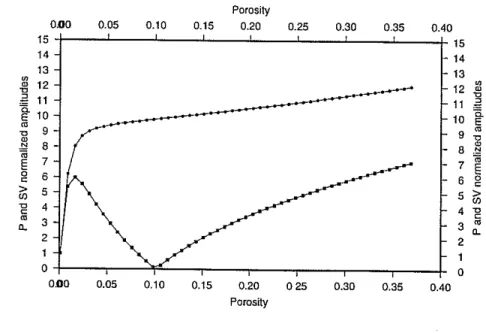
In Figure 9, the P and SV relative flow amplitudes, W$ and W"'l' defined in equa-tions (38) and (39) are shown. The increase in the W$ coefficient is largely due to the decrease in shear frame modulus with increasing porosity (a squishier material). The combined porosity effect on the medium and Biot's moduli result in the more com-plicated W"'l behavior. The relative flow amplitude is zero at exactly zero porosity,
resulting in a zero streaming current amplitude as well. Approaching zero porosity, i.e., the elastic limit, the
W§
andW'"
coefficients become equal in amplitude and are normalized to one in Figure 9. At zero porosity the difference in induced streaming current amplitude is solely due to the difference in P and SV wavefield velocity. For nonzero porosities theW§
andW'"
amplitudes are different from each other. TheP
wave and SV wave-induced streaming current amplitudes are now not only determined by the wavefield velocities but also by the relative flow amplitudes. At a 20% porosity the combined effect of wave type velocity, and
W§/W'"
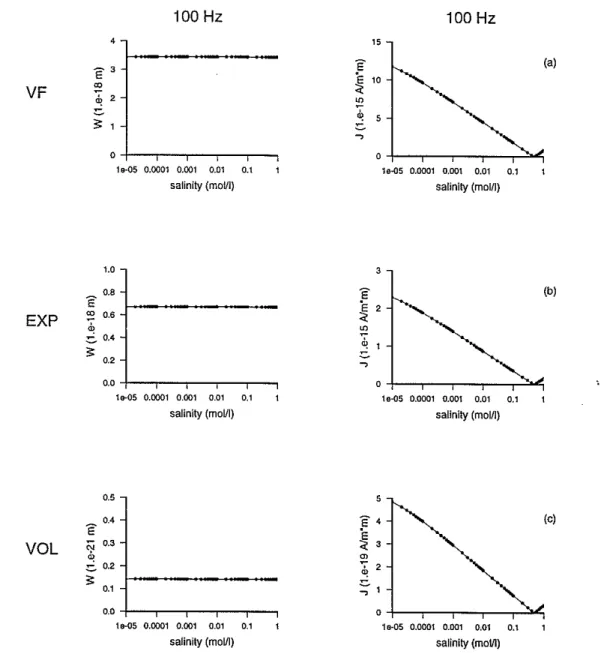
coefficient difference, results in a ten times larger streaming current induced by the rotational waves than by the fast compressional waves.Figures 10, 11 and 12 show the streaming current amplitude behavior with respect to fluid salinity, porosity and permeability, calculated at a 100 Hz center frequency. Figure 13 shows the streaming current amplitude behavior with respect to permeability, calculated at 100kHz center frequency. The rows indicated by a, b, and c in Figures 10, 11, 12 and 13 denote relative flow/streaming currents induced by a vertical point force, an explosive point force acting on the frame, and a volume injection source, respectively. The left column shows the relative flow amplitude behavior versus medium property and the right column shows the streaming current behavior versus medium property. In Figure 14, the S wave-induced relative flow/streaming currents are plotted against salinity (rowa), permeability (rowb),and porosity (rowc), at a 100 Hz center frequency. The maximum relative flow/streaming current amplitudes are plotted in the case of a vertical point force. The amplitudes at frequency 100 Hz are calculated at R = 200 m from the source, while the amplitudes at frequency 100 kHz are calculated at R
=
0.2 m, corresponding to about 6 wavelengths from the source.Streaming Current Behavior with Respect to Salinity
Figure 10 shows the relative flow/streaming current amplitude behavior with respect to changes in fluid salinity for the three point forces. The relative flow amplitudes are constant over five orders of fluid salinity change. This comes as no surprise, since we have neglected the electrically-induced part ofthe relative flow. With decreasing salinity the electrical double layer and the (-potential become larger. Therefore, with decreasing salinity a bigger osmotic drag that opposes the relative flow is expected. The streaming current decreases with increasing salinity. This is consistent with the decrease of the diffuse double layer thickness and the decrease of the zeta potential. At a salinity of
C = 0.5 mol/I, the (-potential changes sign, [see equation (8)], whose effect on the
streaming currents can be observed in Figure 10.
Streaming Current Behavior with Respect to Porosity
Figure 11 shows the relative flow/streaming current behavior with respect to changes in porosity for the different point sources. The P and SV wavefield velocities change with porosity and therefore scale the streaming current amplitudes accordingly. In the
elastic limit (zero porosity), both the relative flow and streaming current are zero. The local minimum response at 10% porosity is a combined effect of the bulk moduli of the solid and fluid phase and the frame bulk and shear modulus. A smaller bulk modulus of the solid phase and a smaller frame bulk and shear moduli shift the minimum to a bigger porosity. A monotonic increase of the relative flow with increasing porosity is obtained when the pore space is saturated with a very compressible fluid (i.e., a gas). The streaming current trends with increasing porosity are similar for all calculated source types and show a corresponding functional shape with the relative flow curves. Streaming Current Behavior with Respect to Permeability
Figures 12 and 13 show the streaming current behavior with respect to changes in permeability for three different sources are at a 100 Hz and 100 kHz source center frequency. The streaming current behavior with respect to permeability is different when induced by a force applied on the solid or induced by a source applied on the fluid. In Figure 12, a transition frequency ofw, = 100 Hz corresponds to a permeability of 10-9 m2 when the porosity
=
20 %, viscosity=
10-3 Pas and PI=
10-3 kgjm3 arethe other medium properties [see equation (5 )]. All curves in Figure 12 are in the viscous-dominated flow regime.
In Figure 13 however, a transition frequency of
w,
=
100 kHz corresponds to a per-meability of 10-13 m2. We distinguish two flow type regimes-a viscous flow-dominatedregime for permeabilities less than 10-13m2 and an inertial flow regime for
permeabil-ities larger than 10-13 m2• Above the transition frequency in the inertial flow regime,
the L(w)jk(w) ratio decreases with increasing permeability, since the permeability de-creases as w while L decrease·) as wl / 2 . This results in a drop-off in streaming current for permeabilities larger than 10-13 m2 in Figure 13.
The decrease in streaming current at the permeabilities corresponding to the viscous flow regime causes a decrease of the L(w)jk(w) ratio (k(w) increase is stronger than the increase in L(w)) with decreasing permeability, as shown in Figures 4 and 5.
Streaming Current Sheet Behavior with Respect to Salinity, Perme-ability and Porosity
In Figure 14, we show the relative flow and streaming current responses induced by S waves generated by a vertical point force at a 100 Hz center frequency. Shear waves are divergence-free and cannot induce relative fluid motion due to pressure gradients, as within a P wave, but can induce relative fluid flow due to grain accelerations. Therefore, both P and S waves generate streaming currents. The relative flow and streaming currents are larger when induced by the S waves than the P waves since they depend on the factors
1jv;
and 1jv~,respectively.The relative flow and streaming current behavior forS waves is similar to its response for P waves. The streaming current response versus permeability shows a local mini-mum at 10-11
<
k<
la-10m2,but will fall off at permeabilities larger thank = la-9m2 •The relative flow and streaming current behavior versus porosity is different from its response for P waves, as shown in Figure 11. The relative flow increases with increas-ing porosity. Its increase is largely due to the decrease in shear frame modulus with increasing porosity.
DISCUSSION AND CONCLUSIONS
In this section, we summarize the results of this study. The dynamic streaming current analysis is simplified by decoupling the mechanically- and electrically-induced parts. The electrically-induced streaming current is shown to be second-order in electrokinetic coupling coefficient and is neglected. We have used Biot theory to calculate the amount of induced relative flow by the Green's function solution.
The sensitivities of the dynamic transport coefficients, 0-(w), k(w) and L(w), to porosity and dc permeability are determined. The conductivity decreases with increas-ing permeability. When the pore length parameter becomes comparable to the grain surface conductances, the surface conductances become more important than the fluid phase conductivity. This occurs when the pore space is filled with clays which don't decrease the porosity much but greatly enhance the conduction along the pore surfaces. The streaming current amplitude variability is calculated versus fluid salinity, poros-ity, and permeability induced by P and S waves generated by three different point sources. Streaming currents are induced both by P waves, through pressure gradi-ents, and divergence-free S waves, through grain accelerations. The streaming current decreases with increasing salinity. This is consistent with the decrease of the diffuse double-layer thickness and a decrease of the (-potential. The streaming current re-sponse versus porosity induced by the P waves differs from the response induced by the S waves. The porosity affects the bulk moduli of the solid. Its effect, combined with the framc bulk modulus and the compressibility of the saturating fluid, determines the streaming current amplitude induced by a P wave versus porosity. The increase in streaming current amplitude induced by S waves with increasing porosity is due to the decrease of the shear frame modulus with increasing porosity. The streaming current with respect to the dc permeability response differs for sources applied to the elastic frame and volume injection sources. The L(w)jk(w) amplitude with respect to per-meability above and below the transition frequency determines the streaming current behavior with respect to permeability.
The numerical results can be used to design an experiment to measure dynamic streaming currents generated by transducers or volume injection sources. Experimental data analyzed with the stationary-phase radiation approach allows quick computation of the streaming currents as a function of the transport and fluid chemistry parameters. In addition, no frequency restrictions are required for this approach, making the method useful for investigating the amplitude variability at different source center frequencies (above and below the transition frequency). The advantage of measuring streaming currents is one does not need to know the value of the (surface) conductance if one
wants to determine the (-potential. Since a dynamical measurement is made, electrode polarization might be less of a problem.
ACKNOWLEDGMENTS
This work was supported by the Department of Energy, under grant number DE-FG02-93ER14322 and by the MIT/ERL Borehole Acoustics Logging Consortium. We thank Dr. R. L. Gibson, Jr. for a critical reading of the manuscript and for his helpful dis-cussions regarding the stationary-phase radiation patterns. We are greatful for helpful discussions with Prof. S. Pride and Dr. Z. Zhu.
REFERENCES
Abramowitz, M. and 1. Stegun, Handbook of Mathematical Functions with Formulas, Graphs and Mathematical Tables, Dover Pub. Inc., 1964.
Anderson, J. and W. Koh, Electrokinetic parameters for capillaries of different geome-tries, Journal of Colloid and Interface Science, 59, 149-158, 1977.
Anderson, P., The relation of the electrokinetic potential to adsorption at the oil/water interface, Trans. Faraday Soc., 55, 1421-1429, 1959.
Ben-Menahem, A. and S. J. Singh, Seismic Waves and Sources, Springer-Verlag New York Inc., New York, 1981.
Bender, C. and S. Orzag, Advanced Mathematical Methods for Scientists and En9ineers, McGraw Hill Book Co., 1978.
Biot, M., Generalized theory of acoustic propagation in porous dissipative media, Jour-nal of the Acoustical Society of America, 34, 1254-1264, 1962.
Biot, M., Mechanics of deformation and acoustic propagation in porous media, Journal of Applied Physics, 33, 1482-1498, 1962.
Bleistein, N. and R Handelsman, Asymptotic Expansions of Integrals, Dover Publica-tions, Inc., 1986.
Bockris, J. and A. K. N. Reddy, Modern Electrochemistry, Vol. 2, Plenum Press, 1970. Bouchon, M. and K. Aki, Discrete-wavenumber representation of seismic source
wave-fields, Bull. Seis. Soc. Am., 67, 259-277, 1977.
Broz, Z. and N. Epstein, Electrokinetic flow through porous media composed of fine cylindrical capillaries, Journal of Colloid and Interface Science, 56, 605-612, 1976. Cerda, C. and K. Non-Chom, The use of sinusoidal streaming flow measurements to de-termine the electrokinetic properties of porous media, Colloids and Surfaces, pp. 7-15, 1989.
Chandler, Rand D. Johnson, The equivalence of quasistatic flow in fluid-saturated porous media and Biot's slow wave in the limit of zero frequency, Journal of Applied Physics, 52, 3391-3395, 1981.
Chandler, R, Transient streaming potential measurements on fluid-saturated porous structures: An experimental verification of Biot's slow wave in the quasi-static limit, Journal of the Acoustical Society of America, 70, 116-121, 1981.
Derjaguin, B., N. Churaev, and V. Muller, Surface Forces, Consultant Bureau, 1987. Donath, E. and A. Voigt, Streaming current and streaming potential on structured
surfaces, Journal of Colloid and Interface Science, 109, 122-139, 1986.
Dukhin, S. and B. V. Derjaguin, Surface and Colloid Science, 7, Wiley-Interscience, New York, 1974.
Fuerstenau, D. and H. Modi, Streaming potentials of corundum in aqueous organic electrolyte solutions, Journal of the Electrochemical Society, 106, 336-341, 1959. Gaudin, A. and D. Fuerstenau, Quartz flotation with anionic collectors, Trans. AIME,
66-72, 1955.
Grahame, D., The electrical double layer and the theory of electrocapillarity, Chem. Rev., 41, 441-510, 1947.
Groot, S. D. and P. Mazur, Non-Equilibrium Thermodynamics, Dover, New York, 1984. Groves, J. and A. Sears, Alternating streaming current measurements, Journal of
Col-loid and Interface Science, 53, 83-89, 1975.
Haartsen, M., W. Dong, and M. Toksiiz, Electroseismic waves in layered media using dynamic green's functions (submitted), Geophysical Journal International, 1996. Hidalgo-Alvarez, R., F. D. L. Nieves, and G. Pardo, Comparative sedimentation and
streaming potential studies for ( potential determination, Journal of Colloid and Interface Science, 107, 295-300, 1985.
Hurd, R. and N. Hackerman, Electrokinetic potentials of bulk materials by streaming current measurements, Journal of the Electrochemical Society, 102, 594-597, 1955. Ishido, T. and M. Mizutani, Experimental and theoretical basis of electrokinetic phe-nomena in rock-water systems and its applications to geophysics, J. Geophys. Res., 1763-1775,1981.
Jin, M. and M. M. Sharma, A model for electrochemical and electrokinetic coupling in inhomogeneous porous media, Journal of Colloid and Interface Science, 142,61-73, 1991.
Johnson, D., J. Koplik, and R. Dashen, Theory of dynamic permeability and tortuosity in fluid-saturated porous media, Journal of Fluid Mechanics, 379-432, 1987. Jouniaux, 1. and J. Pozzi, Streaming potential and permeability of saturated
sand-stones under triaxial stress: Consequences for electrotelluric anomalies prior to earthquakes, J. Geophys. Res., 100, 10197-10209, 1995.
Kuo, J., M. Sharma, and T. Yen, Electrokinetic behavior of a porous composite oxide matrix, Journal of Colloid and Interface Science, 126, 537, 1988.
Kurtz, R., A. K. E. Findl, and L. Stromo, Turbulent flow streaming potentials in large bore tubing, Journal of Colloid and Interface Science, 57, 28-39, 1976.
Levine, S., J. Marriott, G. Neale, and N. Epstein, Theory of electrokinetic flow in fine cylindrical capillaries at high zeta potentials, Journal of Colloid and Interface
Science, 52, 136-149, 1975.
Manzanares, J. A., M. Salvador, and P. Ramirez, Pore conductivity and streaming potential in charged capillary tubes with concentration dependent pore wall charge,
Morgan, F. D., E. R. Williams, and T. R. Madden, Streaming potential properties of Westerly granite with applications, J. Geophys. Res., 12449-12461, 1989.
Neev, J. and F. R. Yeatts, Electrokinetic effects in fluid-saturated poroelastic media, Physical Review B, 40, 1989.
Onsager, 1., Reciprocal relations in irreversible processes i, Phys. Rev., 37, 405, 1931. Onsager, L., Reciprocal relations in irreversible processes ii, Phys. Rev., 38, 2265, 1931. Overbeek, J. and H. K. (Editor), Colloid Science; Irreversible systems, Vol. I, Elsevier,
New York, 1952.
Packard, R., Streaming potentials across glass capillaries for sinusoidal pressure, J.
Chem. Phys., 21, 203, 1952.
Pride, S. R. and F. D. Morgan, Electrokinetic dissipation induced by seismic waves, Geophysics, 56, 914-925, 1991.
Pride, S. R., F. D. Morgan, and A. F. Gangi, Drag forces of porous-medium acoustics, Physical Review B, 47, 4964-4978, 1993.
Pride, S., Governing equations for the coupled electromagnetics and acoustics of porous media, Phys. Rev. B, 50, 15678-15696, 1994.
Rutgers, A., M. D. Smet, and G. D. Meyer, Influence of turbulence upon electrokinetic phenomena, Trans. Faraday Society, 53, 393-396, 1957.
Rutgers, A., M. D. Smet, and W. Rigole, Streaming currents with nonaqueous solutions, Journal of Colloid Science, 14, 330-337, 1959.
Schriever, W. and C. Bleil, Streaming potential in spherical-grain sands, Journal of the Electrochemical Society, 104,170-176,1957.
Sears, A. and J. Groves, The use of oscillating laminar flow streaming potential mea-surements to determine the zeta potential of a capillary surface, Journal of Colloid
and Interface Science, 65, 479-482, 1978.
Sharma, M., J. F. Kuo, and T. F. Yen, Further investigation of the surface charge properties of oxide surfaces in oil-bearing sands and sandstones, Journal of Colloid and Interface Science, 115, 9-16, 1987.
Sharma, M., Streaming potentials in inhomogeneous packed beds, Chem. Eng. Sci., 43, 1203-1206, 1988.
Sidorova, M., M. Fazylova, and D. Fridrikhsberg, Electrokinetic studies of some model systems: quartz-electrolyte solutions in Wolfram, Proc. Inter. Conf. Colloid Surf. Sci., Elsevier Science Pub. Co., 1975.
Stern, 0., Ziir theorie der electrolytischen doppelschicht, Z. Electrochem., 30, 508-516, 1924.
Wurmstich, B. and F. Morgan, Modeling of streaming potential responses caused by oil well pumping, Geophysics, 59, 46-56, 1994.
APPENDIX
DYNAMIC RELATIVE FLOW GREEN'S FUNCTIONS IN
PORO-ELASTIC MEDIA
To obtain the relative flow vector generated by vertical and explosive (volume injection) point forces, the relative flow Green's function solutions for a point source applied to either the frame or the pore fluid are used. Substitution of this relative flow vector into the mechanical streaming current equation (14) yields the dynamic streaming current components. The relative flow Green's functions are derived in Haartsen et al. (1996). Relative Flow Green's Function with the Source on the Frame
= gW
I
+
[~(HM
- C2) - oPE] 'i7'i7<I> - C PI [ HM2
C 2PBPE2
2]
* - - w PI+
w - - - Hw PE - Mw PB 'i7'i7<I> C PI (A-I)where the superscript w denotes the Greens's function to be a relative flow Green's function and the subscript s denotes the point force applied to the solid matrix.
(A-2) (A-3) a [H M - C2] !'.E. (k2 _ k2) (k2 _ k2 ) PI cd f3 cd 02 1 -k;2C+w2PI B(ws) =
with the introduced variablesB(ws), A1(WS), A2(ws), where(ws) denotes scalar Green's function amplitudes belonging to the relative flow Green's function with a source applied on the solid frame defined as,
1 -k~C+w2PI
a [HM - C2j
~ (k~
- k;1)(k~
- k;2)1 -k;1C+w2PI
<I>* is defined as,
<I>* = B*(ws)g(3
+
Ai(wS)g"1+
A2(wS)g.,2 with the variables B*(ws), Ai(ws), A2(ws) defined as,(A-4) B*(ws) _ B(ws) -w2p!-Ck~'A*( ) _ A1(WS) * A 2(ws) 1 WS - 2 Ck2' A 2(ws)
=
2 Ck2 w PI- " 1 w PI - .,2 (A-5) 8-21The relative flow scalar shear Green's function is given by,
p eikoR
gW(x,x') =
_---.L__
(A-6)PE 47rGR
where R = J(x - x')Z
+
(y - y')Z+
(z - z')Z is the distance from the source to the receiver and ko
=
wjJ
Gj(pB -*)
is the wave number.Relative Flow Green's Function with the Source on the
Fluid
Gj
=
'VII', II'=
A1ge'!+
Az
g"'2 where, (A-7) (A-g) (A-8) (A-ll) (A-12) (A-lO) Al = [HGwzPE(k~,k~
-k~,)
+W4pEPBG(k~,
-k~)]
Ailwf)A
z
= [HGwzPE(k~2k~
-k~2)
+W4pEPBG(k~2
-k~)]
A2(wf) A1(wf) C (WZPB - k&l H) (WZPB - k&l G) Az(wf) A2(wf)=
(WZPB - k&,H) (WZpB - k&l G)with the introduced variables A1(wf), Az(wf), where (wf) denotes scalar Green's func-tion amplitudes belonging to the relative flow Green's funcfunc-tion with a source applied on the fluid phase defined as,
A
f _
1 (WZpB - k~,H)(wZpB - k~,G) l(W ) - GWZpE [HM - CZ] (kZ _ kZ) (kZ _ kZ ) 0::1 {3 cq 02 Af
1 (WZpB - k~2H) (WZpB - k~2G) z(w )= GWZPE [HM - CZj (kZ _ kZ) (kZ _ kZ ) 0::2 f3 0:2 0:1The following variables have been used in the relative flow Green's function description:
I
denotes the identity matrix, PB is the bulk density and is defined as the sum of thephase volume weighted fluid and solid densities, Pf is the fluid density, pE[kgjm3]
=
iWk(w)
with 1] the fluid viscosity and k(w) the frequency dependent permeability, andk"", k"'2 and kfJ are the fast, slow and shear wavenumbers, respectively.
The H, M, C and G moduli describe the stress-strain behavior of the two phases and are related by the following equations.
KG
=
H _ ~G=
KfT+
¢KfT+
(1 - ¢)Ksc:. 3 1+c:. Kf+
Ksc:. 1+
c:.M
="!:--.!5L
¢1+c:.where the parameter L:l. is defined as,
(A-I3) The moduliJ(jr and Gjr are the bulk and shear moduli of the framework of the grains,
when the fluid is absent. The frame moduli may either be considered experimentally determined or may be obtained from approximate theoretical models for specific pore grain geometries. C and M are the incompressibilities used by Biot (I962,a,b). They are complex and frequency dependent, allowing for losses in addition to those associated with relative flow.
The Quartz
I
Electrolyte Interface
e
10 angstroms( )
diffuse compact
1 Molar electrolyte, pH
=
7, T=
298 K.Figure 1: The Quartz/electrolyte interface according to Stern (1924). In the compact layer the electrolyte ions and structured water dipole molecules are electrostatically and chemically adsorbed to the surface of the solid. Beyond the compact layer of bound ions there is a diffuse distribution of mobile ions whose position is determined by Poisson-Boltzman statistics. The potential at the separation plane between the mobile and immobile charge is called the (-potential.
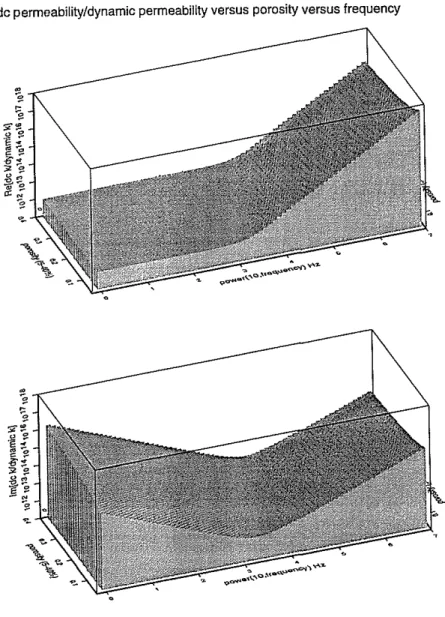
dc permeability/dynamic permeability versus porosity versus frequency
Figure 2: Dependence of the ratio of dc permeability to dynamic permeability on poros-ity and frequency. Top: the real part. Bottom: the imaginary part.
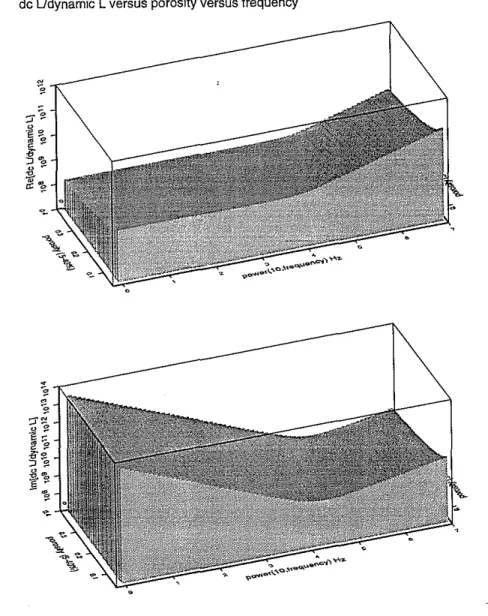
dc Udynamic L versus porosity versus frequency
Figure 3: Dependence of the ratio of dc electrokinetic coupling coefficient to dynamic electrokinetic coupling coefficient on porosity and frequency. Top: the real part. Bottom: the imaginary part.
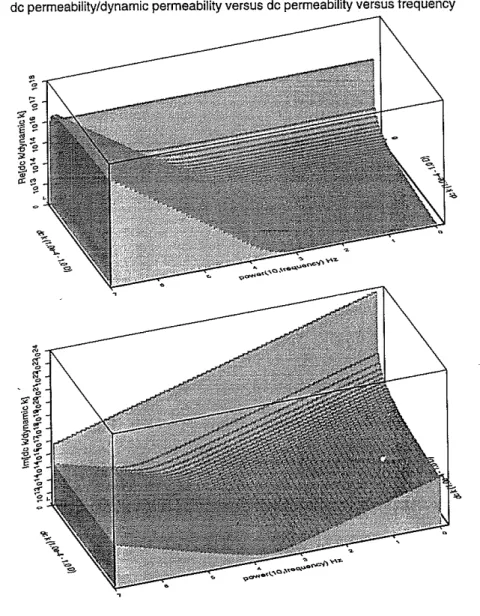
dc permeability/dynamic permeability versus dc permeability versus frequency
Figure 4: Dependence of the ratio of dc permeability to dynamic permeability on per-meability and frequency. Top: the real part. Bottom: the imaginary part.
de Udynamic L versus de permeability versus frequency
Figure 5: Dependence of the ratio of dc electrokinetic coupling coefficient to dynamic electrokinetic coupling coefficient ratio on permeability and frequency. Top: the real part. Bottom: the imaginary part.
0.001 0.0001
~
(J) 1e-05 0.40 0.35 0.30 0.15 0.20 0.25 Porosity 0.10 0.05 1.-06+--,---,--.,--.,---,---,--.,--.,
0.00Figure 6: Conductivity versus porosity in a porous medium with k
=
1O-12m2 and C=
1O-3mol/l. The conductivity doesn't change linearly with porosity due to the porosity dependence of the pore length parameter, A[m].0.050 0.045 0.040 0.035
~
:::::
en 0.020 0.015 0.010 0.005O'OOO-!---,,---r-.:;=::::::,P=r==F=F==r==F-r---1e-20 1e-19 1e-18 1e-17 1e-16 le-15 1e·14 1e-13 1e-12 1e-11 le-10
DC Permeability [m'm]
Figure 7: Conductivity versus permeability in a porous medium with</>= 20% and C =
1O-3mol/1. At k o
<
1O-16m2 the pore length parameter A[m] becomes comparable to the sum of the grain surface conductances. Physically this situation occurs when the pore space is filled with clays, which do not decrease the porosity but greatly . enhance the surface to pore volume ratio and therefore enhance the conduction along60ססoo 30ססoo o -30ססoo (a) 30ססoo 60ססoo -60ססoo
+---,---,__-,__..,
-60ססoo ·30ססoo 20000 E 10000~
o Ib) ..., ·1ססoo -20000 to -5-2ססOO ·1ססoo 0 1ססoo 2ססoo
J (1.e-18 Afm"m) Ie) to -5 0 5 J {1.e-18 AJm'ml -to
+---,-...:::::::::;;:::::::::....,.-_----,
-toFigure 8: Streaming current radiation patterns for different unit strength seismic sources calculated at a 200 Hz center frequency. (a) vertical point force; (b) an explosive point force acting on the solid frame; (c) volume injection source.
Porosity ODD 0.05 0.10 0.15 0.20 0.25 0.30 0.35 DAD 15 15 14 14 13 13 ~ ID 12 12 ~
"
ID ~ 11 11"
.oJg.
10 10 '5.. rn E"
ID 9 9 rn"
N 8 8 ID ~.,
E 7 7"
0 6 E c 6 0 c > 5 5 > (f)"
c 4 4 (f)"
rn 3 c 0- 3 0-rn 2 2 1 1 0 0 ODD 0.05 0.10 0.15 0.20 025 0.30 0.35 0.40 PorosityFigure 9: Relative fluid-solid motion generated by P (line with circles) and S (line with squares) waves as a function of porosity. The relative flow amplitude generated by the P-waves are affected by the porosity effect on the bulk and frame moduli of the solid and the compressibility of the saturating fluid. The increase in relative fluid-solid motion generated by S-waves with increasing porosity is due to the decrease of the shear frame modulus with increasing porosity.
100 Hz 100 Hz 4 15
E'
E
(a)~
"
VF
'"
~ 2"'
'"
~ 5 ;: ~ 0 0 19-05 0.0001 O.l)Ol 0.01 0.1 1e'()5 0.0001 0.001 0.Q1 0.1salinity (molll) salinity (mallJ)
(b) 10-05 0.0001 0.001 0.Q1 0.1 salinity (mol/I)
,
0.0+-,--,,----,--...,--, 10-05 O.clOOl 0.001 0.01 0.1 salinity (mol/I) 1.0 0.8 E e;! 0.6 d> 6 0.4 ;: 0.2EXP
0+--..-,--,,----,-"....,
1a-OS 0.0001 0.001 0.Q1 0.1 salinity (molll) VOL 0.5 0.4 E N O.3 d> .6 0.2 ;: 0.1 0.0+-,--,--,--...,--, 1e-05 0.0001 0.001 0.01 0.1 salinity (mol/I) 5E4
E ~,
m ~ 2 (e)Figure 10: Relative flow (left column) and streaming current density (right column) dependence on salinity, induced by P waves generated by (a) vertical point force, (b) explosive point force acting on the frame and (c) volume injection source at a 100 Hz center frequency.
100 Hz 100 Hz o
+"''''''''''''''--,--.--,----,
0.0 0.1 0.2 0.3 0.4 0.5 porosityVF
10 8 E ~ 6"
:6 4 2 0.1 0.2 0.3 0.4 0.5 porosity 40 E 30~
<020 ~=-
10 ~ (a) 2.0 -10 E 1.5/
E 8 (b) <0 'EEXP
~ 1.0 ;;: 6 <0.,
4 ;:: 0.5 ~ ~ 2 0.0 0 0.0 0.' 0.2 0.3 0.4 0.5 0.' 0.' 0.2 0.3 0.4 0.5 porosity porosity VOL 0.0 0.1 0.2 0.3 0.4 0.5 porosity (e) o-1-"-...:::.,--,--,--, 0.0 0.1 0.2 0.3 0.4 0.5 porosityFigure 11: Relative flow (left column) and streaming current density (right .column) dependence on porosity, induced by P waves generated by (a) vertical point force, (b) explosive point force acting on the frame and (c) volume injection source at a 100 Hz center frequency.
100 Hz 100 Hz 150 10 E 100 E 8 (a)
~
VF
'"
6"
m C 50"
4 ;: C ~ 2 0 0la-16 10·15 1e-14 10-13 10-12 to-l1 10-161.,510-141.'310-121o_n
permeability (m*m) permeability (m*m)
EXP
VOL 30 E 20'"
"
:=.. 10 ;:-o+-"-,.-...,..-"'"'1:::-,--_
le-16 10-15 1.14 10-13 1e-12 10·11 permeability (m*m) 30 E 20 ~•
:=.. 10 ;: o+-,...,r--..,-..,.-4-10-16 1G-15 10-14 10-13 1e-12 10-1' permeability (m*m) 1.5 E 'E 1.0 ;;: m
"
0.5 ~ 0.0 +---,r--,--r--,--,.--10·1610-1510-14 'e-13 10-12 10-11 permeability (m*m) 1.5f:
~ 1.0 "-~ 0.5 0.0+....,-.,...,.-'f",.-10-16 'e-15 10-14 le-13 10-12 le-l1 permeability (m*m)
(b)
(e)
Figure 12: Relative flow (left column) and streaming current density (right column) dependence on permeability, induced by P waves generated by (a) vertical point force, (b) explosive point force acting on the frame and (c) volume injection source at a 100 Hz center frequency.
100 kHz 100 kHz 2.0 1.0 E 1.5 E (a)
VF
::? E ~ 1.0 <: 0.5 '(> ;: 0.5 "-~ ~ 0.0 0.0le-16 le-15 1&-14 le-13 1e-12 le-l1 10-1610-15 le-14 1e-13 10·12 le-l1
permeability (m*m) permeability (m*m) 150 300
r-E E (b) ~ 'E 100
EXP
200 <: ~ '(> "- ~ ;: 100 so ~ 0 010-1610-1510-14 1e-13 1e-12 le·l1 le-16 le-15 le-14 10-13 10-12 le·"
permeability(mOm) permeability (m*rn)
0.0+~F"'-...,...-r---,--.-""::
10-1610-15 le-14 la-13 10·12 le-l1 permeability (m*m) VOL 4
E
3 ~ d; 2 ;:, o+--,...-4--r--r---r-le-16 10-15 10-14 1e-13 10-12 le·l1 permeability (mOm) 1.5 E ~ 1.0 ~ 0.5 (e)
Figure 13: Relative flow (left column) and streaming current density (right column) dependence on permeability, induced by P waves generated by (a) vertical point force, (b) explosive point force acting on the frame and (c) volume injection source at a 100 kHz center frequency.
100 Hz 100 Hz 15
,
E (a) E "E 10VF
c:
3 . ~..
'"
62..
;: ::: , 0 0 1.,.05 0.0001 0.001 0,01 0.1 10-05 0.0001 0.001 am 0.1salinity (mol/I) salinIty (molll)
VF
150E
100"-..
~ 50 o+-,-.,...-,...-.",!,'-,--1e-1610·151e-1410·131e-1210-11 permeability (m*m) le-16 10-15 10-14 10-13 10-12 10-11 permeability (m*m) 5 20,
E (c) E~
15VF
~ 3..
;! 10 :::2..
;:,
5 0 0 0.0 0.1 0.2 0.3 0.4 0.5 0.0 0.1 0.2 0.3 0.' 0.5 porosity porosityFigure 14: Relative flow (left column) and streaming current density sheets (right col-umn) induced by S waves generated by a vertical point force as function of (a) salinity, (b) permeability and (c) porosity at a 100 Hz center frequency.