THE DYNAMICS OF MANUFACTURING JOB LOSS: A CASE STUDY OF RHODE ISLAND, 1978-83
by
ANDREW DAVID REAMER
B.S., Economics, University of Pennsylvania (1971) M.C.P., Massachusetts Institute of Technology (1981)
Submitted to the Department of Urban Studies and Planning in Partial Fulfillment of the
Requirements of the Degree of Doctor of Philosophy
at the
Massachusetts Institute of Technology May 1987
@Andrew D. Reamer 1987
Signature of Auto
Department of Urban Studies and Planning
Certified by
Accepted by
Bennett Harrison Professor, Political Economy Thesis Supervisor " I -'-MASSACHUSETTS INSTITUTE OF TECHNOLOGY
JUN 0 8 1987
Langley C. Keyes, Jr. Chairman, Ph.D. Committee \ % N r -.
\/tTHE DYNAMICS OF MANUFACTURING JOB LOSS: A CASE STUDY OF RHODE ISLAND, 1978-83
by
ANDREW DAVID REAMER
Submitted to the Department of Urban Studies and Planning in Partial Fulfillment of the Requirements of the Degree of
Doctor of Philosophy Abstract
The thesis is concerned with gaining understanding of the dynamics of job loss in the U.S. manufacturing sector through analyzing the magnitude of and reasons for employment change in Rhode Island industry between 1978 and 1983. It is posited that a lack of understanding regarding these dynamics hinders the development of effective regional economic development policies. The data base for the study was formed using ES-202 establishment data, a telephone survey, secondary sources and personal inter-views. The data base covers all 583 manufacturing establishments in the state which had 50 or more employees in at least one year between 1977 and 1983.
The analysis of the components of employment change at the plant level indi-cates that plant contractions are the primary source of gross job loss; that a significant portion of jobs lost to contractions are regained the next year; and that plant closings contribute substantially to job loss, and increasingly as economic conditions worsen. A comparison of the findings of the gross flows analysis in this study with others in the field indicates that the latter were seriously flawed because data bases were not truly longitudinal.
A combination of logit regression models and qualitative analysis indicates that a strong and complex set of relationships exists between plant organizational character-istics and the frequency of plant closure. Some organizational characteristics reflect firms' abilities to avoid management error that results in unintended plant closures and to perceive and opportunities; others guide firms' perceptions regarding viable options for plant site and product investment. Plant closures of four types occur--firm fail-ures, product terminations, capacity reductions, and factor cost relocations. It is sug-gested that plant closures are the results of institutional responses to structural and macroeconomic opportunities and constraints. Structural and macroeconomic op-portunities and constraints strongly influence the range of investment choices which a firm perceives before it.
There appears to be little relationship between organizational characteristics and contractions and expansions in open plants. An analysis of the relationship between plant operating characteristics and employment change, using U.S. Census Bureau data, could not be completed because of significant spurious plant closures in the file.
The study findings have a number of implications for economic development re-search and policy.
TABLE OF CONTENTS Acknowledgements Chapter 1: Chapter 2: Chapter 3: Chapter 4: Chapter 5: Chapter 6: Chapter 7: References Introduction
Overview of the Rhode Island Manufacturing Sector
Analysis of Gross Job Flows, Rhode Island,
1978-83
The Relationship Between Plant Closings and Organizational Characteristics
The Relationship Between Plant Employment Change and Organizational Characteristics
An Assessment of the Usefulness of the U.S. Census Bureau's Longitudinal Establishment Data File for Analysis of Plant Closures
Summary of Findings and Implications for Economic Development Research and Policy
4 7 25 49 79 154 161 175 194
ACKNOWLEDGEMENTS
The path to the completion of this thesis was a far stranger journey than I ever could have imagined when I began it. Along the way, numerous people provided help-ing hands and minds to move me on my way. Without Ira Magaziner and Mary Hack-ett, this project simply could not have been. Ira gave me the latitude and responsibility for carrying out the plant closure study for the Rhode Island Strategic Development Commission, an effort which served as the first stage of research for this thesis. Ira opened many doors to ensure I had adequate information on closed plants. In the proc-ess of working with and for him, I learned enough about economic development analy-sis to give me some sense of professional confidence.
Mary Hackett, the former director of the Rhode Island Department of Employ-ment Security, allowed me access to needed data. I hope the results of this work justi-fy the trust she showed demonstrated.
It has been a privilege to work with Bennett Harrison, my thesis adviser. Ben-nett has played a major role in shaping my thinking about economic development in general and about the structure, methodology, and findings of this thesis in particular. Edward Kaplan was my statistical guru in this research effort. I appreciate his volunteering for the role and the clarity and patience which with he provided guid-ance.
The degree of completeness of the Rhode Island plant data base is due in large measure to the efforts of Bryan Wyatt, who headed up the telephone survey. I will be forever grateful to Bryan for his diligence, commitment, creativity and enthusiasm in tracking down lost owners, untangling corporate hierarchies, and in making one call after another in an effort to get the answers.
To my partners at Mt. Auburn Associates, Beth Siegel and Peter Kwass, I give thanks for their long-term patience and periodic motivational talks as I moved towards
finishing this document. Their allowing me to use the facilities for my thesis made a this project a little easier.
Some seed capital, as it were, for this project was provided by the fellowship program of the MIT-Harvard Joint Center for Urban Studies. The good people at the Research and Technical Assistance Division of the U.S. Economic Development Admin-istration funded a proposal from Mt. Auburn Associates to carry out a part of the anal-ysis for this project, which allowed me to stay financially solvent as I carried on.
Numerous people on the Greenhouse project assisted me in my initial research efforts, including Tracy Fitzpatrick, Kay Scheidler, Gwen Hall, and the clipping file staff at the Providence Journal. Bob Bechtold of the U.S. Census Bureau's Center for Economic Studies spent a year in good humor with me as we puzzled out the intricacies of an analysis that ultimately was not to be. Between George Nee and Joseph Shantz, the Rhode Island AFL-CIO office provided me with help and information throughout the project. Mona Hochberg and Josephina Bosch were helpful in carrying out the phone survey. I am grateful to Robert McKersie for serving as the third member of my committee. I hope we have a chance to work together again.
The emotional support of my friends and family were crucial in my seeing through this project to its completion. In particular I thank Paula Dickerman, Vince O'Donnell, Drew Bottaro, Arne Abramson, Rick Reamer and Deborah Siegel, the folks at 8 Lee St., and the Urban Guerrillas, who continually reacquaint me with the feeling of playing with winners.
CHAPTER 1 INTRODUCTION
Plant Closings and Contractions in U.S. Manufacturing -- Restructuring and Its Effects
Since the late 1970's, the U.S. manufacturing sector has been undergoing a restructuring with negative effects for workers and their communities unparalleled since the Depression.' The result has been the permanent dislocation of millions of workers from decent jobs, with consequent negative effects on these individuals, their families and their communities. Employment in the U.S. manufacturing sector has decreased every year since 1979, except for 1984. Compared to peak employment o~f 21 million workers in 1979, the total number of workers was down 9% (to 19.2 million) in
1986. The decline in production employment has been even steeper--14%. (See Figure 1.1.) The employment figures are barely 4% higher today than they were in 1983, at the bottom of the worst recession in the postwar period.
Change in aggregate employment statistic3 gives a sense of net em!oynpent decline. The gross job loss in manufacturing is of course greater. The U.S. Bureau of Labor Statistics estimates that between 1981 and 1986, over 2.5 million manufacturing workers with 3 or more years job tenure were laid off from their jobs.2 In a previous BLS survey, covering the years 1979-84, it was estimated, disregarding length of job tenure, that 4.25 million manufacturing workers were displaced.3 Though manufactur-ing provided less than 20% of the nation's jobs, 50% of all displaced workers came from the manufacturing sector.
Job displacement has not been evenly distributed across all manufacturing in-dustries. Since the late 1970's, the primary metals, machinery, fabricated metals, tex-tiles, and apparel industries each has lost over 200,000 net jobs. The leather goods,
pri-Figure 1.1
U.S.
Manufacturing Employment
19 -85
69 70 71 72 73 74 75 76 77 78 79 80 81 82 83 84 85 86
+ PhoxdLuctrin 0 Nan-praduction
Source:
U.S. Bureau of Labor Statistics
0 18 - 147-12 -11 -10 - 9- 8- 7-0 All I
mary metals and textiles industries each has lost 25% or more net employment. The ap-parel, motor vehicles, and stone, clay and glass industries also have lost significant numbers of workers.4
This downsizing and restructuring of the manufacturing sector has had a nega-tive effect on relanega-tive wage scales--many lost jobs paid quite well and much of what manufacturing job growth has taken place has been in lower-wage sectors such as elec-tronic components and plastics. In a recent study undertaken for the Joint Economic Committee of the U.S. Congress, Bluestone and Harrison indicate that the only segment of manufacturing jobs which showed any growth between 1979 and 1984 were those that paid less than $7,400 annually (in 1986 dollars).5
While the nation as a whole has suffered as a result of manufacturing job dis-placement, those who have suffercd the most are of course the individuals directly in-volved, with their families and their communities. Numerous studies have examin:d the ccnsequences of job displacement. At the personal level, these consequences have included extended unemployment, lower pay when reemployed, loss of health and pen-sion benefits, exhaustion of unemployment benefits, forced early retirement, geog-raphic relocatica In order to find new work, and mental and physical stress. Those workers most negatively affected are older workers, less skilled workers, minorities and women.6 The impact of these consequences do not stop with the workers involved, but extend directly to their families and communities. At the family level, the stress levels on spouses and children increase, as do divorce rates and child behavior problems.
Regions which suffer significant manufacturing job loss feel compounded im-pacts in the economic, fiscal and social spheres. Manufacturing is at the heart of most regions' traded sector (or economic base), that portion of the economy exports goods and services to other regions, and so provides the income which allows the importation of goods not produced locally. Moreover, average annual manufacturing pay is 29% above the average annual pay in other sectors, so the multiplier effect of consumer
purchases by workers is significant.7 Further, manufacturing tends to have more com-plex local backward and forward linkages than do other sectors. Consequently, the loss of a large number of good factory jobs can have a substantial negative impact on regional economic well-being. In addition to these economic effects, communities may be faced with a decreased tax base, increased expenditures for such social services as welfare, health care and counseling, decreased social cohesion and increased anti-social behavior.8
The costs of manufacturing job loss have been unevenly distributed across regions of the U.S. Areas dependent on manufacturing jobs in declining industries, particularly in the Midwest and Middle Atlantic areas, have felt the heaviest conse-quences.9 However, no area of the country is immune. In fact, some of highest rates of plant closure occur in areas of the South newly industrialized by branch plants.10
-- Factors in the Rastructuring Process
While there is little room for doubt that a restructuring in manufacturing has been occurring, with its attendant costs, there is less agreement about the factors which cause job loss. As the economic world is a complex place, a large number of causes have been proposed. For the most part, these perceptions are not mutually exclusive; each offers a different emphasis. What is unclear is the extent to which the various causes suggested are inmportant in explaining the restructuring process. Suggested causes of job loss can be roughly grouped into three categories--macroeconomic, struc-tural and institutional.
Macroeconomic factors. The thrust of the macroeconomic argument is that cur-rency exchange rates and sluggish aggregate demand are behind the decline in manufacturing. Falling domestic demand brought on by the recessions of the early 1980's produced plant closings and job loss. In its latest annual report, the President's Council of Economic Advisers states that the problems of the U.S. manufacturing sector
have been primarily the result of a strong dollar, making imports cheap and exports ex-pensive. It adds sluggish foreign demand as a factor.1'
Structural factors. The structuralist orientation to economic development seeks to explain dynamics behind patterns in the spatial, technological and corporate organi-zation of economic activity. Industrial restructuring appears as a logical outgrowth of increasing national and international capitalist competition, made possible by improve-ments in communications and transportation technology and spurred by increases in the manufacturing capacity of newly developed nations. While industrial restructuring is not new, it has taken on increased speed and force in the last decade. Three manifestations of the restructuring process directly result in job loss: technological change that increases labor productivity; the geographic dispersion of the productive capacity cf large multi-plant companies in order to reduce the labor and social costs of production; and the elimination of productive capacity in a number of firms, including outright firm failures, because they are no longer cost competitive.
Government statistics show a startling increase in the productivity of production workers in the last two decades. While the number of production workers today is down 12% (1.75 million workers) compared to 1969, factories are producing 60% more output, as measured by the Federal Reserve Board's index of manufacturing output.1i When the employment and output figures are transformed into a measurement of the number of production workers it takes to produce one index point's worth of output, we can see that manufacturing labor productivity has almost doubled in 17 years. What once took 183,000 workers now takes 101,000.13 (See Figure 1.2.) Bluestone, et.al., suggest that for the majority of industries with job loss in the 1970's, productivity en-hancement was the leading cause of job loss.14
The structuralist perspective on the geographic dispersion of manufacturing, dubbed the profit cycle theory of industrial location by Ann Markusen, has been sug-gested by many theorists and supported by a humber of empirical studies.15 Over the
Figure 1.2
US Mfg. Prod. Workers/Index Pt. Output
19M9-85
69 70 71 7'4 73 74 75 76 77 78 79 80 81 32 83 84 85 86
Derived from BLS and Federal Reserve data
ldi 190 1 S 170 160 150 140 1.30 120 110 100
last 40 years, there has been a well-documented flow of new manufacturing capacity into the less industrialized areas of the U.S. and, more recently, overseas by U.S. corpo-rations. This movement is perceived as representing the drive to find lower-cost sites of production for operations in the standardized portion of the product life cycle, sites with what in present-day parlance is known as good "business climate"--the availability of low-wage labor, the absence of unions and a relatively low degree of state interven-tion in the form of taxes and regulainterven-tion. In a landmark study of the business locainterven-tion decisions of Fortune 500 firms, Roger Schmenner found that a favorable labor climate was the most frequently mentioned influence on plant location.16 Further weight to this perspective is lent by the beneficiaries of "good business climate" themselves. Each year, the accounting firm of Grant Thornton publishes an index of state manufactur-ing climates based primarily on the types of criteria mentioned above--wage costs, un-ionization, unempioyment and workers' compensation costs, and tax rates. Labor-related costs account for 63% of each state's final score. Moreover, it is thc opinion of state manufacturing associations vhich determine the weights of each factor in determining the rankings.17
From a structural point of view, a third source of major job loss is the elimina-tion of productive capacity that is unable to compete on the basis of cost. For the most part, this means reductions in the ranks of smaller firms who cannot attain the economies of scale of larger ones and contractions in plants of all sizes who cannot compete with plants in low-wage locations.1 8
In large part, the causes of manufacturing job loss suggested by the structuralist perspective revolve around increases in the concentration of manufacturing capacity. Many firms have been tantalized by and acted on the belief that bigger is better in terms of control of market share, economies of scale, and profits. The merger and ac-quisition binge of the last decade is testimony to that. The growth in the concentration of capital has stimulated the development and implementation of labor-saving
technol-ogy, the geographic dispersion of productive capacity and the competitive weakness of smaller and higher-cost firms.
Institutional factors. Institutionalist suggestions regarding manufacturing job loss flow out of a perception that certain characteristics of U.S. manufacturing and economic institutions encourage corporate behavior that looks profitable in the short-run, but is self-defeating in the long-run for both the companies and the economy. One basic institutionalist argument is that the domination of the U.S. stock market by institutional investors looking for quick, high returns and their lack of hesitancy in jumping from one stock to another has encouraged a corporate emphasis on short-term profitability at the expense of long-term investment and profitability. Structural theory emphasizes as the motivating factor in the restructuring process large rations' search for better ways to compete over cost; institutionalists point out corpo-rate overemrhasis on lowering costs as the means to quicker profits and to the detri-ment of innovation and product developdetri-ment, those factors which determine the long-run profitability of the firm. It is suggested that the short-term orientation has
per-vaded corporate attitudes towards investment (by undervaluing it), labor relations (by undervaluing the contribution which can be made by workers who are treated with dignity and respect), promotions (rewarding quarterly, Pot long-term results), operations management (underemphasizing it in favor of marketing and finance) and.risk (penalizing failure for risk-taking too highly).19
The second thread of the institutionalist argument parallels the first. Not only have minority investors shifted investment from firm to firm in search of profits, but so have controlling owners. The theory that shareholders should have a diversified portfolio of stocks to even out unsystematic risk was transferred to the realm. of con-glomerate ownership beginning in the 1960's.20 From the 1960's through the next decade, the trend was for large corporations to develop a stable of diversified firms. However, for reasons of omission and commission, this approach seems to not have
worked well. A corollary to the diversified portfolio theory was for conglomerate ownership to "milk" the profits of subsidiaries with low returns and reinvest these funds in the more profitable subsidiaries. When the "milked" subsidiary could no longer meet the required rate of return, it was scrapped.21 Many times, the tax ad-vantages of liquidating the subsidiary were greater than the benefits of selling or rein-vesting to make it profitable again.
The problem of omission simply was that new owners with little experience in the market of the acquired firm did not know how to run it and so ran it poorly. A study by Ravenscraft and Scherer indicates that the performance of conglomerate-acquired subsidiaries tended to decrease significantly after acquisition because of lack of managerial competence.22
Some observers suggest that manufacturers who are not headquartered at or near the site of production are much more likely to disperse production activity than are firms headquartered locally. One apparent consequence of non-local buyouts of once locally-owned firms by conglomerates and non-conglomerates alike is loweied stability of local employment. local firms are much more likely to maintain local operations because of local ties to family and community.2 3
The third thread of an institutional approach concerns plant closings as a result of firm failures due to management error. At any point in time a certain number of firms will fail regardless of industry or cyclical conditions. Researchers investigating the characteristics of failed firms have found that lack of necessary management skills provides the major explanation of firm failure in manufacturing. Firm failure as result of lack of management skills most frequently occurs in privately-held, locally-owned firms. Often, failure occurs soon after firm startup or change of ownership. 24
-- Economic Development Policy Responses to Manufacturing Job Loss
The Reagan Administration's economic development policy response to the prob-lems of restructuring has been noticeable by its absence. Attention has been paid primarily to macroeconomic issues, and with little results. Ideology has dictated a hands-off approach to issues which the Administration sees as being in the domain of the private sector and state and local governments. State and local governments are left to respond to the economic problems engendered by restructuring.
With or without Federal support, states and localities would have been forced to undertake active development policies. Because each regional economy is unique in terms of the structure and health of its industrial base, the problems that each region faces are unique as well. Therefore, to some extent each must come to its own solu-tions. The pain of past layoffs, the economic necessity of not standing still in times of a global cconomy, and political pressures have forced local politicians and policymakers to take a more active and thoughtful role in economic development than they traditionally have in the past.
Slowly but surely, many states and regions are stri-ing to create effective devel-opment policies which seek to maintain existing good manufacturing jobs and create new ones. This is not an easy task. Many issues are beyond the capabilities of states and cities, e.g., those of trade, the dollar, and foreign entrants. Moreover, with growth coming so easily in the past, expertise in economic development is in short supply. However, state and local policies can make a difference. One lesson being learned is that effective economic development policies cannot be blindly copied from other regions. Because the structure of each regional economy is to some extent unique, ef-fective policies best grow out of an in-depth understanding of the dynamics of change in the regional manufacturing base. However, hand in hand with lack of expertise in economic development is lack of information that provides such understanding.
The Purpose and Structure of the Dissertation
-- The Need for Information on the Dynamics of Region Industrial Change
Regarding recent patterns in regional manufacturing employment, researchers and policymakers lack sufficient information in two key areas. First, they do not have an adequate sense of gross flows of
iob
losses andjob
gains. While a number of nation-al and regionnation-al studies have utilized Dun and Bradstreet or ES-202 unemployment in-surance data to track gross job flows over a period of time, these studies have a major failing in that they identify establishment births and deaths through account commen-cements and terminations. However, it appears that a large number, if not the majori-ty, of account terminations are the result of changes on ownership or legal structure, not actual deaths and births.25 Consequently, the counts of gross job flows aie inac-curate.Second, researchers and policymakers need more information regarding the macroeconomic, structural and institutional factors associated with changes in manufacturing plant employment. Policy design would be strongly aided by a better understanding of the extent to whizh particular factors seem to induce job lo3s. As in-dustrial structure varies by region, the 'mportancc and interaction of assorted factors will vary as well. Even so, there is little solid statistical evidence in any region regard-ing the role of various factors.
The lack of information on gross job flows and the underlying factors hampers the development of effective state and local economic development policies aimed at maintaining existing decent manufacturing jobs and creating new ones. In the absence of good information, policies are primarily designed around folk wisdom and anecdotal evidence.
-- The Structure of the Dissertation
The purpose of this dissertation is help fill the informational and meth-odological vacuum through the examination of the 582 manufacturing plants in the state of Rhode Island which had 50 or more employees in at least one year during the
1977-83 period. First, using ES-202 data, I describe gross job change through plant
deaths, contractions and expansions between 1978 and 1983, years which represent the peak and nadir, respectively, of recent manufacturing employment in Rhode Island. In contrast to most other studies, plant births and deaths have been verified through a ephone survey and newspaper clipping research. Second, using data gathered in the tel-ephone survey, I examine the statistical relationships between the plant characteristics and employment change, i.e. the frequency of plant closings and actual and percentage change in plant emplcyment in the 1978-83 period.
Rhode Island is a logical choice for a case study. Its small size allows the manufacturing base of the whole state to be examined in detail. The state has been relatively dependent on manufacturing in general and on a few industries hit by sig-nificant job loss in particular. Thus, its study should offer insights into the dynamics of manufacturing job loss.
A prior section described a large number of factors to which manufacturing job
loss cn be reasonably ascribed. To fully explore the influences of and interactions among the various factors in Rhode Island plant closings would require analyses not only at the level of the firm, but at the level of each plant's industry, to get at struc-tural dynamics. Of course, the latter type of analysis is not feasible for a population of plants that represents hundreds of industries. The primary research here is focussed at the level of plant and firm characteristics, though secondary source material on par-ticular industry structures, parpar-ticularly jewelry and textiles, is introduced as context. Specifically, I examine relationships between employment change and organizational characteristics that seem relevant in light of the suggested causes of closings and
contractions--e.g., firm age, location of headquarters, firm run by original family or ac-quired, presence or absence of a union, and plant product. This approach is a cost- and time-effective method for gathering information on and testing a relatively large num-ber of variables over a whole population.
I originally had hoped that the effect of plant operating characteristics, such as wage rates and labor productivity, could be analyzed through use of the Census Bureau's Longitudinal Establishment Data file (LED). Unfortunately, as with other account-based establishment data bases, the analysis contained significant numbers of
spurious plant births and deaths, so the results were not meaningful.
One consequence of the methodological focus on quantifiable organizational
characteristics is that I do not directly measure a number of factors external to the
firm or not easily quantified, e.g., the effects of the strong dollar, changes in foreign
demand and supply, change in production technology, and quality of management
However, some of the variables will be proxies for these factors. For instance, firm
age is a stand-in for management skills, under the hypcthesis that the younger the
firm, the shakier the enterprise. One variable, national empl:yment change in the
plant's industry, reflects a number of external forces whose effect cannot be clearly
seen at the plant level in this analysis, e.g., technological change, foreign competition,
and shifts in aggregate demand and currency exchange rates.
In Chapter 2, I provide background information on that state's economy and its
manufacturing sector. Using Rhode Island Department of Employment Security (DES)
ES-202 establishment data, Chapter 3 gives us a sense of the gross job losses and gains
between 1978-83, both on a year-to-year basis and over the period as a whole. Job
losses are distributed between plant closings and contractions. Patterns in job recovery
in the year subsequent to contraction are examined. In addition, the methodology and
results with be compared to those of other such studies.
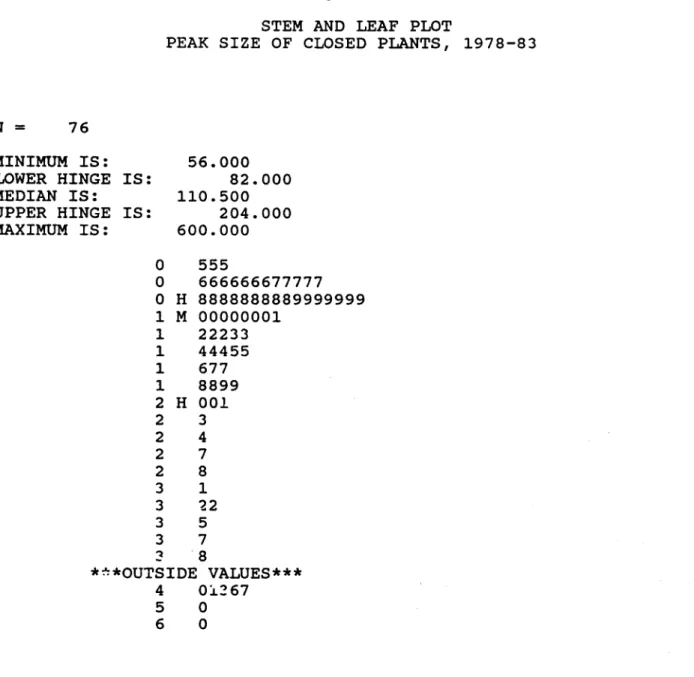
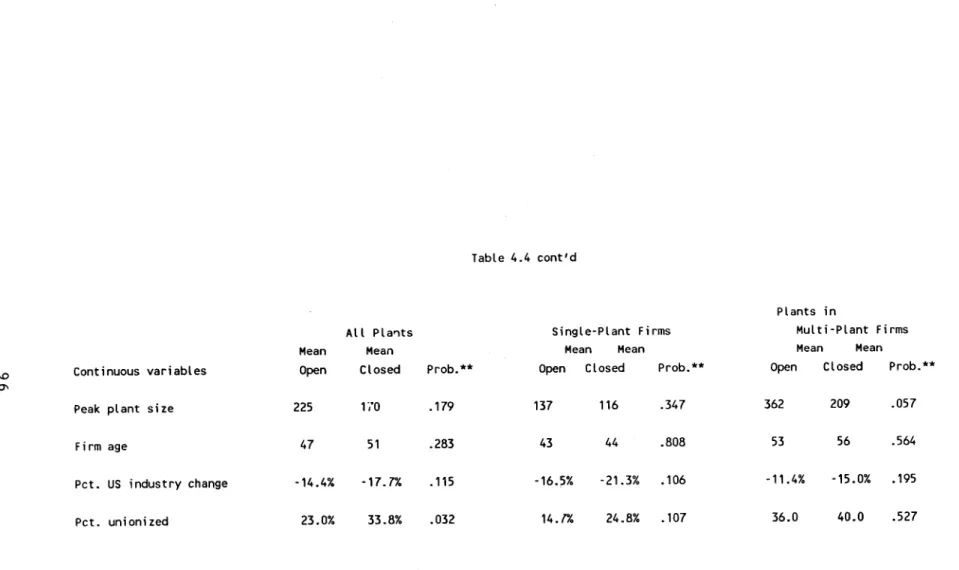
In Chapter 4, I examine the statistical relationships between plant characteristics and the frequency of plant closings. The core of this chapter is comprised of logit regression analyses, with the categorical dependent variable being plant was opened/closed as of December 31, 1983. The regressions are followed by an examina-tion of the closed plants regarding the reasons for closure, both to explicate the regres-sion findings and to see if additional patterns emerge.
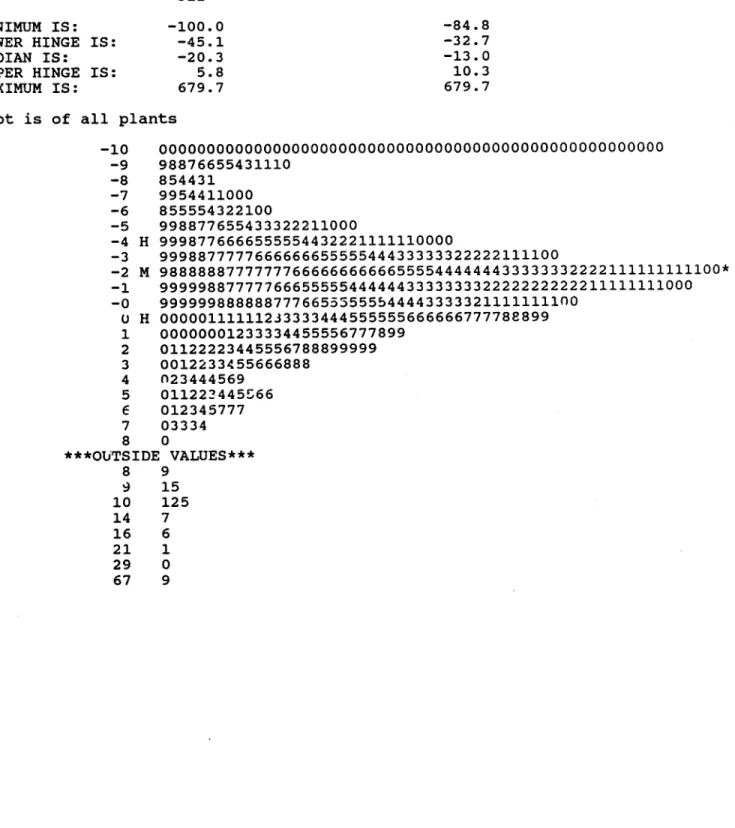
In Chapter 5, I analyze the statistical relationships between plant organizational characteristics and plant employment change, using ordinary least squares regressions. The dependent variable is percentage plant employment change from 1978 to 1983, as measured using ES-202 data. The independent variables will be those used in Chapter 4 (or variations thereof).
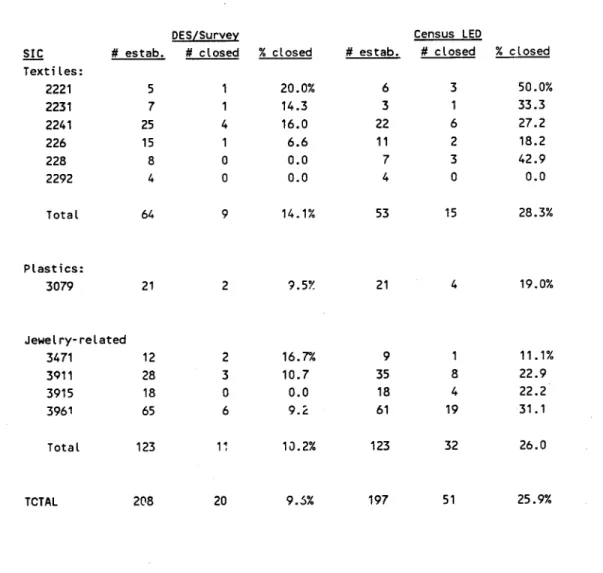
Originally, Chapter 6 was to have consisted of an examination of the rela-tionship between plant operating data (such as wage rates, cost of materials and labor productivity) and employment change (as measured by plant closings, actual and per-centage employment change). The source of data for this analysis was to have been the LED, which covers all manufacturing establishments surveyed by the quinquennial Census of Manufactures. Because the LED is a confidential file, its plant operating data could not be integrated with the other analyses. Rather, I had to hire the Census Bureau to undertake a separate analysis. Unfortunately, it became clear that the extent to which the LED is actually longitudinal is severely diminished for the same reason that prior DMI and ES-202 studies are inaccurate. Plant closures could only be identi-fied through plant number terminations, but many, if not most, plant number termina-tions in actuality represent changes in ownership. This fact was ascertained through a comparison of plant closure rates based on the DES/survey data base with those for the LED. Unlike DMI and DES, in theory the plant number terminations are to occur only in cases of actual closures, but this is not the case. Consequently, the chapter sets out
the planned analytic methodology and then provides the analysis that determined that the LED is not as fully longitudinal as I had hoped.
In the final chapter, I explore the policy implications of the findings of Chap-ters 3-5 for economic development policymakers. I end with a few concluding remarks regarding what I perceive to be the contributions of the thesis to the field of economic development.
CHAPTER NOTES
'While the negative effects of the Depression certainly were much worse, those job losses were cyclical rather than structural in nature. Regional restructuring with large-scale negative effects has occurred, e.g., the loss of the New England shoe and textile industry in the 1940's and 1950's. However, on a national level, the sum total of recent job loss for reasons of structural change is unparalleled.
2U.S. Bureau of Labor Statistics, "Reemployment Increases Among Displaced
Workers," News Release 86-414, October 14, 1986.
3Michael Podgursky and Paul Swaim, "Labor Market Adjustment and Job Displacement: Evidence from the January, 1984 Displaced Worker Survey," Department of Economics, University of MA, January 1986. The number of displaced manufactur-ing workers in the 1979-84 period with 3 or more years job tenure totalled 2.48 million, so the total job loss figure of 4.25 million should be roughly comparable to the 1981-86 total job loss figure, which has not been published.
4U.S. Bureau of Labor Statistics, Employment, Hours and Earnings. United States, 1909-1984, Volume I (March i985) and Supplement (June 1936), Washington, DC: Government Printing Office.
5Barry Bluestone and Bennett Harrison, "The Great American Job Machine: The Proliferation of Low Wage Employment in the U.S. Economy," prepared for the Joint Fconomic Committee of the U.S. Congress, December 1986.
6The most recent compilation of studies of the consequences of job loss is con-tained in Office of Technology Assessraent, U.S. Congress, Technology and Structural Unemployment: Reemploving Displaced Adults (Washington, DC: U.S. Government Printing Office, February 1986), Chapter 3: "Worker Displacement."
7
U.S. Bureau of Labor Statistics, "Average Annual Pay by State and Industry,
1984," News Release 85-320, August 13, 1985.
8For a review of studies of the community effects of job loss, see Barry Bluestone and Bennett Harrison, The Deindustrialization of America: Plant Closings, Community Abandonment, and the Dismantling of Basic Industry (New York: Basic Books, 1982), pp. 67-81.
9U.S. Bureau of Labor Statistics, Displaced Workers: 1979-83, Bulletin 2240 (Washington, DC: Government Printing Office, July 1985).
ioBluestone and Harrison, The Deindustrialization of America.
1 Council of Economic Advisers, "Annual Report," in the Economic Report of the President (Washington, DC: Government Printing Office, January 1987), Chapter 3: "Growth, Competitiveness, and the Trade Deficit." See also Robert Lawrence, "The Myth of U.S. Deindustrialization," Challenge, November-December 1983.
13This 44% decrease in the number of workers per index point of production does not take into account changes in the industrial mix over the period. However, measures at the two-digit industry level show similar change: machinery (51% decrease), foods (42%), motor vehicles (40%) and apparel (35%).
14Barry Bluestone, Bennett Harrison and Lucy Gorham, "Storm Clouds on the Horizon: Labor Market Crisis and Industrial Policy," (Brookline, MA: Economic Edu-cation Project, May 1984), p. 17.
15See Ann Markusen, Profit Cycles, Oligopolv and Regional Development (Cambridge, MA: MIT Press, 1985); Richard Walker and Michael Storper, "Capital and Industrial Location," Progress in Human Geography, v.? n.4, 1981; Richard Walker, "Two Sources of Uneven Development under Advanced Capitalism: Spatial Dif-ferentiation and Capital Mobility," Review of Radical Political Economics, Fall 1978; John Rees, Geoffrey Hewings and Howard Stafford, eds., Industrial Location and Regional Systems: Spatial Organization in the Economic Sector (New York: J.F. Bergin, 1981); Gordon Clark, "The Employment Relation and the Spatial Division of Labor: A Hypothesis," Annals of the Association of American Geographers, v. 71, n. 3, September 1981; Bennett Harrison, "Rationalization Restructuring and Industrial Reorganization in Older Regions: The Economic Transformation of New England since World War II," Working Paper No. 72, MIT-Harvard Joint Center for Urban Studies, February 1982; Larry Sawyers and William Tabb, eds., Sunbelt/Snowbelt: Urban Redevelopment and Regional Restructuring (New York: Oxford University Press, 1984); Richard Peet, "Relations of Production and the Relocation of United States Manufacturing Industry Since 1960," Economic Geography, v. 59, n. 2, April 1983; Doreen Massey, "The U.K. Electrical Engineering and Electronics Industries: The Im-plications of the Crisis for the Restructuring of Capital and Locational Charnge," in Michael Dear and Allen J. Scott, eds., Urbanization and Urban Planning in Capitalist Society (New York: Metheun, 1981).
1 6Roger Schmenner, Making Business Location Dccisions (Englewood, NJ: Prentice-Hall, 1982), p.153.
1 7Grant Thornton, The Seventh Agnual Study ot General Manufacturing Climates of the Forty-Eight Contiguou:: States of America (Chicago: June 1986).
1 8For in-depth industry case studies tc this effect, see Rhode Island Strategic Development Commission, The Greenhouse Compact: Cultivating Rhode Island's Fourth Economy (Providence, RI: January, 1984).
1 9See Robert Hayes and Steven Wheelwright, Restoring Our Competitive Edge: Competing Through Manufacturing (New York: Wiley, 1984); Jane Jacobs, Cities and
the Wealth of Nations: Principles of Economic Life (New York: Vintage Books, 1985); Lester Thurow, Zero-Sum Society: Distribution and the Possibilities for Economic Change (Penguin Books, 1980); Richard Ellsworth, "Capital Markets and Competitive Decline," Harvard Business Review, September-October 1985; Ira Magaziner and Robert Reich, Minding America's Business: The Decline and Rise of the American Economy (NY: Harcourt, Brace, Jovanovich, 1982); The Business Week Team, The Reindustrialization of America (NY: McGraw-Hill, 1982).
20
Hayes and Wheelwright, on.cit.
2 1Barry Bluestone and Bennett Harrison, "Why Corporations Close Profitable Plants," Working Papers for a New Society, May/June 1980.
22
David Ravenscraft and F.M. Scherer, "Mergers and Managerial Performance," unpublished monograph, August 1985.
23
See Peter Doeringer, David Terkla, Gregory Topakian, "Reviving Mature Economies: Business Decision-Making, Invisible Factors and Local Economic Develop-ment," Institute for Employment Policy, Boston University, January 1986; Jane Jacobs, o.cit.; Cynthia Duncan, "Entrepreneurship and Economic Development," Kentucky Highlands Development Corporation, 1978; David McGranahan, "Absentee and Local Ownership of Industry in Northwestern Wisconsin," Growth and Change April 1982.
2 4See Rhode Island Strategic Development Commission, op.cit. Chapter 5; John Argenti, Corporate Collapse: Causes and Symptoms (NY: Wiley, 1976); Philip B. Nel-son, Corporations in Crisis: Behavioral Observations for Bankruptcy Policy (NY: Praeger, 1981); Doeringer, et.al. op.cit.
2 5See U.S. General Accounting Office, "Dislocated Workers: Extent of Business
Closures, Layoffs, and the Public and Private Response" (Washington, DC: Government Printing Office, July 1986). This issue is explored in depth in Chapter 3.
CHAPTER 2
OVERVIEW OF THE RHODE ISLAND MANUFACTURING SECTOR
Rhode Island Industrial History to 19501 -- Historical Review
From its founding in 1636 through the early 1700's, the Rhode Island economy was based primarily on agriculture. In the second half of the 18th century, economic emphasis shifted to maritime commerce and rum distilling. However, with the estab-lishment of Samuel Slater's water-powered textile mill in 1793, Rhode Island quickly entered the industrial age. After 50 years of slow but steady growth, the state's indus-trial employment grew at a rapid pace--from 18,000 in 1840 to 153,500 in 1919. This industrial growth was centered around the cotton and wool textiles, machinery and jewelry industries.
The industrialization process was led by the cottou textile industry. The num-ber of cotton mill spindles in the state climbed from 76,000 In 1815 to 500,000 in 1840 to 3 million by 1920. By the latter year, 35,000 people were employed in the cotton mills. The woolen textile industry also grew significantly--from 1,000 workers in 1840 to over 25,000 by 1920. Initially, growth of the textile industry depended on access to water for power and a ready supply of unemployed farm workers. The development of steam power and power looms, the building of large stone mills, and a massive and steady influx of work-hungry immigrants all propelled the state textile industry to its peak employment of over 70,000 workers in the early 20th century.
Hand in hand with growth in the textile industry in the late 19th century went increased concentration of mill ownership and harsher working conditions. The compe-tition for profits led to the development and introduction of a series of production-boosting technologies. However, the utilization of these technologies led to
overproduc-tion, which in turn produced falling prices, meager profits and some staggering losses. Only the largest firms could meet the capital demands for newer machinery and ride out, or attempt to control through acquisition, the fluctuations of the market. In the attempt to be profitable in the production of standardized commodities, owners became obsessed with reducing costs. They assigned more machines to each worker, ran the machines faster and cut wages. Workers reacted to the increasingly intolerable condi-tions by unionization, strikes and work stoppages.
Rhode Island's machinery industry initially was established to produce equip-ment for the textile factories. In the second half of the 19th century, the industry de-veloped to the point where Providence became the leading center of American industri-al technology. The town boasted the nation's foremost producer of steam engines (Corliss) and machine tools (Browne and Sharpe). America's rush to industxialization meant a booming business for the state's machinery manufacturers. The first
machinists' local in the state was formed in 1891.2
The jewelry and silverware industry got its start in Rhode Island in 1794. With the introduction of mechanized production equipment at the end of the i800's, the in-dustry was transformed from a craft to a mass production orientation. By 1910 Pro-vidence alore had nearly 300 jewelry firms and was the silverware capital of the coun-try. With the spread of mass production, firm specialization took place--finding houses, refiners, and job shops specializing in electroplating, enameling, engraving casting and lapidary work appeared. In a pattern which has remained true through today, most of these companies were small because of the risks of heavy investment in expansion in an industry which was very sensitive to changes in fashion and fluctuations in the gen-eral economy.
The shift to mass production brought with it the de-skilling of traditional jewelry jobs, the fall of wage rates, job instability and increased hiring of women, who tended to be more willing than men to take such jobs. For a number of reasons, the
jewelry industry had very few labor unions. Firms tended to be small, often short-lived and required little capital investment to start. The women workers were gener-ally more resigned to working conditions and money worries made them fearful of losing their jobs. These dynamics remain true today.3
The growth in Rhode Island manufacturing employment reached a halt at
153,500 in 1919. Half of the state's industrial employment was in the textile industry.
In 1920, the textile industry began its 50-year move to the South, where it could enjoy lower labor costs and a more tractable workforce. The cotton mills were the first to go--by 1939, the state had lost two-thirds of its spindle capacity and cotton mill jobs. However, worsted mill employment was steady in the 1930's and jobs in synthetics ac-tually grew significantly. The state's jewelry industry was hard hit by the Depression, as consumers could only afford low-cost items. By 1939, overall manufacturing employment was down to 125,000.4
The 1910's through the 1930's were a time of significant labor organizing and unrest ip Rhode Island's textile industry. The Industrial Workers of the World in-stigated a wave of strikes among recent Italian immigrants in the textile industry in
1914-15. After the First World War, when textiie mill owners increased the work hours
and reduced wages, workers reacted by organizing new union locals and strikes. Facing job losses and wage cuts in the 1930's, textile workers both in Rhode Island and across the country went on an industry-wide United Textile Workers-led strike that resulted in several days of street riots. However, the thread that ties each of these episodes is that for the most part workers failed to reverse the industry trends imposed
by the owners and economic conditions.5
The state's industrial base was reinvigorated by the demands of war production. Total plant employment jumped to 171,000 by 1943. All sectors of the industrial base were busy producing war materiel. Seventy percent of employment in production in the jewelry industry was devoted to war-related goods such as small radar and radio
parts, proximity fuses for motors and artillery shells, and small precision assemblies. The state's electrical and electronic components industry grew out of this conversion.
Manufacturing employment remained relatively strong immediately after the war, standing at 155,000 in 1947. Consistent with the past, the state's economy and in-dustrial base were dominated by the textile industry, which employed 67,000 workers.6 The state's jewelry industry doubled in size between 1939 and 1947 in the face of booming consumer demand. With 20,000 workers, the state provided 44% of the coun-try's jewelry jobs.
-- The Le2acies of the State's Core Industries at Mid-Century
In the first half of the 20th century, Rhode Island's textile, machinery and jewelry industries provided the state with a number of legacies. First, they helped spawn a number of other industries in the state. For instance, a significant wire end cable industry grew because the covering for most wire and cable was textile. When plastic sheaths replaced textile ones, a viable plastics industry developed. Skills learned in the jewelry and machinery industries encouraged the establishment of firms in fabricated metals--plating, valves and fittiigs, and hardware and cutlerv--and in other jewelry-type work such as shoe and handbag ornaments and optical goods. The diversification of the plastics industry into custom molding also was stimulated by
p-oximity to the jewelry industry. The spinning off of electrical components firms from the jewelry industry was noted above.
The second legacy of the textile and jewelry industries was a tradition of a manufacturing work force paid low wages, with low educational achievement, and with a higher-thaverage representation of women, characteristics quite related to one an-other. With mill jobs readily available and requiring little training of education, Rhode Island workers typically left school at an early age. Employers offering low-wage, low-skilled jobs often sought women to fill them because women were more
will-ing than men to take such jobs. In 1950, 38% of the Rhode Island industrial workforce was comprised of women, compared to 25% for the U.S. Forty-three percent of textile workers and 60% of jewelry workers were women.7
A third legacy of the state's textile and machinery industries was a tradition of a strong union presence in the state. In this heavily industrialized state, union strength translated itself to the ballot box. In the 1930's, the labor movement, the working class and the Democratic party created an alliance which ensured that the party governed the state for decades.8 The legislature itself periodically had a number of union mem-bers on its rolls.
Fourth, Rhode Island had developed a tradition of entrepreneurial activity. In the 1800's and early 1900's, some of the country's largest firms in textiles, machinery and rubber were headquartered in Rhode Island. By mid-century, many of them were gone, but there were still a very high number of small, locally-owned firms spread throughout Rhode Island's industries such as in specialized textiles, jewelry and ma-chinery.
The final legacy of the state's major manufacturing industries was the eco-nomy's high vulnerability to structural shifts. In 1947, 52% of Rhode Island employ-ment was in manufacturing, compared to 36% for the U.S. (See Figure 2.1.) Employ-ment in the state's three major industry groups--textiles, metals and non-electrical ma-chinery, and jewelry and silverware--accounted for 76% of ail manufacturing jobs (compared to 32% for the U.S.).9 The state's textile industry employed 44% of all manufacturing workers and 23% of all workers. With such concentration, the state was enormously vulnerable to a restructuring of the textile industry, as it soon found out.
Figures 2.1 and 2.2
Mfg. Employment as % of Nonag. Employ.
1947-86 47 50 53 55 59 62 5 68 71 74 77 so 83 8C a RII4
70-aS - 40-+ LISTextile, Jewelry, M & M Employment
as
%
,f HanufactLrifY Enplayrrmnt. 1947-85 101 0 .. 47 50 53 56 59 62 65 68 71 74 77 80 83 86 a Rhode Islond
&
0 0 S 0. 52 so 48 46 44 42 40 35 34 32 28 24 20 Is 103 90 ep 0 0 0 0.Rhode Island Manufacturing Employment and Wages in the Postwar Period'0
The postwar major trends in Rhode Island manufacturing employment and wages are consistent with its prior industrial history:
o The manufacturing sector dominated the state economy to a far greater degree than for the U.S. as a whole (Figure 2.1);
o the manufacturing sector itself continued to be dominated by textiles, jewelry and metals and machinery, though that dominance declined over time (Figure
2.2);
o such dependence brought about large swings in aggregate manufacturing employment (Figure 2.3);
o the cyclical sensitivity of manufacturing generally and high state dependence on manufacturing in general and a few industries in particular also brought about swings in unemployment rates more volatile than for the U.S. as a whole (Figu-e 2.4);
o the manufacturing sector, dominated as it has been by textiles and jewelry, tends towards low-wage, low-skill jobs--RI manufacturing wages and value-added per worker are among the lowest in the country (Figures 2.5 and 2.6). The remainder of this section looks at the manifestation of these themes in the
1947-78 period. The next section examines in grepter detail RI manufacturing
employ-ment and wages in 1978-83, the focus period of this dissertation.
1947-1964: The Devastation of the Textile Industry. Between 1951 and 1958, Rhode Island manufacturing employment fell from 150,900 to 113,200, a plunge of 25%. The primary reason for this massive loss was the decimation of the textile industry, which lost 50% of its jobs (29,000) in the seven years, as operations either were liqui-dated or moved South. (See Figure 2.7.) These losses were almost entirely in wool tex-tiles, whose market share was being seriously eroded by Southern-produced synthetic
Figures 2.3 and 2.4
RI Manufacturing Employment
1947-85
47 so 53 56 59 62 65 68 71 74 77 80 83 86
Unemployment Rates, RI and US
1948-85 48 50 52 54 56 58 60 62 64 66 68 70 72 74 76 78 80 82 84 86 0 RI t ISH
2 a £ I-140 130 120 110 100.8
14 13 12 11 10 7 6 4 3 2 160Figures 2.5 and 2.6
Real Average Hourly Mfg. Wage, RI & US
10 9.5 9 as a 7.5 7 47 50 53 56 59 62 65 6.3 71 74 77 80 83 88 a RI t LBRatio of RI & US Avg. Hourly Mfg. Wage
1 47-1986 1* 0.98 -0.96 - 0.94- 0.92- QL9- 0.8- 0.850.84 O.82 -a - 0.78- 0.760.74 - 0.72-Q7 47 50 53 56 59 62 65 68 71 74 77 80 83 86 F'. S 0 C di 'F
Figure 2.7
RI Textile and Jewelry Employment
1947-8647
G0
53 56 59 62 65 68 71 74 77 80 83 860 Tektile + Jemdry
Sources for Figures 2.1-2.7:
U.S. Bureau of Labor
Statistics and the RI Department of Employment Security 70 40
X
20 10 0products."1 A steep decline also occurred in the machinery industry, which was centered in textile machinery. For the state, this was restructuring with a vengeance.
The state's dependence on textiles meant that throughout the late 1940's and 1950's it suffered an unemployment rate far above that for the U.S. as a whole. More-over, the ups and downs in the movement of the rate were quite volatile, as Figure 2.4 shows. While the U.S. was feeling the negative economic effects of the end of Korean War, Rhode Island was experiencing that plus a one-year loss of 10,000 textile jobs (almost as many as are left in the state today.)
Rhode Island's real average hourly wage grew in the 1950's as it did elsewhere in the country, though at a far slower rate. In 1948, the state average wage was 93% of the U.S. average. In ten years, the figure had plummeted to 83%. The first reason for this drop is that textile wages, still the state's dominant industry, failed to keep up with wag- growth in othei sectors.12 The second is that the state developed one of the most labor-intensive, low value-added industrial sectors in the country. In 1947, Rhode Island value-added per production worker was 83% of the U.S. figure; in 1958, the state figure was 68% of that for the U.S.13 This wage structure resulted from a combination of industry mix and pay that was less than for similar work elsewhere. 4
From the late 1950's through the mid-1960's, overall manufacturing employment remained fairly stagnant. Textile employment continued to slide, with the losses were made up by machinery, electrical goods, and increased diversification inlto such in-dustries as chemicals, paper products and instruments. As the massive loss of textile jobs receded in time, the state unemployment rate fell close to the national figure.
1964-1969: Machinery- and Jewelry-Led Growth. As a result of several trends,
state manufacturing employment grew by 10% from the mid- to late 1960's. First, the slide in textile employment stopped. Second, jobs in the growth industries of the pre-vious period continued to be added--in machinery, electrical components, chemicals, and plastics. Third, additional growth came from jewelry-related firms. The dominant
force in the industrial sector became metals and machinery, which provided 23% of the manufacturing jobs in 1969. For the first time in decades, the state's unemployment rate not only fell below 4% and but also was at the same level as that for the U.S.15
1969-1975: Recessions. Between 1969 and the twin recessions of the early and mid-1970's, manufacturing employment fell 15% (compared to 9% for the U.S.). Employment in the textile industry again fell in half, from 21,100 to 11,800. Other losers included metals, machinery and rubber and plastics. In 1970, for the first time in the state's history, jewelry employment surpassed textile employment. Jewelry employment actually grew 20% between 1969 and 1975 on the strength of changes in fashion and the growth in the young adult market.
Once again, the state's economic woes were compounded by a dependence on manufacturing in general and on textiles and machinery in particular (textiles still had a 17% share of industrial employment in 1969). The state's unemployment rate jumped well above that for the U.S.--hitting 11.2% in 1975, compared to 8.5% for the U.S. Eco-nomic difficulties were exacerbated by the closing of the Quonset Naval Yard in 1971-4 period, which resulted in the loss of 22,000 jobs.
1975-1978: Jewelry-Led Boom. After steep job losses in 1971 and 1975, the state's manufacturing sector hit the up-side of the roller coaster between i975 and 1978. The state's manufacturing employment jumped 19% to over 134,000, a level which had not been achieved since 1953. In comparison, the U.S. manufacturing employment rose 12% in the 3 years.
Fueling the increase was a one-third jump in jewelry employment. While fash-ion trends continued to favor the jewelry industry, employment also jumped because of the deregulation of gold. As the price of gold rose, so did consumer demand for both costume and precious jewelry, the former because it was affordable and the latter be-cause it was seen as a good investment. Rhode Island jewelry-makers' orders also climbed with the entrance of several national sales companies into the jewelry retail
business. Even jewelry manufacturers with little business experience found business quite profitable.16
Almost all categories of industrial employment showed increases, even textiles. Besides jewelry, other significant sources of new employment included transportation equipment, a source of well-paying jobs, and electrical goods. The transportation jobs were provided primarily by General Dynamics, which started building submarines soon after the Navy pulled out of Quonset.
Even with the growth in industries across the board, the explosive growth in jewelry gave the state a new industry on which to be overly dependent. In 1978, 24.2% of all industrial jobs were in jewelry, compared to 15.8% in 1969. The growth in ag-gregate manufacturing employment in that decade was provided entirely by jewelry. (Total manufacturing employment was up 6,500, jewelry employment 12,000.)
Primarily as a result of the growth in the low-wage jewelry industry, the state's real average hourly manufacturing wage steadily declined through the 1970's. Nation-ally, the jewelry industry paid among the lowest wages in manufacturing--an average $4.07/hr. in 1978, just 66% of the all-manufacturing average. The state's average manufa:turing wage as a p'ercentage of the U.S. average dropped to 76%.
1978-1983: Industrial Decline
-- Overview of Trends in Employment and Wages
Employment. The manufacturing employment peak reached in 1978 could not be sustained. Again, the state felt the effects of a volatile manufacturing base. Be-tween 1978 and 1983, the number of manufacturing jobs fell by over 18,000, a drop of 14% (compared to 10% for the U.S.). The worst year of net job loss was 1982, when employment declined by 11,100. During this period, the state's unemployment rate went from 6.7% to 10.3%, with most of the jump occurring in 1982.