DOI 10.1007/s00027-005-0811-4 © Eawag, Dübendorf, 2006
Aquatic Sciences
Research Article
Infl uence of hydraulic conductivity on communities
of microorganisms and invertebrates in porous media:
a case study in drinking water slow sand fi lters
Laurie Mauclaire1,*
, Andreas Schürmann1,3
and Florian Mermillod-Blondin2
1
Institute of Terrestrial Ecology, Swiss Federal Institute of Technology (ETH), Universitätstrasse 16, CH-8092 Zürich, Switzerland
2
UMR-CNRS 5023, LEHF, Lyon I University, 6 rue Dubois, F-69622 Villeurbanne, France 3
Present address: Zürich Cantonal Laboratory, Pesticide Analysis, Fehrenstrasse 15, CH-8030 Zürich
Received: 3 May 2005; revised manuscript accepted: 20 August 2005
Abstract. The impact of reduced hydraulic conductivity
on the abundance and diversity of microorganisms and invertebrates was examined in an artifi cial ecosystem consisting of a slow sand-fi lter. Sand-fi lters processed pre-treated lake water under high fl ow rates and acted as small ecosystems inhabited by a complex community. The fi rst trophic level consisting of microorganisms serves as a food source for a dense community of protists, micro- and macro-invertebrates. The reduction of
hy-draulic conductivity due to the development of larger bacterial and fungal biomass induced a shift of the micro-bial community towards anaerobiosis that may increase clogging by carbonate precipitation. The presence of more bacterial prey seems to favour the development of higher trophic levels. Predation and bioturbation by eu-karyotes were not able to counteract the reduction of hy-draulic conductivity due to prokaryotic clogging.
* Corresponding author mailing address: Laboratory of Geomicro-biology, Geological Institute, ETH Zürich, Universitätstrasse 16, CH-8092 Zürich, Tel.: +41 44 632 87 38; fax: +41 44 632 10 30; e-mail: [email protected]
Published Online First: February 20, 2006
Key words. Biofi lm; carbonate; predation; clogging; fatty acid; bioturbation.
Introduction
Little is known about how complex biological communi-ties of interstitial habitats affect the development of their physical environment. According to the general theory of ecological succession (Engstrom et al., 2000), this sys-tem should become more productive with age and the biomass in the sediment should increase with time, lead-ing to bioclogglead-ing. By taklead-ing advantage of an anthropic system, we observed that the evolution of an infi ltrating sedimentary system toward clogging is unpredictable
based on physical and chemical parameters. Surprisingly, “identical” systems have a completely different clogging behavior due to different development rates in the bacte-rial exopolymeric substances (Mauclaire et al., 2004).
In the present study, we determined how eukaryotic and prokaryotic communities responded to the clogging process, and attempt to identify factors driving the sys-tem progression towards clogging. Sand fi lters represent specifi c habitats for micro-, meio- and macro-organisms (Adam et al., 1998; Aeppli 1990; Moll et al., 1999) and we expected that the biological compartment of the arti-fi cial inarti-fi ltrating porous media is highly adapted to its environmental conditions. As microbial development may be controlled by both bottom-up (nutrient resources) and top-down (bioturbation, predation) factors, the aim of this study was to elucidate the relationships between the physical functioning of the system, the microbial
compartment, and the meio- and macrofauna. Consider-ing that the cloggConsider-ing process would control the nutrient resources of the system (bottom-up control), we hypoth-esized that an increase in clogging of porous media would lead to a general development of system produc-tivity by increasing abundance, acproduc-tivity, and diversity of the prokaryotic and eukaryotic community.
Materials and methods
Slow sand fi lters
At the water plant Zurich-Lengg, raw water is collected from Lake Zurich (Switzerland) at a depth of 30 m (more than 20 m below the thermocline). Primary ozonation is used for disinfection prior to a coarse cleaning by rapid fi lters. Secondary ozonation and active carbon fi ltration are conducted before the mechanical and biological su-perfi ne cleaning with slow sand fi lters. These fi lters (1120 m2
each) are isolated systems with their fl oors con-structed on special bricks for drainage. The sediment tanks consist of four layers of sediment with increasing grain size from the top to the bottom: 85 to 50 cm of fi ne sand (diameter 0.2–2 mm), 5 cm of coarse sand (diameter 4–8 mm), 5 cm of fi ne gravel (diameter 8–15 mm), and 5 cm gravel (diameter 15–30 mm). The thickness of the fi ne sand layers varies according to number of cleaning cycles (removal of the top 5 cm). The sand originated from Lake Obersee and was extracted by the sand wash-ing plant Kibag. All fi lters are operated indoors in the dark at 4 to 8 °C.
Newly constructed fi lters (clean sand) exhibit an ini-tial hydraulic conductivity of approximately 4–7 m h–1
. During the following years, the hydraulic conductivity decreases gradually to 0.5 m h–1
, indicating the increasing clogging of the system. At this point, the fi lters must be cleaned by removing the top 5 cm of sand to raise the hydraulic conductivity by 1–2 m h–1
.
Sampling procedure
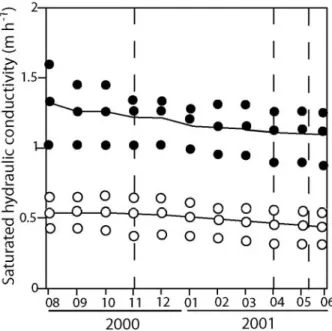
To study the infl uence of reduced hydraulic conductivity on the biotic system, fi lters were grouped by the degree of clogging (high and low, Fig. 1). When sampled, highly clogged (C+) and less clogged (C–) fi lters had an average hydraulic conductivity of 0.5 m h–1
and 1.2 m h–1
, respec-tively. For each fi lter type (C+ and C–), three fi lters were selected. The investigated fi lters were not subject to maintenance for at least 19 mo, a suffi cient time to allow the equilibration of the system.
Samples were collected on three dates: 2 November 2000, 20 March 2001 and 17 May 2001. The last two sampling dates were before and after lake stratifi cation. Saturated hydraulic conductivity of the entire fi lter was estimated by measuring the pressure head as the differ-ence in water level between the inlet and outlet of each
fi lter at a constant fl ux rate of 500 m3 h–1
. Samples of sand for microbiological analysis were taken from each fi lter at 3 points spaced approximately 1 m apart, forming an equilateral triangle. The triplicate samples of each fi lter were pooled for subsequent analyses. Sand was collected by coring with a Plexiglas tube (diameter 50 mm). The cores were sectioned, and two parts (0–5 cm and 15– 20 cm) were preserved in an icebox for later analysis. The top layer (0–5 cm) corresponded to the sand removed when slow sand fi lters are cleaned. Samples of fauna were taken at 100 cm and 20 cm depth at one point from each fi lter using a Bou-Rouch pump (Bou and Rouch, 1967).
SEM observations
Electron-microscope studies were conducted on a Zeiss Leo 1530 scanning electron microscope (SEM). The sand samples were fi xed with 4 % glutaraldehyde for 4 °C. The fi xed samples were washed twice in distilled water and dehydrated in ethanol (50 %, 80 %, 98 %, 3 min × 3 times each; absolute ethanol 10 min × 3 times) and critical-point dried in liquid CO2. The samples were coated with platinum prior to SEM imaging.
Biological analysis
Lipids were extracted as described previously (Mauclaire et al., 2003). The fatty acids were methylated and the fatty acid methyl esters separated by gas chromatography (Hewlett Packard HP 5890 series II equipped with a HP Figure 1. Average saturated hydraulic conductivity of the two sand fi lter types with sampling dates indicated by the dashed lines. The dots indicate the measurements obtained for each individual fi lters (triplicates). The black lines and dots correspond to the C+ fi lters, the grey line and white dots to the C– fi lters.
Ultra 2 capillary column and a Flame Ionization Detec-tor). Fatty acids with chain lengths of C3 to C20 were identifi ed by the MIDI microbial identifi cation system (MIDI, Inc. version 4.0) using TBSA40 and Eukary peak libraries. The fatty acids were grouped as indicated on Table 1. The total amount of PLFAs was converted to cell estimates assuming that, on average, bacteria contain 1 pmol of PLFA within 2x10⁴
cells (Green and Scow, 2000).
Meio- and macrofauna were collected from 2 L of pumped interstitial water fi ltered through a 180-µm mesh net. The fauna was preserved with formaldehyde (4 % fi -nal concentration) and extracted under a stereomicro-scope.
Data analysis and statistical methods
The impact of clogging intensity was tested using 3 way-analysis of variance (ANOVA) with clogging status, date and depths as main effects. When necessary, data were ln-transformed to homogenize variances. The 3-way ANOVAs were performed using Statistica 5 TM (Statsoft, Tulsa, Oklahoma).
Results
Results from fatty acid concentrations of the different bio-logical groups (Fig. 2), fatty acids of anaerobes (Fig. 3), invertebrate species richness (Fig. 4), and SEM observa-tions (Fig. 5) showed that fi lters were inhabited by a com-plex community of micro- and macro-organisms. The microbial community was composed mainly of bacteria (Fig. 2), as indicated by a relatively high abundance of branched fatty acids (used as bacterial markers, Table 1). The presence of dissolved oxygen in interstitial water was indicated by chemical measurements, and both aerobic and anaerobic bacterial markers were detected in all the fi lters. This result indicates the presence of anaerobic mi-cro-niches within the pore spaces. The prokaryotic com-munity was dominated by Gram-negative bacteria as shown by the high relative abundance of short chain mo-nounsaturated PLFA (Fig. 2). Vertical gradients of PLFA concentrations varied signifi cantly according to the clog-ging stage of the fi lter (Table 2). Higher PLFA contents were recorded in the surface of the C+ fi lters (Fig. 2). Based on published conversion factors, we calculated that the top layer contained 8.7 × 10⁷
bacterial cells g sed–1 and 6.4 × 10⁸
bacterial cells g sed–1
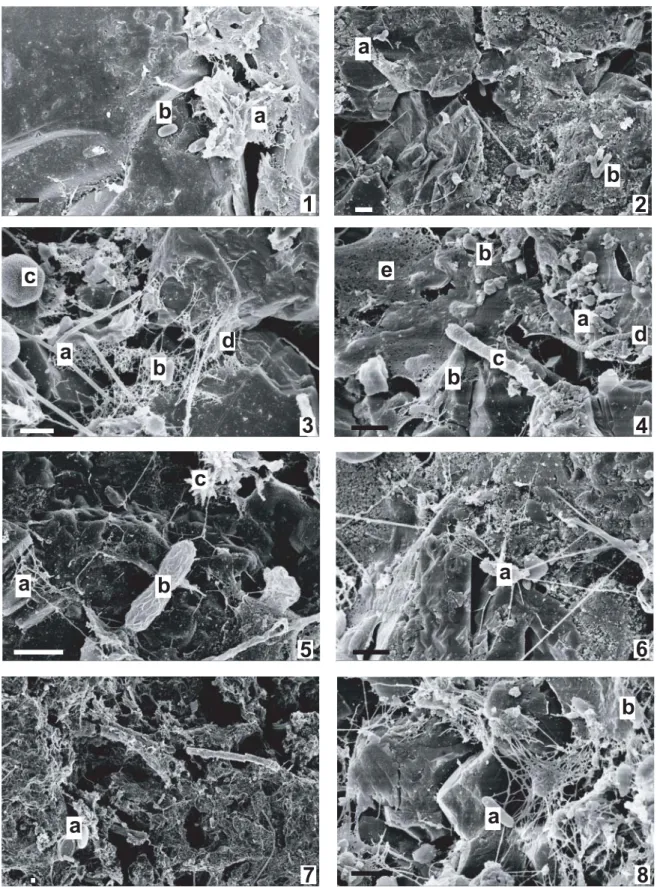
for C– and C+, respec-tively. The SEM pictures (Fig. 5) confi rmed the presence of an abundant microbial community. In C+ fi lters (Figs. 5, 4a,e, 6a, 8b), most of the bacteria were embedded in a thick EPS matrix, whereas the EPS matrix was less dense in C– fi lters (Figs. 5, 1b, 3b). Furthermore, while small carbonate precipitates were detected in the C-fi lters (Figs. 5, 3c, 5c), carbonate cementation between the sand grains
Table 1. Biomarker groups of PLFA. PLFA nomenclature is in the form A:BtC, where A designates the total number of carbons, B the number of double bounds and C the distance of the closest unsatura-tion from the aliphatic end of the molecule. The prefi xes “i” and “a” refer to iso- and anteiso-methyl branching, and mid-chain methyl branches are designated by “Me” preceded by the position of the branch from the acid end. The cyclopropyl ring is indicated as “cy”.
Gram-positive Terminally branched saturated (mainly i14:0, bacteria i15:0, a15:0, i16:0, i17:0, i18:0, i19:0, a19:0,
i21:0)
Gram-negative Short monounsaturated (mainly 15:1t6, 15: bacteria 1t7, 16:1t11, 16:1t7, 16:1t5, 17:1t8, 17:
1t6)
Anaerobes 10Me16:0, 17:1t6, cy17:0, cy19:0 Actinomycetes i14:1, i15:1,i16:1, i17:1, a17:1, i18:1, i19:1 Microeukaryota 18:3t6, 18:2t6, 18:1t9, 18:1t5. 10Me18:0,
20:4t6, 20:3t6
Fungi 18:3t6, 18:2t6, 18:1t9, 18:1t5. 10Me18:0 Protists 20:4t6, 20:3t6
Figure 2. Spatial variation of the biomarker groups in the top (0– 5 cm depth) and deep layers (15–20 cm depth) of the C+ and C– fi l-ters as averages with standard deviations for the three sampling dates (n = 9).
(Figs. 5, 2a) and calcifi cation of micro-organisms (Figs. 5, 4c) were observed in the C+ fi lters.
Faunal abundance showed similar spatial distribution to microbial abundance. In C+ fi lters, faunal abundance signifi cantly decreased with depth, whereas in C– fi lters no signifi cant vertical gradient was observed (Fig. 4 and Table 3). Although the bottom part of both fi lters con-tained similar densities of organisms, invertebrate
abun-within the system consisted of oligochaetes, which, like other taxa were more abundant in the top part of the C+ fi lters (Fig. 4). Micro-crustacea (cyclopoids, harpacti-coids and ostracods) represented 1–45 % of the fauna. The only macro-crustacean found, Asellus aquaticus, was rare and only present in the top layer of C– fi lters.
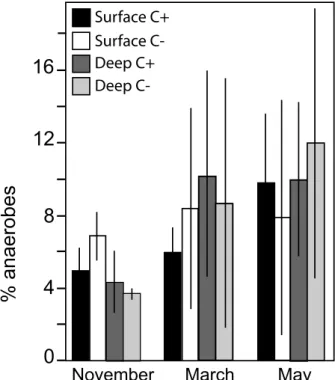
The 3-way ANOVAs indicated a signifi cant increase in microbial and faunal abundance and diversity with time, especially at the surface of the C+ fi lters (effect “date”, Table 2). The relative importance of anaerobes compared to the total amount of PLFA increased from about 4 % in November to 10 % in May, indicating the development of anaerobic microniches in sediments (Fig. 3). Furthermore, anaerobes changed over time according to the clogging intensity (effect of “date × clogging”, Table 2). In the C– fi lters, the percentage of anaerobes remained stable at the surface of the fi lters, whereas it regularly increased deeper. In C+ fi lters, similar develop-ment was observed between November and March, al-though on the last sampling date (May), the prevalence of anaerobes increased at the surface of sediment (Fig. 3). Similarly, the vertical gradients of Gram-positive and Gram-negative bacteria, actinomycetes, microeukaryo-tes, fungi, and protists were signifi cantly different ac-cording to the clogging intensity (effect of “depth × clog-ging”, Table 2). PLFA concentrations were higher in the top layers of C+ than in C– fi lters, whereas no signifi cant differences in PLFA contents were measured between C+ and C– fi lters in the deep layer. For the invertebrates, both nematode and micro-crustacean abundances were signifi cantly higher in clogged fi lters (effect “clogging”, Table 2).
Discussion
Biodiversity of the artifi cial infi ltrating porous media
The community structure of micro-organisms inhabiting the slow sand fi lters supports the results of other studies showing that Gram-negative bacteria are the most abun-dant microbial group in drinking water systems (Keinänen et al., 2003; Lahti, 1993; Payment et al., 1988; Smith et al., 2000). Eukaryotic markers did not represent the major part of the microbial community in terms of biomass, although they were detected in all the fi lters. Like Moll et al. (1999), we observed an increasing preva-lence of Gram-negative bacteria and microeukaryotes in our fi lters operating at low temperatures (between 4 to 8 °C). The identifi cation of 22:6t3, a biomarker of psy-chrophilic bacteria (Bowman et al., 2003), in nearly all the samples indicated that the microbial population living in the fi lters is well adapted to this particular environ-ment. Low temperature also affects the development of the invertebrates (Adam et al., 1998). Furthermore, the fi lters (indoor tanks) are completely isolated from natural Surface C+ Surface Deep C-Deep C+
0
4
8
12
% anaerobes
November
March
May
16
Figure 3. Spatial and temporal variation of the anaerobic biomark-ers relative to the total fatty acid concentrations in the top (0–5 cm depth) and deep (15–20 cm) layers of the C+ and C– fi lters as aver-age (n = 3).
Figure 4. Spatial variation of the fauna in the surface (20 cm) and deep (100 cm) layers of the C+ and C– fi lters as averages with stand-ard deviations for the three sampling dates (n = 9).
dance was signifi cantly higher in C+ fi lters (331 ind l–1 ) compared to C– fi lters (133 ind l–1
). Nematodes and oli-gochaetes always represented more than 50 % of the overall faunal abundance. The majority of the biomass
sediment ecosystems and fl ying adult insects. This par-ticular fi lter design may explain the relatively low abun-dance of invertebrates and the absence of insect larvae in these fi lters compared to the fauna communities in warm-er outdoor slow sand fi ltwarm-ers (Jellison et al., 2000, Wotton and Hirabayashi, 1999).
The studied fi lters are artifi cial systems characterized by a peculiar fauna that differed from that observed in the raw water, which contained mainly micro-crustaceans (Aeppli, 1990; Smart and Harper, 1999). Because of the ozone treatment, direct colonization is unlikely and the animals probably descended from individuals introduced during the sand fi lling. However, the ozone pretreatments do not impair development of organisms within the fi lters (Urfer and Huck, 1999; Foncesca et al., 2001; Moll et al.,
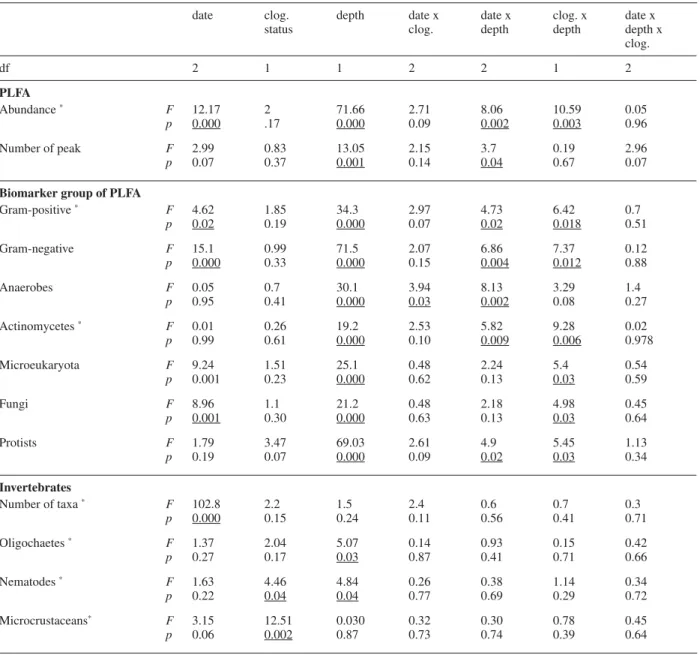
1998). Although SEM revealed the presence of numerous diatom skeletons (Figs. 4, 7a) and a structure looking like an extremely small Spirulina (Figs. 4, 4d), there was no evidence that the living microbial community established in the fi lters was derived from the lake. The cleaning procedure of the raw water (ozonation and rapid carbon fi ltration) appears to be highly effi cient since biomarkers of diatoms, microalgae and green algae, which are abun-dant in the lake of Zurich, were not detected. The absence of long-chain polyunsaturated fatty acids also confi rms the absence of phytoplankton in the fi lters. This result is consistent since the fi lters are maintained in the dark, preventing phototrophic activity. However, it is interest-ing to note that there is no direct relation between the phytoplankton bloom observed in the lake between the Table 2. ANOVA results table with date, clogging status and depth as tested effects. ∗ data log transformed, df degrees of freedom.
date clog. status depth date x clog. date x depth clog. x depth date x depth x clog. df 2 1 1 2 2 1 2 PLFA Abundance ∗ F p 12.17 0.000 2 .17 71.66 0.000 2.71 0.09 8.06 0.002 10.59 0.003 0.05 0.96 Number of peak F p 2.99 0.07 0.83 0.37 13.05 0.001 2.15 0.14 3.7 0.04 0.19 0.67 2.96 0.07 Biomarker group of PLFA
Gram-positive ∗ F p 4.62 0.02 1.85 0.19 34.3 0.000 2.97 0.07 4.73 0.02 6.42 0.018 0.7 0.51 Gram-negative F p 15.1 0.000 0.99 0.33 71.5 0.000 2.07 0.15 6.86 0.004 7.37 0.012 0.12 0.88 Anaerobes F p 0.05 0.95 0.7 0.41 30.1 0.000 3.94 0.03 8.13 0.002 3.29 0.08 1.4 0.27 Actinomycetes ∗ F p 0.01 0.99 0.26 0.61 19.2 0.000 2.53 0.10 5.82 0.009 9.28 0.006 0.02 0.978 Microeukaryota F p 9.24 0.001 1.51 0.23 25.1 0.000 0.48 0.62 2.24 0.13 5.4 0.03 0.54 0.59 Fungi F p 8.96 0.001 1.1 0.30 21.2 0.000 0.48 0.63 2.18 0.13 4.98 0.03 0.45 0.64 Protists F p 1.79 0.19 3.47 0.07 69.03 0.000 2.61 0.09 4.9 0.02 5.45 0.03 1.13 0.34 Invertebrates Number of taxa ∗ F p 102.8 0.000 2.2 0.15 1.5 0.24 2.4 0.11 0.6 0.56 0.7 0.41 0.3 0.71 Oligochaetes ∗ F p 1.37 0.27 2.04 0.17 5.07 0.03 0.14 0.87 0.93 0.41 0.15 0.71 0.42 0.66 Nematodes ∗ F p 1.63 0.22 4.46 0.04 4.84 0.04 0.26 0.77 0.38 0.69 1.14 0.29 0.34 0.72 Microcrustaceans∗ F p 3.15 0.06 12.51 0.002 0.030 0.87 0.32 0.73 0.30 0.74 0.78 0.39 0.45 0.64
Figure 5. Scanning electron micrographs of sediment from the slow sand fi lters (top layer): C– fi lters (odd numbers) and C+ fi lters (even numbers). Picture 1a- EPS fi lling the space between sand grains, 1b- bacteria, 2a- carbonate precipitation cementing the space between sand grain, 2b- bacteria, 3a- fungal hyphae, 3b- bacteria, 3c- calcite precipitation, 3d- fi ne EPS deposit, 4a- small bacterial cocci embedded in EPS, 4b- bacteria rod embedded in EPS, 4c- calcifi ed microorganisms, 4d- “nano spirulina”, 5a- fi ne EPS fi lm, 5b- bacteria covered by fi ne EPS, 5c- carbonate precipitate, 6a- bacteria covered by a dense EPS accumulation, 7a- diatom skeleton, 8a- bacteria free of EPS, 8b- bacte-ria embedded in EPS.
a
b
1
a
b
2
c
b
a
d
3
d
a
b
c
e
b
4
a
6
a
b
c
5
a
7
a
b
8
b
a
b
a
a
a
a
a
a
b
b
b
7
c
c
c
d
b
a
b
d
e
1
2
4
5
6
8
3
In column experiments, the addition of heterotrophic na-nofl agellates or amoebae merely delayed the occurrence of clogging (DeLeo and Baveye, 1997; Weber-Shirk and Dick, 1999; Mattison et al., 2002), probably by grazing on attached bacteria. However, in our study, predator abundances were signifi cantly higher at the surface of C+ fi lters. This fi nding demonstrates that predation was not suffi cient to reduce bacterial growth. In complex environ-ments such as slow sand fi lters, the increase of predation stimulated microbial growth, which in turn reduced hy-draulic conductivity. Furthermore, grazing might weaken adhesion of bacterial colonies (Honda and Matsumota, 1983; Cullimore and Mansuy, 1987). The resulting bio-fi lm detachment and subsequent bio-fi ltration of clumps at strategic points such as pore constriction could explain the observed accelerated clogging (Taylor and Jaffé, 1990).
As with predation, invertebrate activities have been related to increases and decreases in hydraulic conductiv-ity (Eder, 1982; Torreiter et al., 1994). Macroinverte-brates, such as nematodes or oligochaetes, generate bio-genic structures, bioirrigation and various types of sediment reworking. Collectively, these processes, termed bioturbation, take place at the inhabited part of the benthic habitat (Gerino et al., 1999) and can favour water infi ltration by producing tubes and galleries in the clogged layers of sand fi lters. Although in our study, the sampling point of microorganisms and invertebrates only overlapped at 20 cm depth and densities of invertebrates were probably too low to signifi cantly affect hydraulic conductivity, bioturbator abundance was positively cor-related with reduction of hydraulic conductivity. This correlation was probably the result of a trophic interac-tion between micro- and macro-fauna; as invertebrates living in sediments mostly feed on biofi lm associated with particles (see review in Boulton, 2000), the stimulat-ing effect of cloggstimulat-ing on the density of micro-organisms may have also favoured the development of macroinver-tebrates. Furthermore, invertebrates may have stimulated the microbial growth by modifying the chemical environ-ment of the interstitial habitat, keeping the microbial communities in a growing state, and excreting nutrients into the system (Yingst and Rhoads, 1980; Aller, 1994; Griebler, 1996; Traunspurger et al., 1997; Mermillod-Blondin et al., 2004).
Conclusion
Biological communities inhabiting sand fi lters comprise organisms from bacteria to invertebrates, that belong to different trophic levels. The study of fi lters with different clogging intensities demonstrated that the community structure of both prokaryotes and eukaryotes depends on the rate of fi ltration. The reduction of hydraulic conduc-March and May sampling and the microbial community
established in the fi lters.
Clogging processes and biological responses
As hypothesised, the increase of clogging provoked sig-nifi cant changes in the abundance and diversity of prokaryotes and eukaryotes, and appeared to stimulate microbial activity. Several studies demonstrated that mi-crobial growth is related to hydrodynamics in porous media (Molz et al., 1986; Murphy et al., 1997) and pre-dicted that a reduction of the hydraulic conductivity pro-longed the contact between fl owing water and biofi lms, stimulating the incorporation of the nutrients transported by water in the top layer of clogged systems. Such nutri-ent incorporation thus produced a positive feedback to the clogging process by stimulating the bacterial devel-opment in the surface layer of sediments. Furthermore, the bacterial stimulation may also increase the clogging process by facilitating the carbonate precipitation. As there was more biofi lm in the clogged fi lter, it is expected that anaerobes would develop better in the C+ fi lters than in C– fi lters. Although the smell of H2S was never de-tected during the sampling, the presence of 10Me16:0, a biomarker of Desulfovibrio species (Edlund et al., 1985), indicated that part of the microbial community reduced sulfate. The possible shift of the microbial community towards sulphate-reducing activity has implications for carbonate precipitation. Although aerobic oxidation fa-vours the carbonate dissolution by releasing carbon diox-ide, anaerobic oxidation by sulphate-reducing bacteria at pH 8 favours carbonate precipitation by production of bicarbonate. This hypothesis is confi rmed by SEM obser-vation of the sand samples (Fig. 5). Previous observa-tions demonstrated that carbonate precipitate occupied a similar pore volume to the exopolymeric substances in our fi lters (Mauclaire et al., 2004). Furthermore, the pres-ence of hydrogen sulfi de may provoke the precipitation of iron and manganese. This phenomenon, reported in similar fi ltration systems (Vandenabeele et al., 1992), was not observed in the Zurich-Lengg fi lters.
The source of bioclogging in porous media is usually biofi lm that grows on the surface of grains and is smaller than a millimeter. The biofi lm volume estimates (Mau-claire et al., 2004) were confi rmed by SEM observations (Fig. 5): the EPS were more abundant and thicker in the C+ than in the C– fi lters. Furthermore, fungi and actino-mycetes, which grow as fi laments, can occupy many pores with dimensions approaching the centimetre scale (Dupin and McCarty, 1999). Presence of fungal hyphae was confi rmed by SEM observations (Figs. 5, 3a). In the C+ fi lters, fungi and actinomycetes biomarkers were more abundant than in C– fi lters, further favouring bioc-logging.
Protists in porous media have been used to account both for hydraulic conductivity increases and decreases.
tivity could be interpreted as an early stage of sand dia-genesis with accumulation of biomass within the pore space and the development of a complex community of micro- and macro-organisms. Furthermore, the shift of microbial community from aerobic to anaerobic condi-tions might favor carbonate precipitation and thus the clogging process.
This study suggests approaches to prevent or minimize the clogging of the sand fi lter and obtain more sustaina-ble management. The microbial activity within the fi lter was limited by the intense pre-treatment of the infi ltrated lake water and the design of the fi lter. As these physical and chemical limitations did not completely prevent clogging, we speculate that the presence of organisms grazing on biofi lm such as protists (Mattison et al., 2002) and invertebrates might help prevent clogging. In the present study, invertebrate density was low and essen-tially linked to the occurrence of microorganisms. Such low densities were probably not suffi cient to modify the clogging status of the fi lters. We can speculate that the introduction of higher densities (e. g. 10.000 individuals per m2
or more than 1000 individuals per liter) of inverte-brates such as tubifi cid worms could minimize the clog-ging process due to grazing and bioturbation. Introduc-tion of invertebrates which produce galleries in the sediments (Mermillod-Blondin et al., 2005; Rogaar, 1980) could maintain the hydraulic conductivity of the system. Such biological treatment has, however, never been tested and future research on clogging of sand fi lter should consider that metazoans could help to maintain the hydrological functioning of fi ltration systems.
Acknowledgments
The authors would like to thank Prof. Dr. J. Zeyer head of the Soil Biology group (ETHZ) for initiating this work, Dr. M. Mueller of the Institute of Applied Physics (ETHZ) for the SEM study, and K. Sutter & R. Stettler from Zurich Water Supply for their warm welcome and help. We are grateful to Andrew Boulton and two anony-mous reviewers for their very insightful comments.
References
Adam, K, R. G. M. Heath and M. C. Steynberg, 1998. Invertebrates as biomonitors of sand-fi lter effi ciency. Water Science Associa-tion 24: 43–48.
Aeppli, J. 1990. Appearance of invertebrates in slow sand fi lters and reservoirs of the Zurich Switzerland Water Supply. Aqua 39: 48–55.
Aller, R. C., 1994. Bioturbation and remineralization of sedimentary organic matter: effects of redox oscillation. Chemical Geology 114: 331–345.
Boulton, A. J., 2000. The functional role of the hyporheos. Verhand-lungen der Internationalen Vereinigung für Theorische und An-gewardte Limnologie 27: 51–63.
Bou, C. and R. Rouch, 1967. Un nouveau champ de recherches sur la faune aquatique souterraine. Comptes rendus de l’Academie des Sciences de Paris 265: 369–370.
Bowman, J. P., S. A. McCammom, J. A. E. Gibson, L. Robertson and P. D. Nichols, 2003. Prokaryotic metabolic activity and community structure in Antarctic continental shelf sediments. Applied and Environmental Microbiology 69: 2448–2462. Cullimore, D. R. and N. A. Mansuy, 1987. A screen arc model well
to simulate iron bacterial fouling. Journal of Microbiological Methods 7: 225–232.
DeLeo, P. C. and P. Baveye, 1997. Factors affecting protozoan pre-dation of bacterial clogging laboratory aquifer microcosms. Geomicrobiology Journal 14: 127–152.
Dupin, H. J. and P. L. McCarty, 1999. Mesoscale and microscale observations of biological growth in a silicon pore imaging ele-ment. Environmental Science and Technology 33: 1230–1236. Eder, R., 1982. The role of nematodes in sand fi ltration processes.
Stygo News 3: 20–22.
Edlund, A., P. D. Nichols, R. Roffey and D. C. White, 1985. Extract-able and lipopolysaccharide fatty-acid and hydroxy acid pro-fi les from Desulfovibrio species. Journal of Lipid Research 26: 982–988.
Engstrom, D. R., S. C. Fritz, J. E. Almendinger and S. Juggins, 2000. Chemical and biological trends during lake evolution in recently deglaciated terrain. Nature 408: 161–166.
Fonseca, C. A., R. A. Summers and M. T. Hernandez, 2001. Com-parative measurements of microbial activity in drinking water biofi lters. Water Research 16: 3817–3824.
Gerino, M., G. Stora and O. Weber, 1999. Evidence of bioturbation in the Cap-Ferret Canyon in the deep northeastern Atlantic. Deep-Sea Research part II- Topical Studies in Oceanography 46: 2289–2307.
Green, C. T. and K. M. Scow, 2000. Analysis of phopholipid fatty acids (PLFA) to characterize microbial communities in aqui-fers. Hydrogeology Journal 8: 126–141.
Griebler, C., 1996. Some applications for the DMSO-reduction method as a new tool to determine the microbial activity in wa-ter-saturated sediments. Archiv für Hydrobiologie Supplement 113: 405–410.
Honda, Y. and J. Matsumoto, 1983. The effect of temperature on the growth of microbial fi lm in a model trickling fi lter. Water Re-search 17: 375–382.
Keinänen, M. M., P. J. Martikainen, L. K. Korhonen and M. Suutari, 2003. Microbial community structure in biofi lms and water of a drinking water distribution system determined by lipid biomar-kers. Water Science and Technology 47: 143–147.
Jellison, K. L., R. I. Dick and M. L. Weber-Schirk, 2000. Enhanced ripening of slow sand fi lters. Journal of Environmental Engi-neering – ASCE 126: 1153–1157.
Lahti, K., 1993. Microbial quality of drinking water in some Finnish distribution systems. Water Science and Technology 2: 151–154. Mattison, R. G., H. Taki and S. Harayama, 2002. The bacterivorous
soil fl agellate Heteromita globosa reduces bacterial clogging under denitrifying conditions in sand fi lled aquifer columns. Applied and Environmental Microbiology 68: 4539–4545. Mauclaire, L., O. Pelz, W.-R. Abraham and J. Zeyer, 2003.
Assimi-lation of toluene carbon along a bacteria-protist food chain de-termined by 13
C-enrichment of biomarker fatty acids. Journal of Microbiological Methods 55: 635–649.
Mauclaire, L., A. Schürmann, M. Thullner, S. Gammeter and J. Zeyer, 2004. Sand fi ltration in water treatment plant: biological parameters responsible for clogging. Journal of Water Supply Research and Technology – Aqua 53: 93–107.
Mermillod-Blondin, F., J. P. Gaudet, M. Gerino, G. Desrosiers, J. Jose and M. Creuzé des Châtelliers, 2004. Relative infl uence of bioturbation and predation on organic matter processing in river sediments: A microcosm experiment. Freshwater Biology 49: 895–912.
Mermillod-Blondin, F., G. Nogaro, T. Datry, F. Malard and J. Gib-ert, 2005. Do tubifi cid worms infl uence the fate of organic
mat-ter and pollutants in stormwamat-ter sediments? Environmental Pollution 134: 57–69.
Moll, D. M., R. S. Summers and A. Breen, 1998. Microbial charac-terization of biological fi lters used for drinking water treatment. Applied and Environmental Microbiology 64: 2755–2759. Moll, D. M., R. S. Summers, A. C. Foncesca and W. Matheis, 1999.
Impact of temperature on drinking water performance and mi-crobial community structure. Environmental Science and Tech-nology 33: 2377–2382.
Molz, F. J., M. A. Widdowson and L. D. Benefi eld, 1986. Simulation of microbial-growth dynamics coupled to nutrient and oxygen-transport in porous-media. Water Resource Research 22: 1207–1216.
Murphy, E. M., T. R. Ginn, A. Chilakapati, C. T. Resch, J. L. Phil-lips, T. W. Wietsma and C. M. Spadoni, 1997. The infl uence of physical heterogeneity on microbial degradation and distribu-tion in porous media. Water Resource Research 33: 1087– 1103.
Payment, P., F. Gamache and G. Paquette, 1988. Microbial and viro-logical analysis of water from two water fi ltration plants and their distribution systems. Canadian Journal of Microbiology 34: 1304–1309.
Rogaar, H., 1980, The morphology of burrow structures made by tubifi cids. Hydrobiologia 71: 107–124.
Smart, A. C. and D. M. Harper, 1999. Life after lakes: the ecology and management of the water distribution network. Hydrobio-logia 395/396: 379–386.
Smith, C. A., C. B. Phiefer, S. J. Macnaughton, A. Peacock, R. S. Burkhalter, R. Kirkegaard and D. C. White, 2000. Quantitative lipid biomarker detection of unculturable microbes and chlorine
exposure in water distribution system biofi lms. Water Research 34: 2683–2688.
Taylor, S. W. and R. R. Jaffé, 1990. Biofi lm growth and related changes in the physical properties of a porous media. 1. Experi-mental investigations Water Resources Research 26: 2153– 2159.
Torreiter, P., P. Pitaksintorn-Watanamahart and D. L. Danielopol, 1994. The activity of oligochaetes in relation to their ecological role in slow fi ltration columns. In Stanford, J. A. and H. M. Valett, (eds) Second International Conference on Ground Water Ecology. US EPA & American Water Resources Association, Herndon, Virginia, Atlanta, Georgia, 85–94.
Traunspurger, W., M. Bergtold and W. Goedkoop, 1997. The effects of nematodes on bacterial activity and abundance in a freshwa-ter sediment. Oecologia 112: 118–122.
Urfer, D. and P. M. Huck, 1999. A study of the impacts of periodic ozone residuals on biologically active fi lters. Ozone Science and Engineering 22: 77–97.
Vandenabeele, J., D. De Beer, R. Gremonpre and W. Werstraete, 1992. Manganese oxidation by microbial consortia from sand fi lters. Microbial Ecology 24: 91–108.
Weber-Shirk, M. L. and R. I. Dick, 1999. Bacterivory by a chryso-phyte in slow sand fi lters. Water research 33: 631–638. Wotton, R. S. and K. Hirabayashi, 1999. Midge larvae (Diptera,
Chirononmidae) as engineers in slow sand fi lter beds. Water Research 33: 1509–1515.
Yingst, J. Y. and D. C. Rhoads, 1980. The role of bioturbation in the enhancement of microbial turnover rates in marine sediments. In Tenore, K. R. C. and B. C. Coull (eds), Marine Benthic Dynam-ics. University of South Carolina Press, Columbia, 407–422.