RESEARCH PAPER
Quantification of plasma carnitine and acylcarnitines
by high-performance liquid chromatography-tandem
mass spectrometry using online solid-phase extraction
Réjane Morand&Massimiliano Donzelli&
Manuel Haschke&Stephan Krähenbühl
Received: 12 July 2013 / Revised: 12 August 2013 / Accepted: 13 August 2013 / Published online: 1 September 2013 # Springer-Verlag Berlin Heidelberg 2013
Abstract Carnitine is an amino acid derivative that plays a key role in energy metabolism. Endogenous carnitine is found in its free form or esterified with acyl groups of several chain lengths. Quantification of carnitine and acylcarnitines is of particular interest for screening for research and metabolic disorders. We developed a method with online solid-phase extraction coupled to high-performance liquid chromatogra-phy and tandem mass spectrometry to quantify carnitine and three acylcarnitines with different polarity (acetylcarnitine, octanoylcarnitine, and palmitoylcarnitine). Plasma samples were deproteinized with methanol, loaded on a cation ex-change trapping column and separated on a reversed-phase C8 column using heptafluorobutyric acid as an ion-pairing reagent. Considering the endogenous nature of the analytes, we quantified with the standard addition method and with external deuterated standards. Solid-phase extraction and sep-aration were achieved within 8 min. Recoveries of carnitine and acylcarnitines were between 98 and 105 %. Both quanti-fication methods were equally accurate (all values within 84 to 116 % of target concentrations) and precise (day-to-day
variation of less than 18 %) for all carnitine species and concentrations analyzed. The method was used successfully for determination of carnitine and acylcarnitines in different human samples. In conclusion, we present a method for simultaneous quantification of carnitine and acylcarnitines with a rapid sample work-up. This approach requires small sample volumes and a short analysis time, and it can be applied for the determination of other acylcarnitines than the acylcarnitines tested. The method is useful for applications in research and clinical routine.
Keywords Liquid chromatography/mass spectrometry . Online solid-phase extraction . Carnitine . Acylcarnitines
Introduction
Carnitine is an endogenous compound that plays a crucial role in energy metabolism. Carnitine is essential for the transport of long-chain fatty acids into the mitochondrial matrix for subsequent β-oxidation [1] and for the regulation of the cellular coenzyme A (CoA) and acyl-CoA pools [2,3]. These functions of carnitine involve the acylation of itsβ-hydroxyl group, leading to the formation of various acylcarnitines with different chain lengths [4].
Analytical profiling of carnitine and its acyl derivatives is used for instance to screen newborns and children for metabolic disorders, to monitor patients at risk for or with established hypocarnitinemia [5], and in research projects about energy metabolism [3,6,7]. Primary carnitine deficiency is a rare inherited disease which is caused by mutations in the gene coding for OCTN2, the renal carnitine transporter [8,9]. Secondary carnitine deficiency is observed more frequently for instance in patients with organic acidurias [10, 11] and in patients on hemodialysis [7,12].
Réjane Morand and Massimiliano Donzelli contributed equally to this work.
Electronic supplementary material The online version of this article (doi:10.1007/s00216-013-7309-z) contains supplementary material, which is available to authorized users.
R. Morand
:
M. Donzelli:
M. Haschke:
S. Krähenbühl (*) Clinical Pharmacology and Toxicology, University Hospital Basel, Spitalstrasse 21/ Petersgraben 4, 4031 Basel, Switzerland e-mail: [email protected]R. Morand
:
M. Donzelli:
M. Haschke:
S. KrähenbühlDepartment of Biomedicine, University of Basel, Hebelstrasse 20, 4031 Basel, Switzerland
S. Krähenbühl
Swiss Center for Applied Human Toxicology (SCAHT), University of Basel, Klingelbergstrasse 61, 4056 Basel, Switzerland
Chromatographic methods for the quantification of car-nitine and acylcarcar-nitines in plasma use either HPLC or capillary electrophoresis for separation and mostly MS/MS for detection and quantification [13]. Sample preparation can consist of several steps such as solid-phase extraction [14–17] and esterification of carnitine and acylcarnitines at their carboxyl groups with different alcohols to enhance sensitivity [13,15,18]. Sample processing is time consum-ing and imprecisions can potentially arise from incomplete derivatization and/or hydrolysis of acylcarnitines during the derivatization process [19].
Considering the endogenous nature of carnitine and acylcarnitines, their quantification is mainly achieved with surrogate matrices, such as dialyzed plasma or an albumin solution [17] or with surrogate analytes, such as deuterated compounds [13,15,17]. Both approaches use substitute pa-rameters for the original matrix or analytes so that compara-tive studies are required to ensure the validity of the method [20]. In addition, deuterated compounds are expensive and may not be available for all acylcarnitines.
For the analysis of clinical and research samples, time, accuracy, and precision are important factors. Our principal goal was to improve our existing method for plasma carnitine and acylcarnitine analysis [17] by minimizing the time used for sample preparation and by optimizing the quantification procedure. A first specific aim was to establish a simple sample work-up including a precipitation step followed by an online extraction procedure and LC-MS/MS for separation and quantification. A second specific aim was to eliminate the impact of matrix effects on quantification, which can be a problem for carnitine and acylcarnitines in biological matrices [17,21]. For that, we compared two methods, namely quanti-fication using deuterated external standards and quantiquanti-fication by the standard addition method (SAM). The newly developed methods were fully validated and compared mutually as well as with the conventional radioenzymatic method [22, 23]. Furthermore, the practicability of the methods was demon-strated by the analysis of clinical samples.
Materials and methods Reagents
L-carnitine,L-acetylcarnitine, andL-palmitoylcarnitine were
pur-chased from Sigma (St. Louis, MO, USA).L-octanoylcarnitine was obtained from Dr. H. J. ten Brink (VU Medical Center, Amsterdam, The Netherlands).L-carnitine-d3,L
-acetylcarnitine-d3, L-octanoylcarnitine-d3, and L-palmitoylcarnitine-d3 were supplied by Cambridge Isotope Laboratories (Andover, MA, USA).
All other chemicals and solvents were from Merck (Darmstadt, Germany) or Sigma and were of analytical grade.
LC/MS-MS equipment
The HPLC system consisted of a HTS PAL autosampler (CTC Analytics AG, Zwingen, Switzerland), a column-oven (CTO-20A), a quaternary pump (LC-20AD) and a system controller (CBM-20A) from Shimadzu (Reinach, Switzerland). The HPLC system was coupled to an API4000 triple quadrupole mass spectrometer from AB/MDS Sciex (Concord, Canada) with an electrospray ionization source.
Samples were loaded on an Oasis MCX trapping column (30μm, 2.1×20 mm; Waters Corporation, Milford, MA, USA)
and separated on a Luna C8 5 μm column (150×2 mm)
equipped with a C8 (4×2.0 mm) precolumn (Phenomenex, Torrance, CA, USA).
Sample preparation and carnitine determination by LC/MS-MS
Blood samples were collected in tubes containing lithium heparin. Plasma was obtained after centrifugation at 1,811×g for 10 min and stored at−20 °C until analysis.
HPLC conditions
The chromatographic separation was done with a binary flow at 50 °C. Phase A was an aqueous solution containing 5 mmol/L heptafluorobutyric acid and 5 mmol/L ammonium acetate and phase B was methanol with the same additives. During 1.5 min, the analytes were loaded on the trapping column using 0.1 % formic acid in water (V/V) as mobile phase (flow, 0.5–1.0 mL/min), whereas the analytical column was conditioned with 10 % phase B (flow, 0.35 mL/min). After valve switching, the analytes were transferred to the ana-lytical column starting at 10 % phase B with a linear increase of the gradient to 95 % phase B within 4 min. After a plateau of 2 min at 95 % phase B, the analytical column was re-equilibrated for 2 min with 10 % B. This resulted in a total run time of 8 min. The chromatographic conditions are shown in Electronic supplementary material Fig. S1.
MS conditions
Carnitine and the acylcarnitines of interest were analyzed in the positive multiple reaction monitoring mode. A first transition was used for quantification, a second one for qualification. Following transitions (m/z) were used: carnitine, 162→103 and 162→60; carnitine-d3, 165→103 and 165→63; acetylcarnitine, 204→85 and 204→145; acetylcarnitine-d3, 207→85 and 207→145; octanoylcarnitine, 288→85 and 288→229; octanoylcarnitine-d3, 291→85 and 291→229; palmitoylcarnitine, 400→85 and 400→341; and palmitoylcarnitine-d3, 403→85 and 403→341, respectively.
The ion spray voltage was 5,500 eV; the probe temperature was 450 °C, and the dwell time was 50 ms for each analyte. Quantification with the SAM
Plasma samples to be analyzed were divided in five aliquots of 10μL. To each of the 10-μL aliquots, 0 to 40 μL of standard solution in methanol was added in 10μL steps. The volume of all samples was brought to 50μL with methanol. Standards were prepared in methanol and contained (final concentra-tions): carnitine, 10–40 μmol/L; acetylcarnitine, 5–20 μmol/L; octanoylcarnitine, 0.25–1.0 μmol/L; and palmitoylcarnitine,
0.25–1.0 μmol/L. Afterwards, the plasma samples were
deproteinized with the addition of 200μL methanol. The sam-ples were extracted for 10 min at full speed on a Multi-tube Vortexer (VX-2500, VWR International) and centrifuged at 3,220×g for 30 min.
For the determination of total carnitine, acylcarnitines were hydrolyzed under alkaline conditions; 25μL plasma was
mixed with 25μL KOH 0.5 M (pH 13) and incubated at
40 °C for 30 min. The mixture was then neutralized with 50μL at 1 % formic acid in water (V/V) and centrifuged for 10 min at 1,811×g .
After quantification, the LC/MS-MS peak areas were fitted to the added concentrations and the endogenous concentration was calculated as the intercept of this curve on the x -axis. Quantification with external deuterated standards (deuterated standard method)
For this type of quantification, we constructed an external calibration curve using the peak areas from deuterated stan-dards in pooled plasma. Pooled plasma was spiked with deu-terated compounds in the following concentration ranges (final concentrations): carnitine-d3, 1–100 μmol/L; acetylcarnitine-d3, 0.25–50 μmol/L; octanoylcarnitine-acetylcarnitine-d3, 0.025–10 μmol/L; and palmitoylcarnitine, 0.05-10μmol/L. These plasma samples (10μL) were then mixed with 200 μL methanol. After 10 min shaking, the samples were centrifuged at 3,220×g for 30 min and analyzed as described above.
Unspiked plasma samples were prepared identically and the analyte concentration in these samples was calculated using the calibration curve obtained with the deuterated stan-dards. The sample and standard work-up for total carnitine was identical as described for the SAM.
Quantification with the radioenzymatic method
The radioenzymatic method was used for hydrolyzed samples as a comparison with the two LC/MS-MS methods. The radioenzymatic method used by us [23] is based on the method described by Brass and Hoppel [22].
Validation of the method
We determined accuracy and precision of both the SAM and the deuterated standard method (DSM). Given the endoge-nous nature of carnitine and its derivatives and the lack of blank plasma, we used spiked plasma samples for these determinations.
For the validation of the SAM, pooled plasma was spiked with three concentrations of carnitine, acetylcarnitine, octanoylcarnitine, and palmitoylcarnitine (low-, medium-, and high-quality controls (QC)). These samples contained the unknown endogenous concentration of the pooled plasma plus 12.5, 25, or 37.5μmol/L carnitine; 3, 6, or 9 μmol/L acetylcarnitine; 0.03, 0.06, or 0.09μmol/L octanoylcarnitine;
and 0.125, 0.25, or 0.375 μmol/L palmitoylcarnitine,
respectively.
For the validation of the DSM, pooled plasma was spiked with three concentrations of deuterated carnitine, acetylcarnitine, octanoylcarnitine, and palmitoylcarnitine. The added concentrations were 1.25, 12.5, or 125 μmol/L for carnitine-d3; 0.4, 4, or 40μmol/L for acetylcarnitine-d3; 0.08, 0.8, or 8μmol/L for octanoylcarnitine-d3; and 0.08, 0.8, or 8μmol/L for palmitoylcarnitine.
For total carnitine, the samples were hydrolyzed and the concentration determined using the SAM. For comparison, the same samples were also determined using the radioenzymatic assay [22,23].
Recovery was assessed with three concentrations of the four analytes spiked before or after the protein precipitation step. For the assessment of short-term stability, samples were spiked, stored at room temperature for 8 h, analyzed, and compared with freshly spiked samples. For stability under storage conditions, samples were spiked and kept frozen
at −20 °C for 1 week. The samples were then analyzed
and compared with freshly spiked plasma samples. For freeze/thaw stability, freshly prepared samples were frozen at−20 °C for at least 12 h and then thawed at room temper-ature for 30 min. After three freeze–thaw cycles, the samples were analyzed and compared with freshly prepared samples. To determine the stability of the analytes in solution, freshly made stock solutions were analyzed and compared with stock solutions that had been stored at−20 °C for 4 months.
The lower limit of quantification was defined as the lowest concentration measured with precision and accuracy not exceeding 20 % with a signal to noise ratio of >10. Source of biological samples
To test the practical application of the method, two types of plasma samples were obtained and analyzed. Samples were obtained from two infants with medium-chain acyl-CoA de-hydrogenase deficiency and from a healthy 58-year-old man exercising until exhaustion. Exhaustive exercise was
performed on a cycling ergometer, starting at a workload of 220 W with increases of 20 W every 2 min. Exhaustion was achieved after having finished the 380 W workload phase. Samples were obtained before exercise, in the middle of every workload phase, and during the recovery phase up to 15 min after termination of exercise.
Results and discussion
Probe preparation and analyte separation
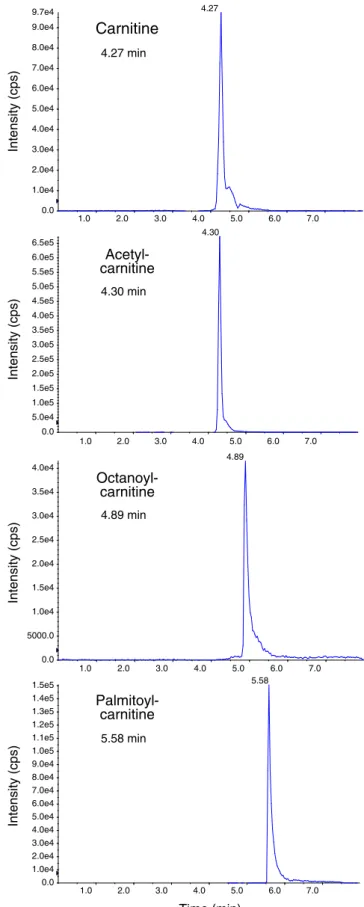
A first aim of the current project was to develop a rapid and reliable method with a one-step sample preparation that could potentially be automated. Such methods usually have an initial protein precipitation step which is followed by direct applica-tion of the supernatant on the HPLC system and on-column clean-up of the sample. Online solid-phase extraction coupled to chromatographic separation in one run conciliates the ad-vantages of solid-phase extraction with time efficiency. In several publications, online solid-phase extraction followed by LC-MS has been described for the analysis of carnitine and certain acylcarnitines. Ho et al. [21] reported a procedure for the analysis of free and total carnitine, whereas Hirche et al. [24] described a method for the analysis of carnitine, acetylcarnitine, and propionylcarnitine and for the carnitine precursors butyrobetaine and trimethyllysine. Goshal et al. [25] published a method for the analysis of carnitine and acylcarnitines from C2 to C18 and at the same time demon-strated their clinical applicability. The run time of the HPLC step was 17 min for this method, however, which we consid-ered too long. As shown previously [16], the addition of heptafluorobutyric acid as an ion-pairing agent to the HPLC solvents results in sharper peaks and allows achieving a good separation. We followed this strategy and achieved a sufficient separation of carnitine, butyrobetaine, and acylcarnitines from C2 to C18 within 6 min, resulting in a total run time of 8 min (Fig.1; Electronic supplementary material (ESM) Fig. S2). This run time is longer than the 4.5 min described by Ho et al. [21], but Ho et al. only analyzed free and total carnitine and not acylcarnitines. In comparison, run times were between 16 and 75 min in other published methods analyzing carnitine and acylcarnitines [14,15,17,25].
Offline solid-phase extraction after the initial protein pre-cipitation step is a frequently used alternative [14–17,26] for the online procedure that we used in the current study. As carnitine and acylcarnitines are cations under acidic condi-tions, matrices with cation exchange properties are preferred to optimize retention [15,17]. This is the reason why we also used a cation exchanger for online sample clean-up in the current study. While offline solid-phase extraction can enhance the sensitivity of the chromatographic assays, the process is usually time-consuming and difficult to automate.
1.0 2.0 3.0 4.0 5.0 6.0 7.0 0.0 1.0e4 2.0e4 3.0e4 4.0e4 5.0e4 6.0e4 7.0e4 8.0e4 9.0e4 9.7e4 4.27 1.0 2.0 3.0 4.0 5.0 6.0 7.0 0.0 5.0e4 1.0e5 1.5e5 2.0e5 2.5e5 3.0e5 3.5e5 4.0e5 4.5e5 5.0e5 5.5e5 6.0e5 6.5e5 4.30 1.0 2.0 3.0 4.0 5.0 6.0 7.0 0.0 5000.0 1.0e4 1.5e4 2.0e4 2.5e4 3.0e4 3.5e4 4.0e4 4.89 1.0 2.0 3.0 4.0 5.0 6.0 7.0 0.0 1.0e4 2.0e4 3.0e4 4.0e4 5.0e4 6.0e4 7.0e4 8.0e4 9.0e4 1.0e5 1.1e5 1.2e5 1.3e5 1.4e5 1.5e5 5.58 Palmitoyl-carnitine Carnitine Acetyl-carnitine Octanoyl-carnitine Time (min) Intensity (cps) Intensity (cps) Intensity (cps) Intensity (cps) 4.27 min 4.30 min 4.89 min 5.58 min
Fig. 1 Representative LC-MS/MS multiple reaction monitoring chromato-grams of carnitine, acetylcarnitine, octanoylcarnitine, and palmitoylcarnitine standards. HPLC and MS conditions are described in the“Materials and methods”
As already published previously [16, 17], we prefer to analyze carnitine and acylcarnitines without prior derivatiza-tion. Frequently used derivatization procedures include the formation of the methyl [13] or the butyl ester [18] as well as the formation of the pentafluorophenacyl ester [15]. These procedures use more time for sample preparation than a sim-ple precipitation step, can therefore be less well automated and butylation has the disadvantage that acylcarnitines may be hydrolyzed during esterification [19]. Conversely, they have the advantage to be more specific for the separation of acylcarnitines with the same molecular mass [15].
Recovery and stability of the analytes
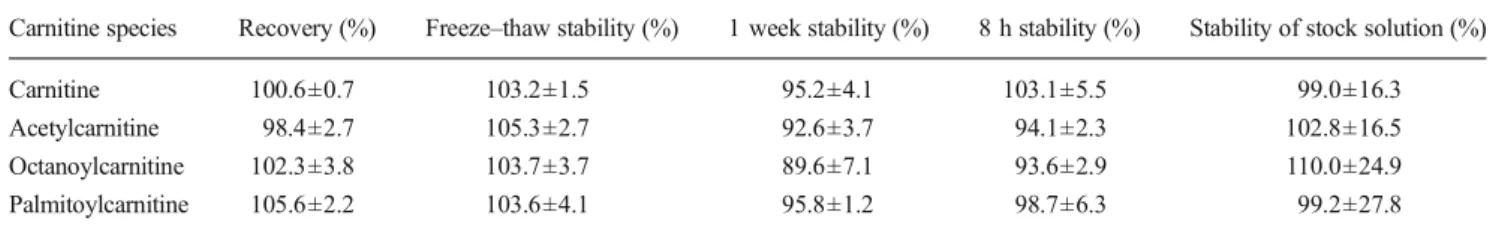
After having demonstrated a good separation for carnitine and the most important acylcarnitines between C2 and C18, we concentrated on the analysis of carnitine, acetylcarnitine, octanoylcarnitine and palmitoylcarnitine. As shown in Table1, the recoveries of these four analytes were between 98 and 106 %. This is similar to the methods of Goshal et al. [25] and Minkler et al. [15], who reported recoveries in the range of 84 and 112 and 83 to 107 %, respectively, for these compounds. After addition of these four analytes to pooled plasma, they were still stable after three freeze–thaw cycles. After 1 week at −20 °C, acetylcarnitine and octanoylcarnitine showed a drop by 7.4 and 11.4 %, respectively. Similarly, after 8 h at room temperature, acetylcarnitine and octanoylcarnitine had decreased by 5.9 and 6.4 %, respectively, whereas carnitine and palmitoylcarnitine remained stable (Table1).
Quantification and method validation
A second aim was to develop a method minimizing the impact of matrix effects on quantification of carnitine and acylcarnitines. We first tested the feasibility of a classical quantification with standard curves prepared in carnitine-free matrices such as water or 4 % bovine serum albumin (BSA). As shown in ESM Fig.S3A–D, the slopes of the standard
curves in water containing BSA were different from the slopes in pooled plasma for carnitine and acetylcarnitine, indicating a significant matrix effect. Matrix effects have also been de-scribed in the publication of Ho et al. [21] who analyzed free
and total carnitine after protein precipitation with acetonitrile, and in the publication of Vernez et al. [17] who analyzed carnitine and acylcarnitines after protein precipitation and solid-phase extraction. An alternative could be the use of denatured matrices such as dialyzed plasma [17,27]. Dialysis of plasma is time consuming, however, and the absence of matrix effects should be demonstrated for every batch. We therefore decided to validate and compare two different methods of quantification, namely the SAM and the use of external deuterated standards (DSM), which both account for the observed matrix effect.
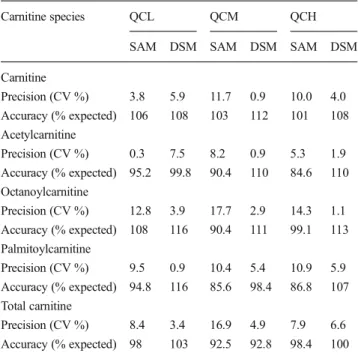
Accuracy of the two methods was assessed using three QCs measured on three different days. The QCs were gener-ated from pooled plasma, which was spiked with three known concentrations (low, medium, and high concentration) of the four analytes investigated (Table 2). The target values were calculated by adding the spiked to the respective endogenous concentration of the individual analytes in the pooled plasma. For the SAM, the measured concentrations were within ±7.5 % of the expected concentrations for total carnitine and carnitine in the entire concentration range tested. For acetylcarnitine, octanoylcarnitine, and palmitoylcarnitine, the variability was higher though not exceeding 15.4 % deviation from the target values. For the DSM, the accuracy was in the same range as for the SAM. The concentrations measured were within 13 % of the expected values for the medium and high concentrations and within 16 % for the low concen-trations for all analytes.
The precision of the methods was determined using the three QCs at different concentrations (low, medium, and high) as described for the determination of the accuracy (Table2) as well as using plasma samples of six healthy volunteers (results not shown). These samples were analyzed with both quantification methods on three different days. For the SAM, the mean interday variation was below 10 % for free carnitine, acetylcarnitine, octanoylcarnitine, palmitoylcarnitine, and total carnitine. None of the individual coefficients of variation exceeded 17.7 %. For the DSM, the interday precision was within 7.5 % for all analytes in the entire concentration range tested.
As shown for carnitine and octanoylcarnitine in ESM Fig.S4, both methods were linear within the analyzed range with coefficients of correlation of >0.99. Between the results
Table 1 Recovery and stability of the analytes
Carnitine species Recovery (%) Freeze–thaw stability (%) 1 week stability (%) 8 h stability (%) Stability of stock solution (%)
Carnitine 100.6±0.7 103.2±1.5 95.2±4.1 103.1±5.5 99.0±16.3
Acetylcarnitine 98.4±2.7 105.3±2.7 92.6±3.7 94.1±2.3 102.8±16.5 Octanoylcarnitine 102.3±3.8 103.7±3.7 89.6±7.1 93.6±2.9 110.0±24.9 Palmitoylcarnitine 105.6±2.2 103.6±4.1 95.8±1.2 98.7±6.3 99.2±27.8 Stability studies of the four analytes were performed on seven replicates of the three quality controls. Values are given as mean±coefficient of variation (standard deviation expressed as a percentage of the mean)
generated with the SAM and the DSM, we found correlations ranging from 0.720 to 0.981. For carnitine we observed a trend to higher values with the DSM, whereas for the other analytes, the results were comparable (Fig.2).
Regarding the sensitivity of our method, we defined the lower limits of quantification (LLOQ) as the lowest concen-tration of the respective deuterated standard measured with reliable precision and accuracy. For octanoylcarnitine, the LLOQ was 25 nmol/L and for palmitoylcarnitine 50 nmol/L. LLOQ for carnitine and acetylcarnitine was 250 nmol/L. These values are in the same range as reported by Ho et al. [21] and by Hirche et al. [24].
The total carnitine concentration of a sample (the carnitine concentration after hydrolysis of all acylcarnitines) provides valuable information about the size of the carnitine pool and the quality of the analysis of the individual carnitine species (the sum of the individual carnitine species should equal the total carnitine concentration). We therefore perform the deter-mination of the total carnitine concentration routinely in all samples that we analyze. Regarding the importance of this determination, we assessed the total carnitine concentration using both the SAM as well as the DSM and compared the values with the radioenzymatic method. As shown in ESM TableS1, there was a good agreement between the methods used. The average of the largest difference between the values obtained was 6.7 % (range, 3.2 to 9.9 %) of the mean value. The mean intercept of the correlations was 0.97 (range,−1.4 to 3.1), the mean slope was 0.958 (range, 0.918 to 1.016), and the mean r2
was 0.982 (range, 0.975 to 0.994).
Table 2 Accuracy and precision of the methods used for quantification Carnitine species QCL QCM QCH
SAM DSM SAM DSM SAM DSM Carnitine Precision (CV %) 3.8 5.9 11.7 0.9 10.0 4.0 Accuracy (% expected) 106 108 103 112 101 108 Acetylcarnitine Precision (CV %) 0.3 7.5 8.2 0.9 5.3 1.9 Accuracy (% expected) 95.2 99.8 90.4 110 84.6 110 Octanoylcarnitine Precision (CV %) 12.8 3.9 17.7 2.9 14.3 1.1 Accuracy (% expected) 108 116 90.4 111 99.1 113 Palmitoylcarnitine Precision (CV %) 9.5 0.9 10.4 5.4 10.9 5.9 Accuracy (% expected) 94.8 116 85.6 98.4 86.8 107 Total carnitine Precision (CV %) 8.4 3.4 16.9 4.9 7.9 6.6 Accuracy (% expected) 98 103 92.5 92.8 98.4 100 Both accuracy and precision were assessed with three quality controls (QC; low (QCL), medium (QCM), and high (QCH)) generated from pooled plasma spiked with three different concentrations of carnitine and three acylcarnitines. The expected concentration was calculated from the concentration measured in pooled plasma plus the spiked concentra-tions. The precision is expressed as coefficient of variation (CV; standard deviation expressed as a percentage of the mean). The accuracy is given as the ratio of the measured and the expected concentration expressed as a percentage
SAM standard addition method, DSM deuterated standard method
Fig. 2 Carnitine (a ) acetyl- (b), octanoyl- (c), and
palmitoylcarnitine (d) concentrations were measured with the standard addition method and with the deuterated standard method. Both methods are described in the“Materials and methods.” The two methods were compared using linear regression. Concentrations are given in micromoles per liter
Comparison of the standard addition and the DSM
The SAM, which allows the quantification of the analytes in the native matrix, completely eliminates the impact of matrix effects on quantification. A disadvantage of this method is that a single sample has to be analyzed five times to obtain a reliable curve which can be used for quantification. Taking into account the short analysis time, this disadvantage appears to be acceptable. As the same standard solution in different volumes is added to the plasma aliquots, a semi-automated sample processing is possible. Together with the 30-min hy-drolysis time for the determination of total carnitine, mixing and centrifugation steps, the analysis of one sample for free and total carnitine and acylcarnitines lasts approximately 1.5 h and approximately 15 h for ten samples.
The DSM also minimizes the impact of matrix effects on quantification and had a similar accuracy and precision com-pared with the SAM. As two standard curves have to be run (one for the hydrolyzed and one for the nonhydrolyzed samples), the analysis of one sample takes approximately 2 h. For each new sample, 20 min more are needed, resulting in 5 h for ten samples. If more than one sample has to be analyzed, the DSM is therefore faster than the SAM. Disadvantages of the DSM are higher costs for the deuterated standards and the possible lack of appropriate standards for specific acylcarnitines.
Application of the method to biological samples
The SAM was applied for the quantification of carnitine and three acylcarnitines in plasma samples of two patients with medium-chain acyl-CoA dehydrogenase (MCAD) deficiency and the DSM for the analysis of plasma samples from a healthy volunteer completing a cycling exercise until exhaustion.
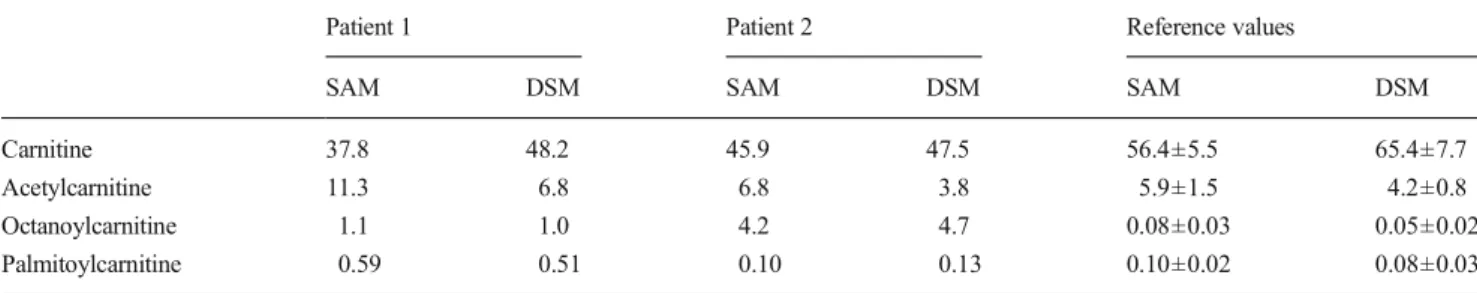
As expected, the two patients with MCAD deficiency had elevated plasmatic octanoylcarnitine concentrations [18,26]. In the first patient, the octanoylcarnitine concentration was more than ten times higher than in healthy volunteers and in the second patient approximately 50 times higher. In the first patient, also the palmitoylcarnitine concentration was elevated
while this was normal in the second patient. Carnitine and acetylcarnitine concentrations were in a normal range in both patients (Table3).
In the healthy volunteer cycling until exhaustion, we observed increasing acetylcarnitine concentrations with in-creasing workload. In comparison, the free carnitine concen-trations first slightly increased with exercise and then decreased in parallel with increasing acetylcarnitine concentrations at higher exercise intensities (Fig. 3). Increasing acetylcarnitine concentrations in humans exercising above the lactate threshold have been described earlier [3].
The two examples show that the method can be used reliably for the quantification of carnitine and acylcarnitines in patient samples. Further investigations have shown that the method can easily be adapted for the analysis of other acylcarnitines than those quantified in this study and is also suitable for other matrices such as skeletal muscle and urine (data not shown).
Table 3 Plasma concentrations of carnitine and acylcarnitines in two patients with MCAD deficiency
Patient 1 Patient 2 Reference values
SAM DSM SAM DSM SAM DSM
Carnitine 37.8 48.2 45.9 47.5 56.4±5.5 65.4±7.7
Acetylcarnitine 11.3 6.8 6.8 3.8 5.9±1.5 4.2±0.8
Octanoylcarnitine 1.1 1.0 4.2 4.7 0.08±0.03 0.05±0.02
Palmitoylcarnitine 0.59 0.51 0.10 0.13 0.10±0.02 0.08±0.03
The carnitine concentrations were measured with both the standard addition method (SAM) and deuterated standard method (DSM). Concentrations are given in micromoles per liter. Reference values from healthy volunteers (n =10) are given as mean±SD
Fig. 3 The deuterated standard method was used for the quantification of carnitine and acetylcarnitine in plasma samples of a healthy male volun-teer completing a cycle exercise with increasing workload until exhaus-tion. The workload started at 220 W and was increased by 20 W every 2 min. Exhaustion was reached after 18 min at 380 W. Mean concentra-tions in micromoles per liter±SD of three determinaconcentra-tions are shown
Conclusions
In conclusion, we describe a fast and reliable method for the analysis of carnitine and acylcarnitines requiring small sample volumes and, in the case of the deuterated method, a short total analysis time. Our approach requires minimal sample work-up and can therefore be automated. The method is useful for research projects with large numbers of specific analyses but also for clinical applications.
Acknowledgments The authors would like to thank Dr. Jean-Marc Nuoffer from the Inselspital in CH-3010 Berne for providing the two patient samples.
Financial support This study was supported by a grant from the Swiss National Science Foundation to SK (SNF 31003A-132992).
References
1. Fritz IB (1955) The effects of muscle extracts on the oxidation of palmitic acid by liver slices and homogenates. Acta Physiol Scand 34:367–385 2. Brass EP, Hoppel CL (1980) Relationship between acid-soluble
carnitine and coenzyme A pools in vivo. Biochem J 190:495–504 3. Friolet R, Hoppeler H, Krahenbuhl S (1994) Relationship between the
coenzyme A and the carnitine pools in human skeletal muscle at rest and after exhaustive exercise under normoxic and acutely hypoxic conditions. J Clin Invest 94:1490–1495
4. Steiber A, Kerner J, Hoppel CL (2004) Carnitine: a nutritional, bio-synthetic, and functional perspective. Mol Aspects Med 25:455–473 5. Millington DS, Kodo N, Norwood DL, Roe CR (1990) Tandem mass
spectrometry: a new method for acylcarnitine profiling with potential for neonatal screening for inborn errors of metabolism. J Inherit Metab Dis 13:321–324
6. Morand R, Todesco L, Donzelli M, Fischer-Barnicol D, Mullen PJ, Krahenbuhl S (2012) Effect of short- and long-term treatment with valproate on carnitine homeostasis in humans. Ther Drug Monit 34: 406–414
7. Vernez L, Dickenmann M, Steiger J, Wenk M, Krahenbuhl S (2006) Effect ofL-carnitine on the kinetics of carnitine, acylcarnitines and butyrobetaine in long-term haemodialysis. Nephrol Dial Transplant 21:450–458
8. Tamai I, Ohashi R, Nezu J, Yabuuchi H, Oku A, Shimane M, Sai Y, Tsuji A (1998) Molecular and functional identification of sodium ion-dependent, high affinity human carnitine transporter OCTN2. J Biol Chem 273:20378–20382
9. Wang Y, Ye J, Ganapathy V, Longo N (1999) Mutations in the organic cation/carnitine transporter OCTN2 in primary carnitine deficiency. Proc Natl Acad Sci U S A 96:2356–2360
10. Chalmers RA, Roe CR, Stacey TE, Hoppel CL (1984) Urinary excretion ofL-carnitine and acylcarnitines by patients with disorders of organic acid metabolism: evidence for secondary insufficiency of
L-carnitine. Pediatr Res 18:1325–1328
11. Di Donato S, Rimoldi M, Garavaglia B, Uziel G (1984) Propionyl-carnitine excretion in propionic and methylmalonic acidurias: a cause of carnitine deficiency. Clin Chim Acta 139:13–21
12. Hiatt WR, Koziol BJ, Shapiro JI, Brass EP (1992) Carnitine metabo-lism during exercise in patients on chronic hemodialysis. Kidney Int 41:1613–1619
13. Millington DS, Stevens RD (2011) Acylcarnitines: analysis in plasma and whole blood using tandem mass spectrometry. Methods Mol Biol 708:55–72
14. Maeda Y, Ito T, Suzuki A, Kurono Y, Ueta A, Yokoi K, Sumi S, Togari H, Sugiyama N (2007) Simultaneous quantification of acylcarnitine isomers containing dicarboxylic acylcarnitines in human serum and urine by high-performance liquid chromatography/electrospray ioniza-tion tandem mass spectrometry. Rapid Commun Mass Spectrom 21: 799–806
15. Minkler PE, Stoll MS, Ingalls ST, Yang S, Kerner J, Hoppel CL (2008) Quantification of carnitine and acylcarnitines in biological matrices by HPLC electrospray ionization-mass spectrometry. Clin Chem 54:1451–1462
16. Vernez L, Hopfgartner G, Wenk M, Krahenbuhl S (2003) Determi-nation of carnitine and acylcarnitines in urine by high-performance liquid chromatography-electrospray ionization ion trap tandem mass spectrometry. J Chromatogr A 984:203–213
17. Vernez L, Wenk M, Krahenbuhl S (2004) Determination of carnitine and acylcarnitines in plasma by high-performance liquid chromato graphy/electrospray ionization ion trap tandem mass spectrometry. Rapid Commun Mass Spectrom 18:1233–1238
18. Chace DH, Hillman SL, Van Hove JL, Naylor EW (1997) Rapid diagnosis of MCAD deficiency: quantitative analysis of octanoyl-carnitine and other acyloctanoyl-carnitines in newborn blood spots by tandem mass spectrometry. Clin Chem 43:2106–2113
19. Johnson DW (1999) Inaccurate measurement of free carnitine by the electrospray tandem mass spectrometry screening method for blood spots. J Inherit Metab Dis 22:201–202
20. Chau CH, Rixe O, McLeod H, Figg WD (2008) Validation of analytic methods for biomarkers used in drug development. Clin Cancer Res 14:5967–5976
21. Ho CS, Cheng BS, Lam CW (2003) Rapid liquid chromatography-electrospray tandem mass spectrometry method for serum free and total carnitine. Clin Chem 49:1189–1191
22. Brass EP, Hoppel CL (1978) Carnitine metabolism in the fasting rat. J Biol Chem 253:2688–2693
23. Heuberger W, Berardi S, Jacky E, Pey P, Krahenbuhl S (1998) Increased urinary excretion of carnitine in patients treated with cis-platin. Eur J Clin Pharmacol 54:503–508
24. Hirche F, Fischer M, Keller J, Eder K (2009) Determination of carni-tine, its short chain acyl esters and metabolic precursors trimethyllysine and gamma-butyrobetaine by quasi-solid phase extraction and MS/MS detection. J Chromatogr B: Analyt Technol Biomed Life Sci 877: 2158–2162
25. Ghoshal AK, Guo T, Soukhova N, Soldin SJ (2005) Rapid measure-ment of plasma acylcarnitines by liquid chromatography-tandem mass spectrometry without derivatization. Clin Chim Acta 358: 104–112
26. Yokoi K, Ito T, Maeda Y, Nakajima Y, Ueta A, Nomura T, Koyama N, Kato I, Suzuki S, Kurono Y, Sugiyama N, Togari H (2007) Acylcarnitine profiles during carnitine loading and fasting tests in a Japanese patient with medium-chain acyl-CoA dehydrogenase defi-ciency. Tohoku J Exp Med 213:351–359
27. Liu Z, Mutlib AE, Wang J, Talaat RE (2008) Liquid chromatography/ mass spectrometry determination of endogenous plasma acetyl and palmitoyl carnitines as potential biomarkers of beta-oxidation in mice. Rapid Commun Mass Spectrom 22:3434–3442