Abstract
Aims/hypothesis. The molecular mechanisms of
obesi-ty-related insulin resistance are incompletely
under-stood. Macrophages accumulate in adipose tissue of
obese individuals. In obesity, monocyte
chemoattrac-tant protein-1 (MCP-1), a key chemokine in the
pro-cess of macrophage accumulation, is overexpressed in
adipose tissue. MCP-1 is an insulin-responsive gene
that continues to respond to exogenous insulin in
insu-lin-resistant adipocytes and mice. MCP-1 decreases
insulin-stimulated glucose uptake into adipocytes. The
A–2518G polymorphism in the distal regulatory
re-gion of MCP-1 may regulate gene expression. The
aim of this study was to investigate the impact of this
gene polymorphism on insulin resistance.
Methods. We genotyped the Ludwigshafen Risk and
Cardiovascular Health (LURIC) cohort (n=3307).
In-sulin resistance, estimated by homeostasis model
as-sessment, and Type 2 diabetes were diagnosed in 803
and 635 patients respectively.
Results. Univariate analysis revealed that plasma
MCP-1 levels were significantly and positively
cor-related with WHR (p=0.011), insulin resistance
(p=0.0097) and diabetes (p<0.0001). Presence of the
MCP-1 G–2518 allele was associated with decreased
plasma MCP-1 (p=0.017), a decreased prevalence of
insulin resistance (odds ratio [OR]=0.82, 95% CI:
0.70–0.97, p=0.021) and a decreased prevalence of
diabetes (OR=0.80, 95% CI: 0.67–0.96, p=0.014).
In multivariate analysis, the G allele retained
statis-tical significance as a negative predictor of insulin
resistance (OR=0.78, 95% CI: 0.65–0.93, p=0.0060)
and diabetes (OR=0.80, 95% CI: 0.66–0.96,
p=0.018).
Conclusions/interpretation. In a large cohort of
Cau-casians, the MCP-1 G–2518 gene variant was
signifi-cantly and negatively correlated with plasma MCP-1
levels and the prevalence of insulin resistance and
Type 2 diabetes. These results add to recent evidence
supporting a role for MCP-1 in pathologies associated
with hyperinsulinaemia.
Keywords Diabetes · Insulin resistance ·
Macrophage · Monocyte chemoattractant protein-1 ·
Polymorphism
Received: 5 May 2004 / Accepted: 18 June 2004 Published online: 2 September 2004
© Springer-Verlag 2004 G. Vassalli (
✉
)Department of Cardiology, University Hospital, CHUV-BH10, 1011 Lausanne, Switzerland
E-mail: [email protected] Tel.: +41-21-3140076, Fax: +41-21-3140013 Diabetologia (2004) 47:1574–1580
DOI 10.1007/s00125-004-1494-4
Association between the
A–2518G
polymorphism
in the monocyte chemoattractant protein-1 gene
and insulin resistance and Type 2 diabetes mellitus
E. Simeoni1, 2· M. M. Hoffmann3· B. R. Winkelmann4· J. Ruiz5· S. Fleury1, 2· B. O. Boehm6· W. März7·
G. Vassalli1, 8
1 Department of Cardiology, University Hospital, CHUV-BH10, Lausanne, Switzerland 2 Department of Experimental Surgery, University Hospital, Lausanne, Switzerland 3 Department of Clinical Chemistry, University Hospital, Freiburg, Germany
4 Cooperation Unit of Pharmacogenomics/Applied Genomics, University of Heidelberg, Germany 5 Department of Endocrinology, University Hospital, Lausanne, Switzerland
6 Division of Endocrinology and Diabetes, Department of Medicine, University Hospital, Ulm, Germany 7 Department of Clinical Chemistry, University Hospital, Graz, Austria
8 Institute of Microbiology, University Hospital, Lausanne, Switzerland
Introduction
The molecular mechanisms that link obesity and insulin
resistance are incompletely understood [1, 2, 3].
Obe-sity, insulin resistance and diabetes mellitus share a
Abbreviations: CAD, coronary artery disease · HOMAIR, homeostasis model assessment of insulin resistance · MCP-1, monocyte chemoattractant protein-1 · MIP-1α, macrophage inflammatory protein-1α· NF-κB, nuclear factor-κB · PAI-1, plasminogen-activator inhibitor-1
chronic, low-grade inflammatory component [4, 5, 6,
7], as reflected by increased expression of
proinflamma-tory cytokines such as TNF-
α
[8], IL-6 [9], and
mono-cyte chemoattractant protein-1 (MCP-1) [6, 7, 10, 11].
Adipose tissue functions as an endocrine organ that
se-cretes a number of biologically active proteins,
includ-ing TNF-
α
[8], IL-6 [6, 12], IL-8 [13], C-reactive
pro-tein, inducible nitric oxide synthase [6], TGF-
β
1,
plas-minogen-activator inhibitor-1 (PAI-1) [14], adiponectin
[15], resistin [16], leptin [13, 17], macrophage
inflam-matory protein-1
α
(MIP-1
α
) [7, 13] and MCP-1 [6, 7,
10, 11, 17]. Obesity alters adipose tissue endocrine
function and leads to the increased secretion of
proin-flammatory cytokines (so-called “adipokines”),
hor-mones and fatty acids [6, 7, 10]. In turn, TNF-
α
, IL-1
β
,
and other adipokines stimulate MCP-1 production and
release by human differentiated adipocytes [13].
MCP-1, which is a member of the chemokine family,
plays a key role in the recruitment of monocytes/
macrophages to inflammatory foci [18]. High glucose
directly up-regulates MCP-1 expression in vascular
endothelial cells and monocytes [19, 20]. MCP-1
mRNA is dramatically overexpressed (increased by a
factor of seven) in white adipose tissue of genetically
obese (ob/ob) mice compared with lean control mice
[10]. In these mice, the highest level of MCP-1
ex-pression is in subcutaneous adipose tissue, with the
liver showing <10% and the kidney and lung showing
1–2% of the level of MCP-1 expression in adipose
tis-sue [10]. Insulin induces the production and secretion
of substantial amounts of MCP-1 in insulin-resistant
adipocytes and insulin-resistant obese mice [10].
MCP-1 is similar to other genes such as PAI-1 and
SREBP-1c in that it continues to respond to exogenous
insulin in insulin-resistant states [10, 21]. Moreover,
MCP-1 inhibits (by approximately 30%)
insulin-stim-ulated glucose uptake into mouse adipocytes [10].
Transcriptional profiling experiments have shown that
a number of inflammation and macrophage-enriched
or specific genes, such as MCP-1, MIP-1
α
, ADAM8,
MAC-1, F4/80 and CD68, are up-regulated in white
adipose tissue of mice with genetic or diet-induced
obesity [6, 7]. Of the 100 genes whose expression was
most significantly correlated with body mass, 30%
en-coded proteins that are characteristic of macrophages.
In human subcutaneous adipose tissue, both BMI and
average adipocyte size were significant predictors of
macrophage accumulation [6]. In bone marrow
trans-plant experiments in irradiated mice, 85% of the
mac-rophages that accumulated in adipose tissue after
plac-ing the mice on a high-fat diet were of bone marrow
origin [6]. In addition, in Csf1
op/opmice lacking
mac-rophages, the presence of cells expressing the
macro-phage marker F4/80 in adipose tissue was greatly
re-duced compared with that in wild-type mice [6].
These findings suggest new models involving
macro-phage infiltration into adipose tissue in obesity-related
insulin resistance.
Genetic differences in chemokine expression may
contribute to differences in the severity of
inflamma-tory processes between individuals. Substantial
inter-individual variability in MCP-1 production in
re-sponse to proinflammatory cytokines has previously
been described [22, 23]. Human MCP-1 transcription
is under the control of two distinct regions within the
5’-flanking sequence of the gene. The distal region
contains two NF-
κ
B binding sites and is essential
for cytokine-dependent regulation, while the proximal
region contains a GC box that may regulate
tissue-specific expression [24]. A common A
→
G
polymor-phism located at position
−
2518 in the distal
regulato-ry region regulates MCP-1 expression. This was
dem-onstrated by transfection experiments in A172 and
293T cells using reporter gene constructs containing
the distal regulatory region of the MCP-1 gene with
either variant at position
−
2518 [22, 25]. Moreover,
MCP-1 expression in isolated, cytokine-stimulated
hu-man peripheral blood mononuclear cells [22, 25] and
hepatic cells [26], and plasma MCP-1 levels in
pa-tients with lupus nephritis support the assumption that
the gene polymorphism regulates MCP-1 expression
at the transcriptional level [25]. Case-control gene
as-sociation studies have reported statistical asas-sociations
between the polymorphism and lupus nephritis [25],
coronary artery disease (CAD) [27] and asthma [28].
The aim of the present study was to test the hypothesis
that the MCP-1 A–2518G polymorphism influences
plasma MCP-1 levels and the risk of developing
insu-lin resistance and Type 2 diabetes.
Subjects and methods
Study population and clinical definitions. We genotyped the
Ludwigshafen Risk and Cardiovascular Health (LURIC) co-hort of 3316 individuals who underwent coronary angiography because of chest pain or non-invasive tests consistent with myocardial ischaemia [29]. All individuals were Caucasians born in Germany to parents of German ancestry. Coronary ar-tery disease was defined angiographically by a ≥20% reduction in lumenal diameter in one or more major epicardial coronary arteries or a 10% to 19% reduction in three or more (out of 15) coronary artery segments. Genetic testing of this cohort was approved by the appropriate institutional ethics committee and informed consent was obtained from the patients. After exclud-ing nine individuals with Type 1 diabetes, the study population included 3307 individuals. Insulin resistance was estimated by homeostasis model assessment (HOMAIR) [30] in the 2798 in-dividuals who were not receiving oral hypoglycaemic drugs or insulin treatment. The threshold for insulin resistance was de-fined as the 90th percentile of HOMAIRdistribution in individ-uals (n=350) with no markers of the metabolic syndrome [30]. Type 2 diabetes was defined according to the new criteria of the American Diabetes Association (ADA) and the provisional criteria of the World Health Organization (WHO) [31, 32, 33]. Unlike in a previous study of the same cohort [34], subjects with a single test showing a high blood glucose level, in the absence of a confirmatory test, were not assigned an unequivo-cal diabetes status. Older age was defined by the 50th percen-tile of the study population.
1576 E. Simeoni et al.:
Assessment of plasma MCP-1 levels. Plasma MCP-1 was
mea-sured in a subgroup of 940 consecutive patients (starting from recruitment number 1001) using the Quantikine Human MCP-1 Immunoassay (R&D Systems, Abingdon, UK). There were no significant differences (p>0.1) between this subgroup and the study population as a whole with respect to insulin resistance or diabetes distribution. Blood samples were collected, pro-cessed and stored according to the manufacturer’s instructions. The sensitivity of the kit is approximately 0.6 pmol/l, which is well below the lowest concentration measured in the present study (2.9 pmol/l).
Genotyping. Genotyping of the MCP-1 A–2518G
polymor-phism was carried out by RFLP-PCR as described previously [22]. Data are incomplete due to missing or equivocal results in five subjects.
Statistical analysis. Data are shown as frequencies in percent
(numbers of subjects) or median values (25–75 percentiles). The JMP program (Version 5; SAS Institute, Cary, N.C., USA) was used for statistical analysis. Frequencies were compared by the Cochrane–Armitage trend test. Due to skewed distribu-tion, plasma MCP-1 data were analysed by non-parametric tests (Wilcoxon and Kruskal–Wallis rank-sum tests). The gene counting method estimated allele frequencies, and the chi square test was used to test for deviations of genotype frequen-cies from Hardy–Weinberg equilibrium. The independent con-tributions of clinical and genetic characteristics (age, insulin resistance, diabetes, obesity, WHR, HDL cholesterol, triglyc-erides, hypertension, CAD and MCP-1 polymorphism) to MCP-1 plasma levels (entered as the dependent variable) were assessed by multivariate analysis (standard least square). The independent contributions of the MCP-1 polymorphism to insulin resistance and diabetes were determined by nominal logistic analysis, with insulin resistance or diabetes entered as the dependent variable, and age, sex, obesity, hypertension, HDL cholesterol, triglycerides and WHR entered as indepen-dent variables. In a subanalysis, diabetes was entered as a three-class-dependent variable (encoded as no diabetes = 0, non-insulin-treated diabetes = 1, insulin-treated diabetes = 2). A p value (two-tailed) of less than 0.05 was considered to be statistically significant.
Results
Clinical characteristics, insulin resistance and
dia-betes. In total, 29% (803 of 2798) of individuals who
were not on pharmacological oral hypoglycaemic
treatment had HOMA
IRindex values higher than or
equal to 2.96, indicating insulin resistance. Type 2
diabetes was diagnosed in 20% (635 of 3205) of
sub-jects. Among the diabetic patients, 25% (n=161) were
on no oral hypoglycaemic drugs, 44% (n=278) were
on oral hypoglycaemic drugs and 31% (n=196) were
on insulin. Coronary angiography showed coronary
artery stenoses (lumen reduction
≥
50%) in 69% of
pa-tients, minor lesions (lumen reduction <50%) in 14%
and smooth arteries in 17%. Table 1 shows the clinical
characteristics of the study population subdivided
ac-cording to insulin sensitivity or diabetes status, and
the results of univariate analysis of the clinical
charac-teristics in these subsets.
Genotype frequencies. In the population as a whole,
the frequencies of the genotypes of the A–2518G
polymorphism were: 1757 (53%) AA homozygous,
1303 (39%) GA heterozygous and 242 (7%) GG
homozygous. The genotype frequencies were in
Hardy–Weinberg equilibrium in the population as a
whole and in cases and controls defined by insulin
sensitivity or diabetes status. No differences were
found between G allele carriers (GA or GG genotype)
and non-carriers (AA genotype) with respect to age,
sex, obesity, WHR, hypertension, triglycerides or
HDL cholesterol between subsets (data not shown).
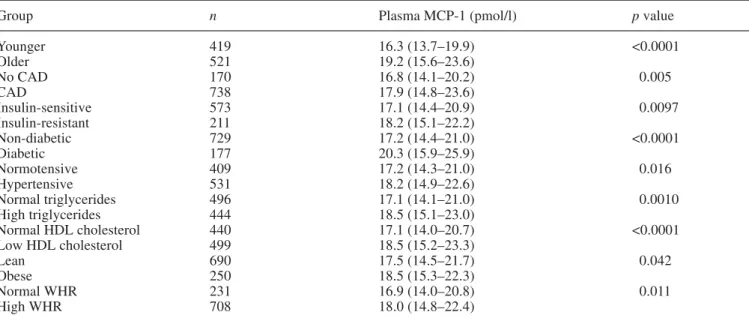
Associations between plasma MCP-1 levels and
clini-cal and genetic data. In univariate analysis, plasma
MCP-1 levels were significantly and positively
corre-lated with age, CAD and markers of the metabolic
syndrome (insulin resistance, Type 2 diabetes,
hy-pertension, obesity, WHR, high triglycerides and
low HDL cholesterol; Table 2). In addition, plasma
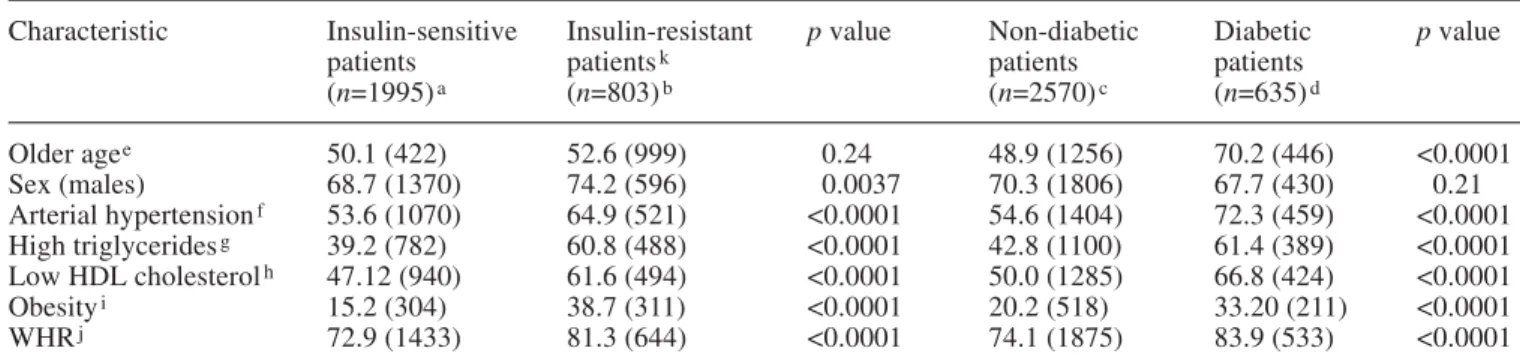
Table 1. Associations between clinical characteristics and insulin resistance and diabetes
Characteristic Insulin-sensitive Insulin-resistant p value Non-diabetic Diabetic p value
patients patientsk patients patients
(n=1995)a (n=803)b (n=2570)c (n=635)d Older agee 50.1 (422) 52.6 (999) 0.24 48.9 (1256) 70.2 (446) <0.0001 Sex (males) 68.7 (1370) 74.2 (596) 0.0037 70.3 (1806) 67.7 (430) 0.21 Arterial hypertensionf 53.6 (1070) 64.9 (521) <0.0001 54.6 (1404) 72.3 (459) <0.0001 High triglyceridesg 39.2 (782) 60.8 (488) <0.0001 42.8 (1100) 61.4 (389) <0.0001 Low HDL cholesterolh 47.12 (940) 61.6 (494) <0.0001 50.0 (1285) 66.8 (424) <0.0001 Obesityi 15.2 (304) 38.7 (311) <0.0001 20.2 (518) 33.20 (211) <0.0001 WHRj 72.9 (1433) 81.3 (644) <0.0001 74.1 (1875) 83.9 (533) <0.0001
Values shown are % (n). aMissing data for WHR (n=30); bmissing data for triglycerides (n=1), HDL cholesterol (n=1) and WHR (n=11); cmissing data for HDL cholesterol (n=1) and WHR (n=41); dmissing data for triglycerides (n=1); eolder age, ≥62.7 years; fhypertension, supine systolic blood pressure
≥140 mm Hg and/or diastolic pressure ≥90 mm Hg; ghigh triglycerides, ≥150 mg/ml; hlow HDL cholesterol, <35 mg/ml in males and <45 mg/ml in females; iobesity, BMI ≥30 kg/m2; jhigh WHR, >0.95 in males and >0.80 in females; kinsulin resistance, HOMAIRindex ≥2.96
MCP-1 levels were negatively correlated with the
presence of the G allele at position
−
2518 of MCP-1
(p=0.043 and p=0.017 for genotype and G allele
car-rier frequencies respectively; Table 3). In multivariate
analysis, age and HDL cholesterol remained
associat-ed with plasma MCP-1 (p<0.0001 and p=0.002
re-spectively), with a trend towards statistical
signifi-cance for the MCP-1 polymorphism (p=0.06),
where-as all other where-associations lost statistical significance
(p>0.1).
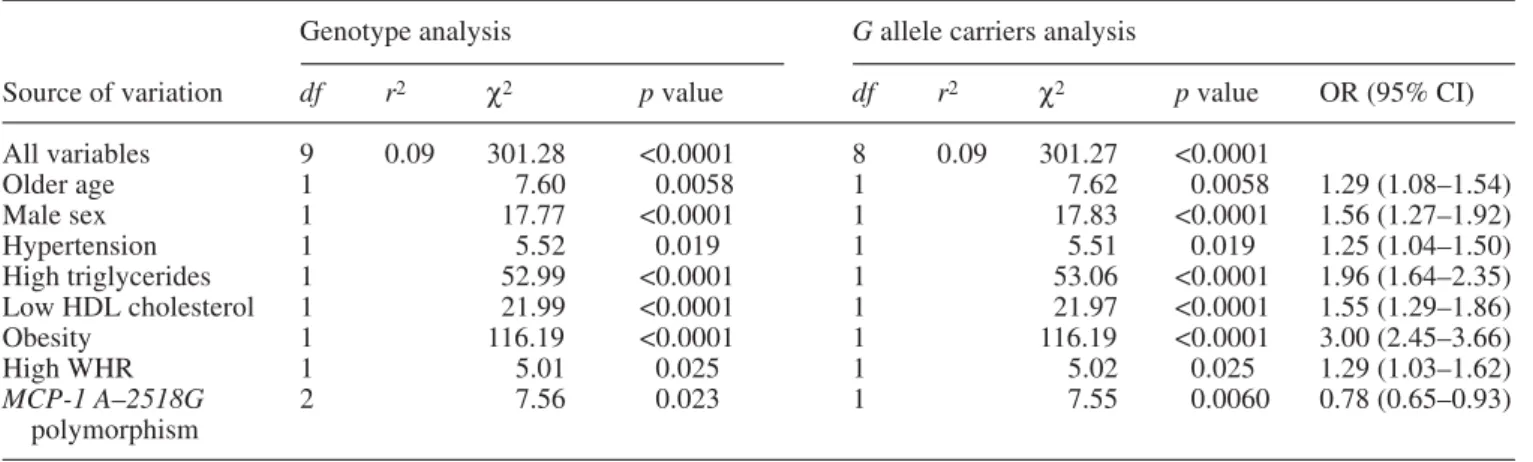
Association between the MCP-1 A–2518G
polymor-phism and insulin resistance. The frequencies of the
MCP-1 genotypes were significantly different
be-tween insulin-sensitive and insulin-resistant subjects
(p=0.020), as were the frequencies of G allele carriers
(p=0.021; Table 3). In multivariate analysis (Table 4),
both genotype and G allele carrier frequencies
re-tained significant associations with insulin resistance
(
χ
2=7.56, p=0.023 and
χ
2=7.55, p=0.006
respec-tively).
Association between the MCP-1 A–2518G
polymor-phism and Type 2 diabetes. Presence of the G allele
was associated with a decreased prevalence of Type 2
diabetes (p=0.014; Table 3). In multivariate analysis,
genotype and G allele carrier frequencies were
signifi-cantly associated with a decreased prevalence of
dia-betes (
χ
2=7.03, p=0.030 and
χ
2=5.62, p=0.018,
re-spectively; Table 5). The decrease in the frequency of
G allele carriers was more marked in the subgroup of
insulin-treated patients than in the subgroup of
non-in-sulin-treated diabetic patients (39% and 44%
respec-tively, vs 48% in non-diabetic individuals;
χ
2=7.76,
p=0.021 by three-class analysis).
Association between the MCP-1 A–2518G
polymor-phism and obesity-related insulin resistance. A
sub-group analysis revealed that, among obese patients,
the insulin-sensitive subgroup contained a higher
pro-portion of MCP-1 G–2518 carriers than the
insulin-resistant subgroup (52.5% vs 43.9%; p=0.04).
Similar-ly, obese individuals who did not develop Type 2
dia-Table 2. Associations between plasma MCP-1 levels and clinical characteristics
Group n Plasma MCP-1 (pmol/l) p value
Younger 419 16.3 (13.7–19.9) <0.0001 Older 521 19.2 (15.6–23.6) No CAD 170 16.8 (14.1–20.2) 0.005 CAD 738 17.9 (14.8–23.6) Insulin-sensitive 573 17.1 (14.4–20.9) 0.0097 Insulin-resistant 211 18.2 (15.1–22.2) Non-diabetic 729 17.2 (14.4–21.0) <0.0001 Diabetic 177 20.3 (15.9–25.9) Normotensive 409 17.2 (14.3–21.0) 0.016 Hypertensive 531 18.2 (14.9–22.6) Normal triglycerides 496 17.1 (14.1–21.0) 0.0010 High triglycerides 444 18.5 (15.1–23.0) Normal HDL cholesterol 440 17.1 (14.0–20.7) <0.0001 Low HDL cholesterol 499 18.5 (15.2–23.3) Lean 690 17.5 (14.5–21.7) 0.042 Obese 250 18.5 (15.3–22.3) Normal WHR 231 16.9 (14.0–20.8) 0.011 High WHR 708 18.0 (14.8–22.4)
Values are medians (25–75 percentiles). Missing data for CAD (n=32), diabetes status (absence of confirmatory test; n=34), HDL cholesterol (n=1) and WHR (n=1)
Table 3. Associations between the MCP-1 polymorphism and plasma MCP-1 levels, insulin resistance and diabetes
Group Genotype p value G allele carriers p value
AA AG GG Plasma MCP-1 (pmol/l)a 18.2 (15.2–22.4) 17.4 (14.4–21.4) 17.1 (13.7–21.5) 0.043 17.2 (14.4–21.4) 0.017 Insulin-sensitive 51.1 (1018) 41.4 (826) 7.5 (150) 0.020 49.0 (976) 0.021 Insulin-resistant 55.9 (448) 37.9 (304) 6.2 (50) 44.1 (354) Non-diabetic 52.0 (1335) 40.6 (1043) 7.4 (190) 0.053 48.0 (1233) 0.014 Diabetic 57.4 (363) 35.1 (222) 7.4 (47) 42.6 (269)
1578 E. Simeoni et al.:
betes were more likely to be G allele carriers than
those who became diabetic (48.5% vs 40.5%; p=0.06).
Plasma MCP-1 levels were significantly increased in
obese diabetic patients compared with those in obese
non-diabetic patients (21.4 vs 17.6 pmol/l; p<0.05).
Discussion
There is increasing evidence that MCP-1, a potent
chemoattractant of monocytes/macrophages,
partici-pates in metabolic activities that involve regulation of
adipose tissue functions, inhibition of
insulin-stimu-lated glucose uptake into adipocytes [10] and
accumu-lation of macrophages in adipose tissue in obese
hu-mans [6]. In search of genetic factors that affect
insu-lin resistance, we investigated the role of the common
MCP-1 A–2518G polymorphism, which may regulate
MCP-1 expression at the transcriptional level [22, 25,
26]. In a large cohort of Caucasians with a high
preva-lence of cardiovascular risk factors, we found
de-creased plasma MCP-1 levels and a dede-creased
preva-lence of insulin resistance and Type 2 diabetes in
car-riers of the G allele compared with subjects
homozy-gous for the frequent A allele. A protective role for
this genetic variant is supported by the finding that,
among obese patients, the frequency of G allele
carri-ers was increased in those with preserved insulin
sen-sitivity. In multivariate analysis, the G allele remained
significantly and negatively correlated with insulin
re-sistance and diabetes after correction for risk factors
identified by univariate analysis (including CAD).
The decrease in G allele frequency was more
pro-nounced among insulin-treated patients than among
non-insulin-treated diabetic patients, suggesting that
the role of the gene polymorphism may become more
manifest at later stages of the disease.
Our findings of decreased plasma MCP-1 levels in
carriers of the G allele are in agreement with data in
patients with lupus nephritis [25]. In the present study,
plasma MCP-1 levels were significantly and
positive-ly correlated with markers of the metabolic syndrome,
such as insulin resistance, Type 2 diabetes,
hyperten-sion, obesity, WHR, high triglycerides and low HDL
Table 4. Nominal logistic fit, with insulin resistance entered as the dependent variable
Genotype analysis G allele carriers analysis
Source of variation df r2 χ2 p value df r2 χ2 p value OR (95% CI)
All variables 9 0.09 301.28 <0.0001 8 0.09 301.27 <0.0001 Older age 1 7.60 0.0058 1 7.62 0.0058 1.29 (1.08–1.54) Male sex 1 17.77 <0.0001 1 17.83 <0.0001 1.56 (1.27–1.92) Hypertension 1 5.52 0.019 1 5.51 0.019 1.25 (1.04–1.50) High triglycerides 1 52.99 <0.0001 1 53.06 <0.0001 1.96 (1.64–2.35) Low HDL cholesterol 1 21.99 <0.0001 1 21.97 <0.0001 1.55 (1.29–1.86) Obesity 1 116.19 <0.0001 1 116.19 <0.0001 3.00 (2.45–3.66) High WHR 1 5.01 0.025 1 5.02 0.025 1.29 (1.03–1.62) MCP-1 A–2518G 2 7.56 0.023 1 7.55 0.0060 0.78 (0.65–0.93) polymorphism
In this multivariate model, n=2753 due to incomplete data. df: 2 for genotype three-class analysis (encoded as AA=0, AG=1,
GG=2), 1 for G allele carrier two-class analysis (encoded as AA=0, AG+GG=1). OR, odds ratio
Table 5. Nominal logistic fit, with Type 2 diabetes entered as the dependent variable
Genotype analysis G allele carriers analysis
Source of variation df r2 χ2 p value df r2 χ2 p value OR (95% CI)
All variables 9 0.09 291.73 <0.0001 8 0.09 290.26 <0.0001 Older age 1 88.33 <0.0001 1 88.81 <0.0001 2.60 (2.13–3.17) Male sex 1 2.08 0.15 1 2.15 0.14 1.17 (0.95–1.44) Hypertension 1 26.50 <0.0001 1 26.45 <0.0001 1.70 (1.39–2.08) High triglycerides 1 43.45 <0.0001 1 42.80 <0.0001 1.90 (1.57–2.30) Low HDL cholesterol 1 28.88 <0.0001 1 28.86 <0.0001 1.71 (1.41–2.09) Obesity 1 21.69 <0.0001 1 21.49 <0.0001 1.63 (1.32–2.00) High WHR 1 5.13 0.024 1 5.08 0.024 1.33 (1.03–1.71) MCP-1 A–2518G 2 7.03 0.030 1 5.62 0.018 0.80 (0.66–0.96) polymorphism
In this multivariate model, n=3247 due to incomplete data. df: 2 for genotype three-class analysis (encoded as AA=0, AG=1,
cholesterol, according to univariate analysis. These
re-sults are consistent with previous data in patients with
Type IIa and IIb hyperlipoproteinaemia [35].
More-over, we observed increased plasma MCP-1 levels in
patients with Type 2 diabetes, corroborating previous
data from the Orbofiban in Patients With Unstable
Coronary Syndromes—Thrombolysis In Myocardial
Infarction (OPUS-TIMI) 16 trial and from a cohort of
women with glucose intolerance [36, 37]. Conversely,
another study showed that insulin infusion results in
decreased plasma MCP-1 levels in obese subjects [38].
Macrophage accumulation in human subcutaneous
adipose tissue increases with increasing obesity and
adipocyte size [6]. In obesity, infiltrating macrophages
account for almost all TNF-
α
expression and a
signifi-cant proportion of the expression of other
inflammato-ry mediators in adipose tissue [6]. Interestingly, the
epicardial adipose tissue of patients with CAD
pro-duces increased amounts of MCP-1, TNF-
α
, IL-1
β
,
and IL-6 compared with epicardial adipose tissue of
subjects without CAD, suggesting that regional
adi-pose tissue may be a source of atherogenic
proinflam-matory molecules [39].
The molecular mechanism by which the
polymor-phism regulates MCP-1 gene transcription is unclear.
Although it is located in the distal regulatory region of
the gene that contains two NF-
κ
B binding sites
essen-tial for cytokine-stimulated gene transcription [24],
the polymorphism does not alter the sequence of the
NF-
κ
B sites. Electrophoretic mobility shift assays
have suggested that the binding site for an as yet
unidentified transcription factor might be altered [22].
We propose that decreased MCP-1 expression in
carri-ers of the G allele may prevent the pathogenic vicious
circle by which MCP-1 expression promotes
macro-phage accumulation in adipose tissue, TNF-
α
release
by macrophages, TNF-
α
-stimulated MCP-1
expres-sion and MCP-1-mediated antagonism of insulin
ac-tivities in this tissue. Similarly, a single-nucleotide
polymorphism in the promoter of the gene encoding
resistin, an adipocyte-secreted hormone, has been
linked to insulin resistance in humans [40].
In conclusion, we have reported, for the first time,
that the MCP-1 G–2518 allele is significantly and
negatively correlated with circulating MCP-1 levels,
insulin resistance and Type 2 diabetes. Replication
of the reported genetic associations in independent
cohorts are needed to validate the role of the
polymor-phism in the development of insulin resistance.
Acknowledgements. This study was supported by the Teo Rossi
di Montelera Foundation, (Lausanne, Switzerland) and the Swiss Cardiology Foundation. E. Simeoni, M. M. Hoffmann and B. R. Winkelmann contributed equally to this work. G. Vassalli and S. Fleury were the recipients of grants from the Swiss National Science Foundation (grant numbers 632-058215 and 3100-64.834.01 respectively). B. O. Boehm was the recipient of a grant from the German Research Foundation (grant number SFB518).
References
1. Zimmet P, Alberti KG, Shaw J (2001) Global and societal implications of the diabetes epidemic. Nature 414:782–787 2. Grundy SM, Brewer HB, Cleeman JI, Smith SC, Lefant C (2004) Definition of metabolic syndrome. Circulation 109:433–438
3. Alexander CM, Landsman PB, Teutsch SM, Haffner SM (2003) NCEP-defined metabolic syndrome, diabetes, and prevalence of coronary heart disease among NHANES III participants age 50 years and older. Diabetes 52:1210–1214 4. Dandona P, Aljada A, Bandyopadhyay A (2004) Inflamma-tion: the link between insulin resistance, obesity and diabe-tes. Trends Immunol 25:4–7
5. Wellen KE, Hotamisligil GS (2003) Obesity-induced in-flammatory changes in adipose tissue. J Clin Invest 112:1785–1788
6. Weisberg SP, McCann D, Desai M, Rosenbaum M, Leibel RL, Ferrante AW Jr (2003) Obesity is associated with mac-rophage accumulation in adipose tissue. J Clin Invest 112:1796–1808
7. Xu H, Barnes GT, Yang Q et al. (2003) Chronic inflamma-tion in fat plays a crucial role in the development of obesi-ty-related insulin resistance. J Clin Invest 112:1821–1830 8. Uysal KT, Wiesbrock SM, Marino MW, Hotamisligil GS
(1997) Protection from obesity-induced insulin resistance in mice lacking TNF-αfunction. Nature 389:610–614 9. Mohamed-Ali V, Goodrick S, Rawesh A et al. (1997)
Subcutaneous adipose tissue releases interleukin-6, but not tumor necrosis factor-alpha, in vivo. J Clin Endocrinol Metab 82:4196–4200
10. Sartipy P, Loskutoff DJ (2003) Monocyte chemoattractant protein 1 in obesity and insulin resistance. Proc Natl Acad Sci USA 100:7265–7270
11. Takahashi K, Mizuarai S, Araki H et al. (2003) Adiposity elevates plasma MCP-1 levels leading to increased CD11b-positive monocytes in mice. J Biol Chem 278:46654– 46660
12. Yudkin JS, Kumari M, Humphries SE, Mohamed-Ali V (2000) Inflammation, obesity, stress and coronary heart disease: is interleukin-6 the link? Atherosclerosis 148:209– 214
13. Gerhardt CC, Romero IA, Cancello R, Camoin L, Strosberg AD (2001) Chemokines control fat accumulation and leptin secretion by cultured human adipocytes. Mol Cell Endocrinol 175:81–92
14. Juhan-Vague I, Alessi MC, Mavri A, Morange PE (2003) Plasminogen activator inhibitor-1, inflammation, obesity, insulin resistance and vascular risk. J Thromb Haemost 1:1575–1579
15. Yamauchi T, Kamon J, Waki H et al. (2001) The fat-derived hormone adiponectin reverses insulin resistance associated with both lipoatrophy and obesity. Nat Med 7:941–946
16. Steppan CM, Bailey ST, Bhat S et al. (2001) The hormone resistin links obesity to diabetes. Nature 409:307–312 17. Bruun JM, Pedersen SB, Kristensen K, Richelsen B (2002)
Effects of pro-inflammatory cytokines and chemokines on leptin production in human adipose tissue in vitro. Mol Cell Endocrinol 190:91–99
18. Rollins BJ (1996) Monocyte chemoattractant protein 1: a potential regulator of monocyte recruitment in inflamma-tory disease. Mol Med Today 2:198–204
19. Takaishi H, Taniguchi T, Takahashi A, Ishikawa Y, Yokoyama M (2003) High glucose accelerates MCP-1 production via p38 MAPK in vascular endothelial cells. Biochem Biophys Res Comm 305:122–128
1580 E. Simeoni et al.: Association between the A–2518G polymorphism in the monocyte chemoattractant protein-1 gene 20. Shanmugam N, Reddy MA, Guha M, Natarajan R (2003)
High glucose-induced expression of proinflammatory cyto-kine and chemocyto-kine genes in monocytic cells. Diabetes 1256–1264
21. Sartipy P, Loskutoff DJ (2003) Expression profiling identi-fies genes that continue to respond to insulin in adipocytes made insulin-resistant by treatment with tumor necrosis factor-alpha. J Biol Chem 278:52298–52306
22. Rovin BH, Lu L, Saxena R (1999) A novel polymorphism in the MCP-1 gene regulatory region that influences MCP-1 expression. Biochem Bioph Res Comm 259:344– 348
23. Sylvester I, Suffredini AF, Boujoukos AJ et al. (1993) Neutrophil attractant protein-1 and monocyte chemoattrac-tant protein-1 in human serum. Effects of intravenous lipo-polysaccharide on free attractants, specific IgG autoanti-bodies and immune complexes. J Immunol 151:3292– 3298
24. Ueda A, Okuda K, Ohno S, Shirai A, Igarashi T, Matsunaga K (1994) NF-kappa B and Sp1 regulate transcription of the human monocyte chemoattractant protein-1 gene. J Immu-nol 153:2052–2063
25. Kim HL, Lee DS, Yang SH et al. (2002) The polymor-phism of monocyte chemoattractant protein-1 is associated with the renal disease of SLE. Am J Kidney Dis 40:1146–1152
26. Muhlbauer M, Bosserhoff AK, Hartmann A et al. (2003) A novel MCP-1 gene polymorphism is associated with hepatic MCP-1 expression and severity of HCV-related liver disease. Gastroenterology 125:1085–1093
27. Szalai C, Duba J, Prohatzka Z et al. (2001) Involvement of polymorphisms in the chemokine system in the suscepti-bility for coronary artery disease (CAD). Coincidence of elevated Lp(a) and MCP-1–2518 G/G genotype in CAD patients. Atherosclerosis 158:233–239
28. Szalai C, Kozma GT, Nagy A et al. (2001) Polymorphism in the gene regulatory region of MCP-1 is associated with asthma susceptibility and severity. J Allergy Clin Immunol 108:375–381
29. Winkelmann BR, März W, Boehm BO et al.; LURIC Study Group (LUdwigshafen RIsk and Cardiovascular health) (2001) Rationale and design of the LURIC study—a re-source for functional genomics, pharmacogenomics and long-term prognosis of cardiovascular disease. Pharma-cogenomics 2 [Suppl 1]:S9–S73
30. Nakai Y, Fukushima M, Nakaishi S et al. (2002) The threshold value for insulin resistance on homeostasis model assessment of insulin sensitivity. Diabet Med 19:344–348 31. Alberti KG, Zimmet PZ (1998) Definition, diagnosis and
classification of diabetes mellitus and its complications. Part 1: diagnosis and classification of diabetes mellitus provision-al report of a WHO consultation. Diabet Med 15:539–553 32. Expert Committee on the Diagnosis and Classification of
Diabetes Mellitus (2002) Report of the expert committee on the diagnosis and classification of diabetes mellitus [from the American Diabetes Association, ADA]. Diabetes Care 25 [Suppl 1]:S1–S20
33. World Health Organization (1999) Definition, diagnosis and classification of diabetes mellitus and its complica-tions. Report of a WHO consultation. Part 1 Diagnosis and classification of diabetes mellitus WHO/NCD/NCS/99. World Health Organization, Geneva
34. Taubert G, Winkelmann BR, Schleiffer T et al. (2003) Prevalence, predictors, and consequences of unrecognized diabetes mellitus in 3266 patients scheduled for coronary angiography. Am Heart J 145:285–291
35. Kowalski J, Okopien B, Madej A et al. (2001) Level of sICAM-1, sVCAM-1 and MCP-1 in patients with hyperlipo-proteinemia IIa and -IIb. Int J Clin Pharmacol Ther 39:48–52 36. Lemos JA de, Morrow DA, Sabatine MS et al. (2003)
As-sociation between plasma levels of monocyte chemoattrac-tant protein-1 and long-term clinical outcomes with acute coronary syndromes. Circulation 107:690–695
37. Piemonti L, Calori G, Mercalli A et al. (2003) Fasting plas-ma leptin, tumor necrosis factor-α receptor 2, and mono-cyte chemoattractant protein 1 concentration in a popula-tion of glucose-tolerant and glucose intolerant women. Diabetes Care 26:2883–2889
38. Dandona P, Aljada A, Mohanty P et al. (2001) Insulin in-hibits intranuclear nuclear factor kappaB and stimulates IkappaB in mononuclear cells in obese subjects: evidence for an anti-inflammatory effect? J Clin Endocrinol Metab 86:3257–3265
39. Mazurek T, Zhang L, Zalewski A et al. (2003) Human epi-cardial adipose tissue is a source of inflammatory media-tors. Circulation 108:2460–2466
40. Smith SR, Bai F, Charbonneau C, Janderova L, Argyropou-los G (2003) A promoter genotype and oxidative stress po-tentially link resistin to human insulin resistance. Diabetes 52:1611–1618