DOI 10.1007/s12193-012-0101-0
O R I G I NA L PA P E R
Emergent leaders through looking and speaking: from
audio-visual data to multimodal recognition
Dairazalia Sanchez-Cortes · Oya Aran ·
Dinesh Babu Jayagopi · Marianne Schmid Mast · Daniel Gatica-Perez
Received: 2 March 2012 / Accepted: 7 June 2012 / Published online: 18 August 2012 © OpenInterface Association 2012
Abstract In this paper we present a multimodal analysis of emergent leadership in small groups using audio-visual fea-tures and discuss our experience in designing and collecting a data corpus for this purpose. The ELEA Audio-Visual Syn-chronized corpus (ELEA AVS) was collected using a light portable setup and contains recordings of small group meet-ings. The participants in each group performed the winter sur-vival task and filled in questionnaires related to personality and several social concepts such as leadership and domi-nance. In addition, the corpus includes annotations on partic-ipants’ performance in the survival task, and also annotations of social concepts from external viewers. Based on this cor-pus, we present the feasibility of predicting the emergent leader in small groups using automatically extracted audio and visual features, based on speaking turns and visual atten-tion, and we focus specifically on multimodal features that make use of the looking at participants while speaking and D. Sanchez-Cortes (
B
)· O. Aran · D. B. Jayagopi · D. Gatica-Perez Idiap Research Institute, Centre du Parc, Rue Marconi 19,Martigny, Switzerland e-mail: [email protected] O. Aran e-mail: [email protected] D. B. Jayagopi e-mail: [email protected] D. Gatica-Perez e-mail: [email protected] D. Sanchez-Cortes· D. Gatica-Perez
Ecole Polytechnique Fédérale de Lausanne (EPFL), Lausanne, Switzerland
M. Schmid Mast
Institut de Psychologie du Travail et des Organisations, University of Neuchatel, Rue Emile-Argand 11, Neuchâtel, Switzerland
e-mail: [email protected]
looking at while not speaking measures. Our findings indi-cate that emergent leadership is related, but not equivalent, to dominance, and while multimodal features bring a moderate degree of effectiveness in inferring the leader, much simpler features extracted from the audio channel are found to give better performance.
Keywords Emergent leadership· Nonverbal behavior · Multimodal cues· Small group interactions
1 Introduction
Human interactions are rich on several dimensions. They make use of various communication channels in parallel (ver-bal and nonver(ver-bal, audio and visual, etc) to establish relations, to convey thoughts, and emotions in different social situa-tions, ranging from courtship to family, working in teams and building communities. Psychologists have long studied these interactions of varying scale, to understand behavior, motiva-tion, and emergence of interaction patterns [37,41]. One spe-cific setting of importance is the study of small groups [6,17]. From the viewpoint of social computing research, a domain rooted on significant developments in data record-ing, automatic audio-visual analysis, and machine learning [18], the aim is to automatically infer human social behavior by observing the interaction among people via multimodal sensing devices that capture the various dimensions of human social interaction. With these developments, results tradition-ally obtained in psychology can now be revisited with auto-matic analysis techniques.
Analyzing social interactions requires not only the analy-sis of single communication modalities such as speech, gesture, facial expression, etc., but it requires also multi-modal analysis to infer complex social concepts. To achieve
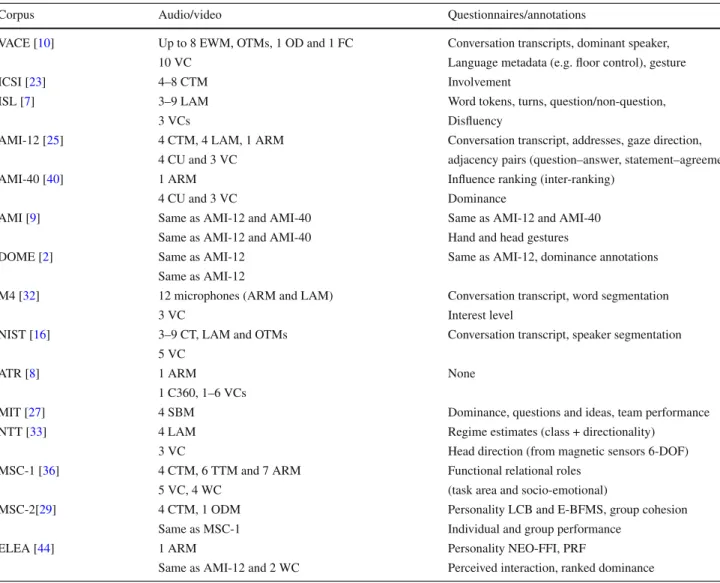
Table 1 Corpora available for small-group interaction study
Corpus Audio/video Questionnaires/annotations
VACE [10] Up to 8 EWM, OTMs, 1 OD and 1 FC Conversation transcripts, dominant speaker,
10 VC Language metadata (e.g. floor control), gesture
ICSI [23] 4–8 CTM Involvement
ISL [7] 3–9 LAM Word tokens, turns, question/non-question,
3 VCs Disfluency
AMI-12 [25] 4 CTM, 4 LAM, 1 ARM Conversation transcript, addresses, gaze direction, 4 CU and 3 VC adjacency pairs (question–answer, statement–agreement)
AMI-40 [40] 1 ARM Influence ranking (inter-ranking)
4 CU and 3 VC Dominance
AMI [9] Same as AMI-12 and AMI-40 Same as AMI-12 and AMI-40
Same as AMI-12 and AMI-40 Hand and head gestures
DOME [2] Same as AMI-12 Same as AMI-12, dominance annotations
Same as AMI-12
M4 [32] 12 microphones (ARM and LAM) Conversation transcript, word segmentation
3 VC Interest level
NIST [16] 3–9 CT, LAM and OTMs Conversation transcript, speaker segmentation 5 VC
ATR [8] 1 ARM None
1 C360, 1–6 VCs
MIT [27] 4 SBM Dominance, questions and ideas, team performance
NTT [33] 4 LAM Regime estimates (class + directionality)
3 VC Head direction (from magnetic sensors 6-DOF)
MSC-1 [36] 4 CTM, 6 TTM and 7 ARM Functional relational roles
5 VC, 4 WC (task area and socio-emotional)
MSC-2[29] 4 CTM, 1 ODM Personality LCB and E-BFMS, group cohesion
Same as MSC-1 Individual and group performance
ELEA [44] 1 ARM Personality NEO-FFI, PRF
Same as AMI-12 and 2 WC Perceived interaction, ranked dominance
The audio sensors/microphones include CTM-close-talk, EWM earset wireless, TTM tabletop, LAM lapel, SBM sociometer badge, ARM microphone array, ODM omnidirectional, FCM four-channel cardioid, OTM other distantly placed microphones. Video sensors include CU close-up, VC video camera, WC webcamera, C360 360◦camera. Personality annotations correspond to LCB Craig’s Locus of Control of Behavior scale, E-BFMS extroversion part of the Big Marker Five scales, NEO-FFI NEO-Five Factor Inventory, PRF Personality Research Form
meaningful and reliable results, it is of extreme importance to obtain natural interaction data, which is recorded with appropriate sensors that allow automatic analysis. A num-ber of multimodal corpora depicting group interactions is available in the research community (see summary of cor-pora available on Table1). Using these corpora, affect and behavioral cues like facial expressions, prosody, turn-taking patterns, head pose, and gestures have been studied. Fur-thermore, manual and automatic versions of behavioral cues have been used to infer social constructs like influence, per-formance, and cohesion. The recording solutions have also varied, from wearable devices, i.e., fully portable sensing, to fixed infrastructure-based sensors.
Despite the availability of these corpora, there are several limitations. One of the most important limitations is related
the naturalism of the interaction. As detailed in Sect.2, the scenarios used in these corpora range between experimen-tal setups with scripted meetings to completely natural sce-narios. In an experimental setup, the recording environment (consisting of cameras and microphones) is set in such a way that they capture data in the best available way, appropri-ate for analysis. Although an experimental setup is useful to control the recording environment, the obtained results can not be easily applied to real life scenarios. On the other hand, completely natural recordings recorded without any restrictions are hard to process with the current techniques in terms of audio-visual analysis. Moreover, capturing nat-ural recordings with high quality in their own environment is challenging and the necessary capturing hardware and software is not easily available. Another limitation is about
obtaining necessary annotations. It is difficult to obtain con-clusive results without annotations, which can be very sub-jective depending on the task and require multiple human annotators.
As a first dimension of our work, the ELEA AVS corpus that we use in this study addresses some of these limitations. We use a portable recording setup which allows to record a small group meeting anywhere. Although the scenario we apply is not completely natural, in the sense that the partici-pants are gathered for the purpose of data collection and are given a task, the meeting they perform is natural, without any predefined behaviors. The scenario used in the recordings has been specifically designed to study the possible emergence of leaders. An emergent leader is defined as the person that stands for the group during a face-to-face interaction with no hierarchical roles (predefined) and he/she has the group’s sympathy to lead [45]. Our corpus also includes a number of annotations on several individual and social concepts col-lected both from the meeting participants and from multiple external viewers.
As a second dimension of our study, we exploit the use of audio, visual, and multimodal features in small group conversations for the estimation of emergent leadership using unsupervised methods. We present an analysis for the iden-tification of the emergent leader using single as well as mul-timodal features coded from the audio-video streams. In particular, we focus on the study of features that character-ize visual attention and speaking activity of group members. Some of these features are derived from classic studies in psy-chology [6,15] but not yet studied in the context of compu-tational inference of emergent leadership. We first present a correlation analysis between the automatically extracted non-verbal features and the concepts related to emergent leader-ship. The nonverbal features are extracted from single audio and video streams based on speaking activity and visual attention. Then, we study the performance of the nonverbal features in estimating the emergent leader in the group. We also explore nonverbal features that are multimodal in nature, such as measures of looking at participants while speaking and the visual dominance ratio. Finally, we present effects of possible misalignments in the multimodal features on the estimation performance. We found that emergent leadership in our study is related, but not equivalent, to dominance, and while multimodal features bring a moderate degree of effectiveness in inferring the leader, much simpler features extracted from the audio channel are found to perform better. This paper is organized as follows: we first present related work in Sect.2. In Sect. 3, we describe the materials and procedure to collect the corpus. Section4explains the anno-tation encoding scheme. We present the nonverbal features in Sect.5. The use of single and multimodal features to infer emergent leadership on the ELEA AVS corpus is presented in Sect.6. Finally, we present our conclusions in Sect.7.
A preliminary version of this work, covering mainly the discussion on the corpus and the annotations (Sects.2–4), was presented in [43]. In the current paper, we present an analysis on the use of speaking activity features, visual atten-tion features, and multimodal features that rely on the audio-visual synchrony for estimating the emergent leader. 2 Related work
This section reviews existing corpora presented in the com-putational literature to study human behavior in small groups. We also briefly present the features and techniques that are used for the analysis of small group interaction.
Most of the corpora that have been collected to study behavior in small groups centered their attention on meet-ing scenarios where realistic rich interactmeet-ing patterns can emerge. A detailed look into these corpora reveals a variety of design choices. To promote the interaction between par-ticipants, either real or scripted scenarios can be used. The recordings can be done with a wide range of audio-visual sensors. The collected data can be annotated for different aspects, in parallel with the research question in mind. Table 1summarizes the available corpora focused on small group interactions, described in this section.
The VACE meeting corpus has been recorded using real-world scenarios (war games and military exercises) at the Air Force Institute of Technology (AFIT) [10]. The aim is to understand the structure in meetings where the objectives are clearly defined, the roles and hierarchy are known, and the planning activity is present.
Natural weekly discussions of a research group, with known roles and hierarchy, has been recorded at ICSI’s conference room [23]. The goal of this corpus is to offer resources to improve automatic speech recognition, tran-scription, prosody, and dialog modeling.
Another corpus collected real and scripted meetings on scenarios such as project planning, military exercises, games, chatting and discussion [7]. The aim of the ISL corpus is to distinguish between different kinds of meetings by charac-terizing speaking styles.
In the AMI-12 corpus, collected at the Idiap smart meeting room [25], the meeting participants have predefined roles and they follow a script. Apart from audio and video resources, a variety of manual annotations that involve verbal, nonverbal and contextual features are available. To study the analysis of dominance, the DOME corpus includes dominance anno-tations on a subset of the AMI corpus, containing 10 h of meetings recorded at the Idiap smart meeting room [2]. To analyze participants’ influence in project scenario meetings, a part of the AMI corpus was analyzed, containing 40 meetings recorded at TNO-Soesterberg [40]. Several manual annota-tions are available for this corpus, mostly derived from the audio channel.
Several studies investigated another dimension of social behavior, related to dominance and influence [10,27,40]. Another approach for capturing small group meetings is to use wearable sensors that are able to gather nonverbal signals and proximity data from short distance transmitters. In [27], a corpus was recorded with a wearable sociometer based on two scenarios: brainstorming and problem solving. The aim is to detect social interactions (including dominance) and to promote group collaboration (through real time feedback). For this corpus, nonverbal features and self-reported domi-nance annotations are available.
Participants’ involvement has also been analyzed in small business meetings. In [8], the ATR corpus is presented, which includes recordings of monthly sessions from a real group project meeting. The main goal of this corpus is to identify the type of participation and the flow of the discourse.
The NTT corpus [33] was collected with the aim of infer-ring the structure of the meeting and the participants’ roles. The corpus contains discussion scenarios in which no roles were assigned. The collected data includes audio, video, and head directions extracted from sensors.
Among the multimodal corpora in the literature, the clos-est to our work is the Mission Survival Corpus (MSC-1 and MSC-2) [29,36]. The data comprises small groups perform-ing the winter survival task. The MSC-1 focuses on the individual behavior during the decision making process; it includes audio and video recordings of four participants and functional roles annotations. The MSC-2 focuses on ana-lyzing performance, group cohesion, and personality, and used the same video recording resources used in MSC-1; in addition they performed an online 3D multi-person track-ing durtrack-ing the interaction. For audio recordtrack-ing they reduced the number of sensors to 4 close-talk microphones and one omni-directional microphone placed on the top of the table. The MSC recordings differ from our corpus in terms of par-ticipants, given that participants at MSC-1 knew each other. In terms of settings, both corpora (MSC-1 and MSC-2) used a static setup and all the meetings are recorded in a static location in a smart room.
The aim of the multimodal corpora summarized above is to analyze the multimodal human behavior in diverse settings. For the analysis, researchers extracted a variety of features, most of which have their roots from the related research in social psychology. While verbal features from the transcribed texts are used as well, most of these works focus on the nonverbal features. These nonverbal features include audio features such as speaking activity turns and interruptions; visual features such as head/hand gestures, body posture, and gaze. For modeling the social concepts, various techniques have been used including rule based methods, topic models, support vector machines, etc. Detailed information on state-of-the art features and techniques can be found in extensive surveys on the topic [1,18].
Although real scenarios have been recorded and several behaviors that emerge in small group interaction have been analyzed in the literature, the emergent leadership phenom-enon has only been recently explored in [42,44] through audio or visual nonverbal channels.
The emergent leadership phenomenon arises from group interactions in which participants do not have roles assigned. Since this appears mostly in newly formed groups, the behavior of a participant during this short interaction makes him/her succeed (or fail) as a leader, without considering past information of competence, related task performance or friendship. On the other hand, personality traits might have an impact on leadership skills [26]. In [42] we presented our first experiments on a subset of the ELEA corpus. Later on, the full ELEA corpus and a comprehensive study on emergent leadership estimation using communicative non-verbal features was presented in [44], where performance of audio and visual activity features were described separately as well as aggregated through feature fusion. The details of our experience collecting the ELEA corpus and a brief analy-sis between emergent leadership and its possible association with personality was presented at the MMC Workshop in 2011 [43].
In this work, we report the performance in the emer-gent leader inference using social attention automatically extracted from audio-visual features (e.g. looking at par-ticipants while speaking) and using a subset of the ELEA corpus. Additionally, we describe the annotations collected from external observers and we present the perception of the emergent leader from the external observers’ point of view.
3 The emergent leadership synchronized corpus
The ELEA AVS corpus is a subset of selected recordings from the ELEA corpus [44]. This subset corresponds to recordings using a fully portable setup, with no video frame dropping. The recordings are audio-video synchronized, allowing mul-timodal analysis of the emergence of leadership. The corpus consists of 22 meetings (19 meetings with four participants and 3 meetings with three participants).
For the group interactions, three or four people are seated around a table, and the audio and video is recorded, while the participants perform a winter survival task. Before and after the task, the participants fill several questionnaires to be used as ground truth in the analysis of emergent leader-ship and related concepts. The total duration of the ELEA AVS corpus is approximately five hours. We describe our practical experience with its design and implementation, and discuss results on emergent leaders inference by automati-cally extracted nonverbal features.
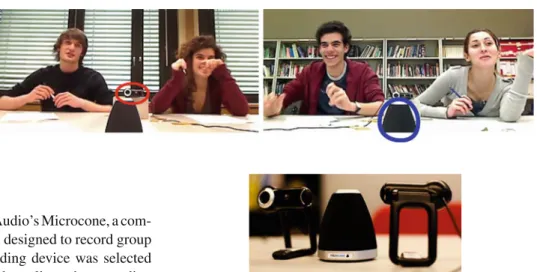
Fig. 1 A snapshot from the
ELEA AVS corpus. The webcam is circled in red (left) and the Microcone is circled in blue (right)
3.1 Sensing infrastructure
To collect the audio, we used Dev-Audio’s Microcone, a com-mercial portable microphone array designed to record group focus interactions [31]. The recording device was selected considering its portable nature, high quality voice recording in small group interactions and additionally, it is a noninva-sive voice recording device as compared to close talk micro-phones. This device directly outputs speaker segmentation for each participant (assuming that people do not change seats during the interaction), to our knowledge this is the first multimodal corpus that uses this type of voice recording device.
The video setup uses two wide-angle web cameras (Log-itech Webcam PRO 9000), with a frame size of 640× 480, at 30 fps. The design of this portable system was chosen such that it is easy to obtain and replicate in diverse set-tings, and allows adequate resolution and frame rate for our analysis purposes. Although spherical camera systems (either with a single 360◦lens or with multiple lenses) pro-vide a larger camera view, these cameras are in a higher price range and few of them meet our resolution and loss-less frame rate criteria. Given that video recordings could be susceptible to frame dropping, due to reasons not neces-sarily related to the device, we considered having a device capable to record at least up to 30 fps for a reliable fea-ture extraction. Among the portable video recording sys-tems used in social computing research, in [8], a spherical lens with a frame rate of 12 fps is used. The resolution is low and does not allow the analysis of fine details of par-ticipants’ movements. In [35], two omnidirectional cameras with fish eye lenses are used. The system provides high res-olution and 30 fps frame rate. In comparison to these video recording systems, our system uses commercial webcams and provides a cheap and easy-to-obtain solution for small group video recordings with sufficient resolution and frame rate.
The setting requires two laptops, one for the Microcone and one for the video. Since audio and video were recorded separately, the synchronization was done manually by clap-ping once in the center of the table and by aligning the streams using the clapping activity. Figures1and2show a snapshot from the recording scenario and the capture devices, respec-tively.
Fig. 2 Capture devices, the webcams and the Microcone, used in the
ELEA recordings
3.2 Subjects
Potential volunteers were invited to participate in a study on casual social interactions, the invitations were posted in Eng-lish and French offering a monetary compensation for their participation. Advertisements were placed in two universi-ties, a research center and a business management school in French-speaking Switzerland. After participants contacted us by phone or email, they were informed of the process and, if they agreed to participate, cellphone number and email were requested. Since the participants were not supposed to have previous partnership or work relationship, ad hoc groups were formed and participants were requested to attend the recordings.
Eighty-five participants were recruited, of which 31 females and 54 males in mixed teams. 19 teams are four-person and 3 teams are three-four-person. Average age is 23.1 years, with standard deviation 5.2.
3.3 Trust agreement
On arrival, participants signed a trust agreement. The agree-ment explained the process of the study, and informed them that audio and video recorded will be used only for research purposes and their identity will be anonymized. The agree-ment emphasizes the participants’ right to quit the study at any time. Participants were provided with a copy of the signed agreement, including our complete names and email addresses for their own records.
3.4 Survival task
There are several tasks that promote group discussion and decision-making. After reviewing the tasks most often used
for training in assessments centers, we chose the winter survival task, given that it promotes interactions among the participants in the group. The participants in the task are sup-posed to be survivors of an airplane crash. They have 12 items that they have to rank in order of their importance, giving 1 to the item considered the most important to survive as a group, 2 to the second most important, and so on. The task is per-formed first individually (5 min) and then we asked them to come up with the group ranking (max 15 min). Considering that not all the participants could be familiar with the items, we provided them with slides containing a picture and the definition of the item. The slides were consulted only during the individual ranking, to avoid the occlusion of the cameras during the group discussion.
3.5 Questionnaires
Four well structured questionnaires were applied, with the aim of getting ground truth for several variables from the participants in the group. For each participant, we obtained three or four questionnaire outputs, which reflected the par-ticipants’ perception. The averaged outputs are considered as the ground truth.
First we administered NEO-Five Factor Inventory (NEO-FFI) [12], which is a well known measure of the Big Five per-sonality traits: Openness to Experience, Conscientiousness, Extraversion, Agreeableness, and Neuroticism (OCEAN). We used the self-reported long version of the instrument composed of 60 items, each item has a score from 1 to 5 (‘Disagree totally’ to ‘Total agreement’).
This questionnaire was followed by the Personality Research Form (PRF) [22]. This questionnaire yields scores for personality traits relevant to the functioning of individ-uals in power dominance and leadership. It consists of 16 true-false items. After the personality tests, we recorded the survival task.
After the task, participants filled out a Perceived Interac-tion Score, that captures percepInterac-tions from participants during the interaction, in which they score every participant in the group through four items related to the following concepts: perceived leadership (PLead), perceived dominance (PDom), perceived competence (PCom) and perceived liking (PLike). The 16-item questionnaire can be scored from 1 to 5 (‘Not at all’ to ‘Frequently if not always’, respectively). Afterwards they provide a dominance ranking (RDom), i.e., participants were asked to rank the group, given 1 to the most dominant participant, and 3 or 4 for the less dominant, such that they have to include themselves in the ranking, similarly to pre-vious work in dominance annotation [24].
Finally, participants were asked to provide additional information including age, and experience in practicing out-door activities and winter sports in a scale from 1 to 5 (‘Not at all’ to ‘Frequently, if not always’). It was optional to
pro-vide additional comments to express their feelings during the interaction and about the process.
4 Questionnaire and annotations
This section describes the coding used to process the col-lected data and the results of analyzing the questionnaire data.
To keep their identity anonymized, participants chose a letter K, L, M, or N and to link them with their respec-tive questionnaires and audio/video files, the final identifier is defined as: number of group, participant letter, day and month of recording and a letter indicating the gender. Below we describe the computations done from each of the ques-tionnaires.
4.1 NEO-FFI
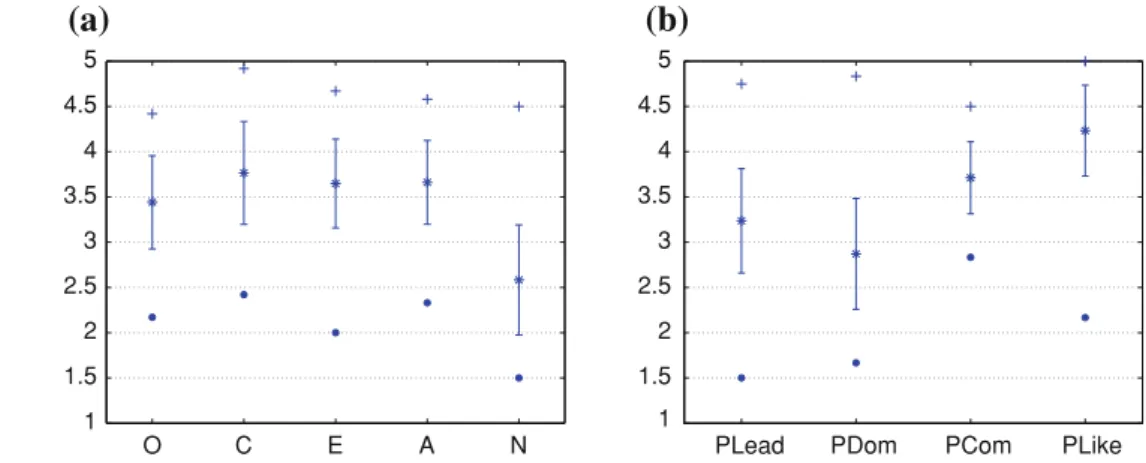
From this questionnaire, we compute mean values over the items that correspond to each of the big five traits, taking into account that some items needed to be reversed. For each person we have a vector of five real values between 1.0 and 5.0. Figure3(left) shows the distribution of the self reported personality in the ELEA AVS corpus.
4.2 PRF
Since this questionnaire is of the form true-false, we mapped the values to 1-0, such that we accumulated the number of items corresponding to power or dominance. In the data set we have two values, one corresponding to the number of items related to leadership and dominance, and a second value that represents the mean value.
4.3 Perceived interaction scores
For this questionnaire we calculated mean values for each of the perceived variables PLead, PDom, PCom, PLike, using the judgment from the other participants (i.e., not her-self/himself). We consider as ground truth the annotations from the perceived interactions, such that the emergent leader in the group is the participant with the highest mean value of perceived leadership, and similarly for the related concepts. Figure3(right) shows the distribution of the values for the perceived variables in the ELEA AVS corpus.
4.4 Ranked dominance
We calculated the value per participant as the mean value of the rank assigned from the other participants.
Fig. 3 Mean values from
questionnaires in the ELEA AVS corpus. The plot shows: minimum (filled circle), mean (asterisk), standard deviation (bar), and maximum (plus) value. Of a personality traits (O openness to experience, C conscientiousness,
E extraversion, A agreeableness and N neuroticism) and
b perceived variables (PLead
leadership, PDom dominance, PCom competence, PLike liking) O C E A N 1 1.5 2 2.5 3 3.5 4 4.5 5
(a)
PLead PDom PCom PLike 1 1.5 2 2.5 3 3.5 4 4.5 5
(b)
4.5 Survival task performance
Although there is no unique solution for the winter survival task, there is a ranking provided by experts, that justify the item rank order with more chances to survive. We used the survival experts’ ranking list to code some variables related to performance and influence, the description can be found in [44].
4.6 Perception of leadership and dominance from external observers
Using the questionnaires that the participants filled based on their interaction, we extracted the views of the participants themselves on the perceived interaction. However, research shows that the perception of the participants themselves and external observers differ [14]. To be able to evaluate these differences, we also collected judgments from external observers for two of the variables, leadership and dominance. We use the same questionnaire as filled by the participants, focusing only on leadership and dominance and excluding the questions related to other concepts. For each meeting, we assigned two external observers, one male and one female, who watched the first five minutes of the meeting video and answered eight questions for each of the participants in the meeting. The mean values are then calculated for the vari-ables of external observers: ELead and EDom.
5 Automatic nonverbal features
In addition to manual coding, our corpus includes a number of automatically extracted features. Table2summarizes the list of features extracted from the corpus, described in this section. We first describe speaking activity features, then the visual attention features, and finally audio-visual features that combine speaking activity and attention.
Table 2 Feature groups
Feature type Acronym Definition
Speaking activity (SA) SPL Speaking length SPT Speaking turns SPI Speaking interruptions ASP Average speaking turn duration Visual attention (AT) ATR Attention received
ATG Attention given
ATQ Attention quotient (ATR/ATG) ATC Attention center
Audio-visual (AV) LWS Looking while speaking LWL Looking while listening BLWS Being looked while speaking CAWS Center of attention while
speaking
VDR Visual dominance ratio (LWS/LWL)
SA speaking activity, AT visual attention, AV audio-visual features
5.1 Speaking activity features
The Microcone automatically generates a speaker segmenta-tion [31], which is easily converted to a binary segmentation in which the speaking status is represented as 1, and 0 repre-sents a non-speaking status. From the segmentation we coded the following speaking turn features:
Speaking length (SPL): contains the total speaking time of each participant i during the meeting.
Speaking turns (SPT): accumulates total turns over the entire meeting for each participant i , the turn is defined by a series of active speaking status.
Speaking interruptions (SPI): accumulates total interrup-tions over the entire meetings. Participant i interrupts participant j if i starts talking when j is speaking; when
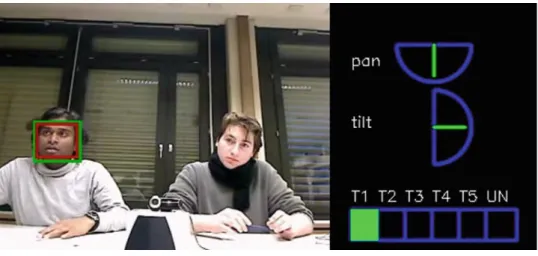
Fig. 4 Tracking, head-pose
estimation, and VFOA estimation for an individual in a group interaction in the ELEA AVS corpus. See main text for details
Average speaking turn duration (ASP): represents the averaged turn duration for each participant i during the meeting.
This set of features have been used by other researchers in previous computational works to characterize individual behavior in group interactions, specifically to recognize dom-inant behavior and status [39,24].
Furthermore, speaking time has been identified in social psychology literature as a strong indicator of dominance [30]. 5.2 Visual attention features
The extracted visual features are based on attention (denoted VFOA for Visual Focus of Attention), specifically ‘who is looking at whom or what’. First, we extract the VFOA and then construct features that could characterize an individ-ual’s behavior in group interactions. Gaze cues, along with conversational cues are known to be informative to charac-terize small group interactions [28]. Apart from facilitating the turn-taking patterns, they also signal socially relevant information, for example dominance or status [19,20].
As tracking eye gaze requires high-resolution videos, and head direction sufficiently captures eye gaze direction in con-versational settings [47], we first estimate the head pose auto-matically. The head pose is characterized by three angles: pan, tilt, and roll. Then, we assign the head pose to a discrete VFOA label in every frame. We use the method proposed in [38], that employs a dynamic, probabilistic framework to estimate the head location and pose jointly based on a standard state-space formulation. The states correspond to location and scale of the head as well as discretized head pose. The observation model uses both color features and texture features [based on Histograms of Oriented Gradients (HOG)]. The inference is done using particle filters which represents the distribution of states at each frame by a finite set of samples (or particles). The left image in Fig.4shows the tracker output location which is computed as the mean
Fig. 5 The configuration of the meeting room (where the group
inter-action took place)
(in green color) and median (in red color) of the states distri-bution. The top right part of Fig.4shows the estimated pan and tilt head pose angles represented by the green line over a semi-circumference spanning±90◦.
Considering pan and tilt only, the VFOA is later esti-mated by Maximum a Posteriori (MAP) rule. The MAP rule assumes a Gaussian distribution with mean and standard deviation pre-specified manually (in the pan and tilt space), for each of the five visual targets T1 to T5. Figure5shows the position of these visual targets with respect to the configura-tion of the room. T1, T2 are the participants sitting opposite to the participants shown in Fig.4. T3 is the participant sit-ting next to the tracked participant. T4 and T5 represent the table area close to the tracked participant and participant T3, respectively, UN stands for unfocused (i.e. any other possible VFOA). The bottom right part of Fig.4shows the estimated VFOA target (T1 for this particular frame).
In order to assess the VFOA recognition accuracy, we carried out manual annotations of the VFOA of every par-ticipant, for one randomly chosen discussion in the ELEA AVS corpus. Every 15 s, the VFOA of every participant was annotated using one annotator. The automatic method had an accuracy of 42 % (frame-level) when compared to the
man-ual annotation. The cases where the method failed belonged to two categories. The first one was due to tracking failures, which were typically due to background color effects or illu-mination issues. The second source of error are inaccuracies in head-pose estimation. Errors in tilt estimation sometimes resulted in the wrong assignment of automatic VFOA targets. Our method used a fixed mapping from head-pose angles to VFOA. As mentioned in the previous paragraph, this map-ping was pre-specified for every participant. Importantly, typ-ical VFOA accuracies obtained with similar methods in other group interaction data (e.g. the AMI corpus) are roughly in this order (see for instance [3]). Also, note that more sophis-ticated methods, which for instance model the joint VFOA of multiple people [4], could probably result in higher recog-nition performance but have not been explored here.
From the recognized VFOA labels, i.e. the visual target of each participant, the following features that capture socially relevant information are extracted:
Received attention (ATR) is the number of frames in which the participant i is looked by the other participants. Given attention (ATG) is the number of frames in which a participant i looks at other participants.
Attention quotient (ATQ) is the ratio between the amount of attention that participant i received from the other par-ticipants (ATR) and the amount of attention that partici-pant i gives to the other participartici-pants in the group (ATG). Attention center (ATC) is the total number of frames in which participant i received attention from all the partic-ipants in the group at the same time.
Similar features were originally used by Hung et al. [21] to characterize dominance in small groups in the AMI cor-pus. Furthermore, other related features have been used to capture connections between attention and personality [48], and to investigate interpersonal influence [34]. Furthermore, attention features have been discussed in some of the clas-sic works in social psychology on dominance and nonverbal behavior [15,11].
5.3 Multimodal features
The fusion of features obtained from different channels can provide a better understanding of the group interactions [33]. As described by Dovidio [13], the proportions of look-speak and look-listen in a conversation provide information about dominance and power. This finding has been verified with automatic features by Hung et al. [21]. Considering that we have extracted features related to speaking turns from the audio channel, and attention from the visual channel, we extracted the following variables.
Looking while speaking (LWS): amount of attention (in frames) that participant i gives to the participants in the group while i is speaking.
Looking while listening (LWL): amount of attention (in frames) that participant i gives to the participants in the group while i is not speaking. Note that we cannot infer that a person is listening, so we simply approximate this by non-speaking.
Being looked at while speaking (BLWS): amount of attention that participant i receives from the other par-ticipants while i is speaking.
Center of attention while speaking (CAWS): number of frames that participant i is the center of attention (i.e. all the participants are looking at her/him at the same time) while i is speaking.
Visual dominance ratio (VDR): ratio of looking while speaking and looking while listening (LWS/LWL). Some of the described multimodal features were used in [21] and showed to be useful to analyze dominance in the AMI corpus.
To compute these features, audio-visual synchronization is needed. To achieve this, the audio and visual channels were aligned, by manually localizing the synchronization point for each audio-visual sequence (i.e. using the clapping event that indicates the beginning of the group interaction).
6 Using nonverbal behavior to identify emergent leaders We now describe the use of nonverbal behavioral cues to iden-tify the emergent leader in the group. To have a clear under-standing on how the various features perform, we define an unsupervised rule-based inference that selects the participant with the maximum feature value in the group as the emergent leader.
E Lmf = arg max p ( f
m
p), p ∈ {1, 2 . . . , P}, (1) where p is the participant number, f is a nonverbal feature,
fpm is the value of feature f for participant p in group m, and P is the number of participants in the group (3 or 4 in our case).
The selection of the inference method is based on the research done by Baird, which states that a simple predic-tor of leadership can be constructed using single nonverbal behavioral features like head nodding, body shift, or verbal participation [5,46].
We use the perceived variables (PLead, PDom and RDom) from the questionnaires defined in Sect.4 as ground truth. Random performance in this case is 26.1 %, given that the synchronized corpus has 22 meetings, of which 19 meetings have four participants, and 3 meetings have three participants.
6.1 Speaking activity features
In this section we present correlations and inferences of the emergent leader in the group, using only speaking activity features.
Table3shows correlations between the speaking activity features and the perceived variables. The Pearson correla-tions are calculated per group, followed by a Fisher trans-formation and a t-test at 5 % significance level. As we can observe the amount of interruptions (SPI) are significantly correlated with PLead, PDom and RDom. Similarly, signifi-cant correlations between interruptions and concepts of dom-inance and leadership have been reported in [21,24,44].
In Table4we can observe accuracy performance of single nonverbal speaking cues extracted and the inference method in Eq.1. SPI has the best accuracy (72.7 %), which is signif-icantly higher than random performance. It has been shown that the single acoustic channel can provide good accuracy performance in the prediction on dominance in small groups (up to 85 %) using SPL [24], although in our case, the sur-vival task and the scenario with unacquainted people resulted on a more challenging case (up to 54.5 %).
6.2 Visual attention features
In this section we present correlations between the visual attention and the perceived variables, followed by the results of the emergent leader inference (and related concepts) using the estimator defined in Eq.1. Table5shows Pearson corre-lations between the features extracted from attention and the perceived variables. The Pearson correlations are calculated per group, followed by Fisher transformation and a t test at
Table 3 Pearson correlations between speaking activity features and
perceived variables
SPL SPT SPI ASP
PLead 0.506∗ 0.492∗ 0.548∗ 0.46∗
PDom 0.290+ 0.373∗ 0.403+ 0.235
RDom 0.492∗ 0.408∗ 0.538∗ 0.474∗
SPL speaking length, SPT speaking turns, SPI speaking interruptions, ASP average speaking turn duration
Significance values+p< 0.05,∗ p< 0.01
Table 4 Accuracy (%) performance from speaking activity cues on the
ELEA AVS corpus
SPL SPT SPI ASP
PLead 54.5 45.5 72.7 45.5
PDom 31.8 40.9 45.5 40.9
RDom 54.5 36.4 63.6 50.0
Random performance is 26.1 %
Table 5 Pearson correlation and features from attention
ATR ATG ATQ ATC
PLead 0.330∗ 0.013 0.233+ 0.286∗
PDom 0.374∗ −0.060 0.306+ 0.355∗
RDom 0.306∗ 0.075 0.134 0.173
ATR attention received, ATG attention given, ATQ attention quotient, ATC attention center
Significance values+p< 0.05,∗ p< 0.01
5 % significance level. As we can observe, there are signif-icant correlations between ATR, and the variables PLead, PDom and RDom.
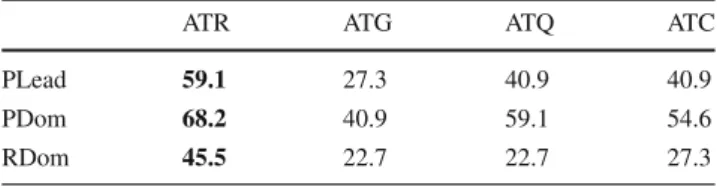
Single features obtained from visual attention help to iden-tify the emergent leader up to 59.1 %. The amount of attention received (ATR) from participants is the most informative cue, followed by the amount of attention received from the group (ATC) with 40.9 %. For the case of PDom, the best perfor-mance is 68.2 % as well with the feature ATR, this reflects that the most dominant participant receives the largest amount of visual attention in the group. The results are shown in Table6. Further, we reviewed the correlations between the visual attention and the acoustic nonverbal features. In Table7we can observe significant correlations between the attention received ATR and SPL, SPT and SPI. Also the correlations between ATQ and, SPL, SPT and SPI are significant. Finally a low but significant correlations can be observed between ATC and, SPL and SPT.
The correlations between SPL and ATR, although lower compared with the ones reported in [48] using a winter sur-vival task scenario, show that the attention received in small groups is correlated to the total amount of speaking activity
Table 6 Accuracy (%) performance from visual attention features on
the ELEA AVS corpus
ATR ATG ATQ ATC
PLead 59.1 27.3 40.9 40.9
PDom 68.2 40.9 59.1 54.6
RDom 45.5 22.7 22.7 27.3
Random performance is 26.1 %
Table 7 Pearson correlation between acoustic nonverbal features and
attention
ATR ATG ATQ ATC
SPL 0.214+ −0.007 0.183+ 0.117∗
SPT 0.218+ −0.063 0.224+ 0.147∗
SPI 0.327∗ −0.154 0.381∗ 0.230
ASP 0.143 0.004 0.138 0.063
Table 8 Pearson correlation between multimodal features and attention
ATR ATG ATQ ATC
LWS 0.131 0.449∗ −0.189 −0.037
LWL −0.351∗ 0.560∗ −0.654∗ −0.368∗
BLWS 0.751∗ −0.118 0.562∗ 0.581∗
CAWS 0.808∗ −0.218 0.667∗ 0.852∗
VDR 0.328∗ 0.011 0.244+ 0.185
LWS looking while speaking, LWL looking while listening, BLWS being looked at while speaking, CAWS center of attention while speaking, VDR visual dominance ratio
Significance values+p< 0.05,∗ p< 0.01
Table 9 Accuracy (%) performance from frame based multimodal
fea-tures on the ELEA AVS corpus
LWS LWL BLWS CAWS VDR
PLead 50.0 40.9 63.6 63.6 50.0
PDom 31.8 40.9 59.1 63.6 36.4
RDom 50.0 36.4 45.5 45.5 54.5
Random performance is 26.14 %
and, in our case it also correlates with the successful inter-ruptions to grab the floor.
6.3 Multimodal features
In this section we first present correlations between multi-modal (i.e. audio-visual) and single features, followed by the results of identification of the emergent leader and related concepts using multimodal features. Table8shows correla-tions between multimodal features and visual attention fea-tures, as we can observe there are significant correlations between CAWS and ATR, CAWS and ATC, and, CAWS and ATQ. The strong correlations suggest that being the center of group attention while speaking is connected to the amount of attention received as much as being the visual attention center during the meeting. Similarly, significant correlations can be observed between BLWS and ATR, BLWS and ATQ, and BLWS and ATC. Finally, there are significant negative correlations between LWL and ATR, ATQ and ATC.
Considering that nonverbal behavior extracted from audio and visual single channel can be used to identify the emergent leaders [44], multimodal features extracted from synchro-nized audio and video might provide a better understanding of the nonverbal behavior of the emergent leader. Table9 shows performance using the unsupervised method and the multimodal features, where the best performance to identify the leader is using either BLWS or CAWS with up to 63.6 %. With the aim of having a better understanding on how mul-timodal features can perform for PLead, PDom and RDom, we also considered an event-based evaluation strategy. To do this, we count only the times that an event (i.e. segment of
Table 10 Accuracy (%) performance from event based multimodal
features on the ELEA AVS corpus
LWS LWL BLWS CAWS VDR
PLead 50.0 54.5 54.5 68.2 50.0
PDom 40.9 45.5 45.5 59.1 36.4
RDom 50.0 45.5 54.5 50.0 54.5
Random performance is 26.14 %
Table 11 Best accuracy performance (%) from the single and
multi-modal features on the ELEA AVS corpus
Variable Accuracy (%) Feature
SA PLead 72.7 SPI PDom 45.5 SPI RDom 63.6 SPI AT PLead 59.1 ATR PDom 68.2 ATR RDom 45.5 ATR AV PLead 63.6 CAWS PDom 63.6 CAWS RDom 54.5 VDR Random performance is 26.1 %
SPI speaking interruptions, ATR attention received, CAWS center of attention while speaking, VDR visual dominance ratio
consecutive frames with the same multimodal feature) occurs during the meeting instead of counting the exact number of frames in which this event occurs. Considering this option, we can observe in Table10that the event-based accuracy to infer the emergent leader in the group increases up to 68.2 %, on the other hand the inference of the perceived dominant participant in the group decreases from 63.6 % to 59.1 % for the best multimodal feature (CAWS).
Finally the performance of single and multimodal features is summarized in Table11, as we can observe the best single predictor of emergent leader is SPI, followed by CAWS.
Our findings in PLead and RDom, show that the speaking nonverbal cues perform better than the visual and multimodal cues, as similarly reported in dominance estimation using the AMI corpus in [21,24]. Additionally, the visual attention per-formance reported in [21] was estimated considering manual annotations, which perhaps reflect a better performance in both the visual and the multimodal features. In contrast in the ELEA AVS corpus the visual attention cues performed better for the perceived dominance (PDom) than only audio cues and slightly better than the multimodal cues. Overall the variable PLead achieved the highest accuracy performance using single speaking activity features. In addition, the corre-lations performed suggest a connection between leadership and dominance but they are not exactly the same. Finally, the results showed in Table11suggest that the recorded scenario
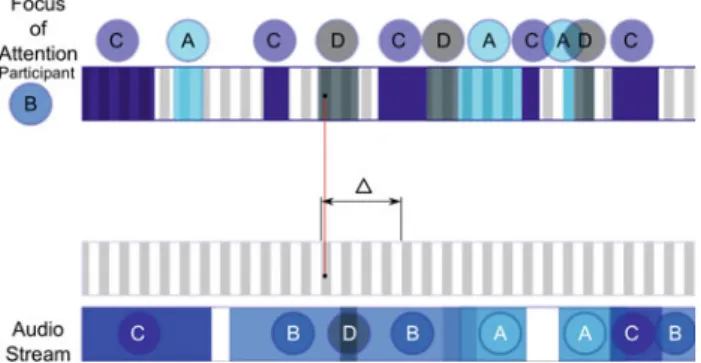
Fig. 6 Frame alignment window between visual attention and
speak-ing activity streams. The frame i in the attention stream, is aligned with a slide window from the frame i to the frame i+ δ in the speaking activity stream
in the ELEA AVS corpus is more challenging than the exist-ing small group corpora used to estimate vertical dimensions, although the data is limited to 22 recordings, and the numbers need to be considered carefully.
6.4 Time delay in multimodal features
As discussed is Sect.3, frame dropping can occur during video recordings, given to several reasons including applica-tions running in background. To test the effects of possible misalignment between the audio and the video channels, we define a alignment-match from the video frame i with a win-dow from i to i+δ with the respective audio stream, where δ denotes the width of the temporal window in frames. Figure6 shows the time delay synchronization window applied.
A video generated from different audio and video chan-nels could be susceptible to frame dropping, while playing the merged video, if it is not well synchronized, we could notice a delay between the visual activity (while speaking) and the audio sound. Considering that our corpus was col-lected using separated audio and video recording devices, we explored the impact of the delay in the multimodal extracted features. In our experience, as it is most likely that the frame dropping occurs in the video stream, we considered the effect of slight dropping frame in the video channel on the multi-modal features.
Figure 7 shows the accuracy considering the variables PLead, PDom and RDom). The X-axis represents the amount of frames considered (δ from 1 to 60). The Y-axis represents the accuracy performance, using the Equation1defined in the beginning of Sect.6.
As we can observe, in Fig.7the multimodal features can be robust in frame dropping situations, if an alignment window is considered with respect to the audio stream. Additionally, for the case of the frame by frame synchronized features (δ = 0), it is most likely that very short turns might be missed, due to the misalignment, but on the other hand longer turns will be captured more accurately.
6.5 Results with external annotations
We finally present emergent leader inference results using the external perceptions of dominance and leadership pre-sented in Sect.4. Considering the judgment from the exter-nal observers on the perception of the leader in the group (ELead), our framework obtains up to 50 % accuracy, with the features ASP, ATR and CAWS; for the case of domi-nance (EDom) the highest accuracy is 59.1 % using ATR and CAWS. These results are lower than the ones obtained with the judgment of the participants in the group. It is worth to mention that the external observers gave their highest scores to the same person in the ELead and EDom measures. In 95 % of the cases, one participant in the group is perceived by exter-nal observers as both leader and dominant. On the other hand, considering the perception from the interacting participants, in only 63.6 % of the cases the same participant is perceived as the leader and perceived as dominant. Figure8shows aver-aged values from ELead, EDom and PLead, PDom from the ELEA AVS corpus. Calculating Pearson correlation between leadership and dominance, for ELead and EDom we have a significant correlation of 0.96 (p = 3.31E − 12), for the case of PLead and PDom we have 0.75 (p = 1.39E − 04). This suggests that there is a connection between the leadership and dominance in both the perception of the participants in the group and perception from external observers.
6.6 Discussion
Our findings in the ELEA AVS corpus reveal that speak-ing activity is a better estimator of emergent leadership than visual attention. On the other hand, the amount of visual attention received is more informative for the perception of dominance between the participants in the group. Although the multimodal features are not the best descriptor of lead-ership, nor of dominance, they provide some information about the perceived leadership during the interaction, such that being the center of attention while speaking correlates with being perceived as the leader.
We also observed strong correlations between perceived leadership and perceived dominance, for both the participants in the group and the external observers. However, the external observers perceived the leader in the group as a dominant person most of the time, in contrast with the perception of the participants in the group where leadership and dominance are less correlated.
Although we employed similar automatically extracted features and similar methods to identify dominance as in [21,24], our results suggest that the ELEA corpus scenario is challenging, specially in comparison with small-group cor-pora recorded with pre-assigned roles.
There are some limitations to be aware of. First, the corpus is relatively small, despite our efforts to collect data. This has
Fig. 7 Accuracy performance
(%) from multimodal features using a time delay alignment window with the audio stream
RDom
0 10 20 30 40 50 60 0
0.5
Looking while Speaking (LWS)
0 10 20 30 40 50 60 0
0.5
Looking while Listening (LWL)
0 10 20 30 40 50 60 0
0.5
Being Looked at while Speaking (BLWS)
0 10 20 30 40 50 60 0
0.5
Center of Attention while Speaking (CAWS)
0 10 20 30 40 50 60 0
0.5
Visual Dominance Ratio (VDR)
PLead PDom RDom
1 2 3 4 5 1 1.5 2 2.5 3 3.5 4 4.5 5 Leadership Dominance (PLead, PDom) (ELead, EDom)
Fig. 8 Comparison of External annotations and perception from
par-ticipants, for all individuals in the ELEA AVS corpus(N = 85). Each data point shows the averaged perceived values of leadership and dom-inance for each participant, either (PLead, PDom) or (ELead, EDom), for perceived and external annotations respectively
to do with the requirement of having to engage only people who do not know each other, and shows the difficulty of collecting data even with portable sensors. The size of the
corpus puts limits on the statistical confidence of the results. Second, the VFOA features that are automatically extracted are known to have a performance that is not very high (42 % frame-level accuracy on a subsample of the data). We did not conduct studies using manual VFOA labels. This is an important issue but involves a significant amount of manual work for the five hours of the corpus, and could be part of future work. Third, clearly other better inference methods could have been used, but in this work we made the explicit decision of using something relatively simple. Future work could extend this part using other, more complex, machine learning methods.
7 Conclusions
We presented in this paper a new data corpus, collected with the aim of analyzing emergent leadership in small groups. The novelty of our synchronized corpus is that it is collected with a portable recording solution, and it contains a detailed set of questionnaires related to perceived leadership,
person-ality, and performance collected from the participants in each group.
The annotations available for every group include the big five personality scores, scores on dominance and lead-ership, scores from perceived and self reported leadlead-ership, dominance, competence, and likability, as well as external observer annotations for the same characteristics. The cor-pus also includes individual and group outcomes from the performed survival task, coded as individual performance, group performance, and individual influence. Finally, the cor-pus includes automatically extracted features from speaking activity, visual focus of attention, and multimodal features.
As an illustration of research questions that can be addressed with this corpus, we presented a study on automatic inference of emergent leadership using audio features based on speaking activity, video features based on visual attention, as well as multimodal features. We also compared leadership and dominance perception between external observers and participants in the group.
As future work, the effect of other interesting automat-ically extracted features, including floor patterns and emo-tional states on estimating the leader in the group can be investigated. The floor patterns and the emotional states of the participants can be extracted based on their nonverbal behav-ior to explore the impact on the perception and estimation of leadership and dominance. Similarly, emerging social inter-actions, such as involvement or control, which are known to be informative for leadership, can also be studied. Another dimension of future work would be to study the personality of the participants as an influence factor during the interac-tion and its influence on the percepinterac-tion of the leader in the group.
Acknowledgments We thank Iain McCowan (dev-audio) for tech-nical support; Denise Frauendorfer and Pilar Lorente (University of Neuchatel), Radu-Andrei Negoescu (Idiap) for help during the data collection and for data processing, Jean-Marc Odobez (Idiap) for shar-ing code for VFOA extraction, and all the participants in the recordshar-ings. D. Sanchez-Cortes was supported by CONACYT (Mexico) through a doctoral scholarship and the Swiss NSF SONVB project. O. Aran was supported by the projects NOVICOM (EU FP7-IEF) and SOBE (Swiss NSF Ambizione grant no: PZ00P2-136811). D. Jayagopi was supported by the HUMAVIPS project (EU FP7).
References
1. Aran O, Gatica-Perez D (2011) Analysis of group conversations: modeling social verticality. In: Gevers T, Salah AA (eds) Computer analysis of human behavior. Springer, London, pp 293–322 2. Aran O, Hung H, Gatica-Perez D (2010) A multimodal corpus
for studying dominance in small group conversations. in: Work-shop international conference on language resources and evalua-tion, LREC
3. Ba S, Odobez J (2009) Recognizing visual focus of attention from head pose in natural meetings. Syst Man Cybern Part B Cybern IEEE Trans 39(1):16–33
4. Ba S, Odobez J (2011) Multi-person visual focus of attention from head pose and meeting contextual cues. Pattern Anal Mach Intell IEEE Trans 33(1):101–116
5. Baird JE (1977) Some non-verbal elements of leadership emer-gence. Southern Speech Commun J 42(4):352–361
6. Bales R, Strodtbeck F (1951) Phases in group problem-solving. J Abnorm Soc Psychol 46:485–495
7. Burger S, MacLaren V, Yu H (2002) The ISL meeting corpus: the impact of meeting type on speech style. In: International conference on spoken language processing, Interspeech-ICSLP
8. Campbell N, Sadanobu T, Imura M, Iwahashi N, Noriko S, Doux-champs D (2006) A multimedia database of meeting and infor-mal interactions for tracking participant involvement and discourse flow. In: Workshop international conference on language resources and evaluation, LREC
9. Carletta J, Ashby S, Bourban S, Flynn M, Guillemot M, Hain T, Kadlec J, VK, Kraaij W, Kronenthal M, Lathoud G, Lincoln M, Lisowska A, McCowan I, Post W, Reidsma D, Wellner P (2005) The AMI meeting corpus: a pre-announcement. In: Workshop on machine learning and multimodal interaction, ICMI-MLMI 10. Chen L, Rose TR, Parrill F, Han X, Tu J, Huang Z, Harper M,
Quek F, McNeill D, Tuttle R, Huang T (2005) Vace multimodal meeting corpus. In: Workshop on machine learning and multimodal interaction, ICMI-MLMI
11. Cook M, Smith JMC (1975) The role of gaze in impression forma-tion. Br J Soc Clin Psychol 14(1):19–25
12. Costa P, McCrae R (1992) NEO PI-R profesional manual. 13. Dovidio J, Ellyson S (1982) Decoding visual dominance:
Attri-butions of power based on relative percentages of looking while speaking and looking while listening. Soc Psychol Q 45(2):106– 113
14. Dunbar NE, Burgoon JK, Dunbar NE, Burgoon JK (2005) Per-ceptions of power and interactional dominance in interpersonal relationships. J Soc Pers Relationsh 22(2):207–233
15. Efran J (1968) Looking for approval: effects of visual behavior of approbation from persons differing in importance. J Pers Soc Psychol 10(1):21–25
16. Garofolo I, Michel M, Laprun C, Stanford V, Tabassi E (2004) The NIST meeting room pilot. In: International conference on language resources and evaluation, LREC
17. Gatica-Perez D (2006) Analyzing group interactions in conversa-tions: a review. In: International conference on multisensor fusion and integration for intelligent systems, pp 41–46
18. Gatica-Perez D (2009) Automatic nonverbal analysis of social interaction in small groups: a review. Image Vis Comput 1(12) 19. Hall JA, Coats EJ, Smith L (2005) Nonverbal behavior and the
vertical dimension of social relations: a meta-analysis. Psychol Bull 131(6):898–924
20. Harrigan J (2005) Proxemics, kinesics, and gaze. The new hand-book of methods in nonverbal behavior research. pp 137–198 21. Hung H, Jayagopi DB, Ba S, Odobez JM, Gatica-Perez D (2008)
Investigating automatic dominance estimation in groups from visual attention and speaking activity. In: International conference on multimodal interfaces, ICMI, pp 233–236
22. Jackson DN (1967) Personality research form manual. Research Psychologists Press
23. Janin A, Baron D, Edwards J, Ellis D, Gelbart D, Morgan N, Peskin B, Pfau T, Shriberg E, Stolcke A, Wooters C (2003) The ICSI meeting corpus. In: International conference on acoustics, speech, and signal processing, ICASSP
24. Jayagopi D, Hung H, Yeo C, Gatica-Perez D (2009) Modeling dominance in group conversations using nonverbal activity cues. IEEE Trans Audio Speech Lang Process 17(3)
25. Jovanovic N, op den Akke R, Nijholt A (2005) A corpus for study-ing addressstudy-ing behavior in multi-party dialogues. In: The sixth Sig-Dial conference on discourse and dialogue
26. Kickul J, Neuman G (2000) Emergent leadership behaviours: The function of personality and cognitive ability in determining team-work performance and ksas. J Business Psychol 15(1)
27. Kim T, Chang A, Holland L, Pentland A (2008) Meeting media-tor: enhancing group collaboration with sociometric feedback. In: Conference on computer supported cooperative work, CSCW 28. Knapp ML, Hall JA (2008) Nonverbal communication in human
interaction. Wadsworth, Cengage Learning
29. Mana N, Lepri B, Chippendale P, Cappelletti A, Pianesi F, Svaizer P, Zancanaro M (2007) Multimodal corpus of multi-party meet-ings for automatic social behavior analysis and personality traits detection. In: Workshop on tagging, mining and retrieval of human related activity information, TMR
30. Mast MS (2002) Dominance as expressed and inferred through speaking time: a meta-analysis. Hum Commun Res 28(3):420–450 31. McCowan I (2011)http://www.dev-audio.com/
32. McCowan I, Gatica-Perez D, Bengio S, Lathoud G, Barnard M, Zhang D (2005) Automatic analysis of multimodal group actions in meetings. PAMI 27(3):305–317
33. Otsuka K, Takemae Y, Yamato J, Murase H (2005) Probabilistic inference of multiparty-conversation structure based on markov-switching models of gaze patterns and head directions and utter-ances. In: International conference on multimodal interfaces, ICMI 34. Otsuka K, Yamato J, Takemae Y, Murase H (2006) Quantify-ing interpersonal influence in face-to-face conversations based on visual attention patterns. In: CHI ’06 extended abstracts on human factors in computing systems, ACM, New York, NY, USA, CHI EA ’06, pp 1175–1180
35. Otsuka K, Araki S, Ishizuka K, Fujimoto M, Heinrich M, Yamato J (2008) A realtime multimodal system for analyzing group meet-ings by combining face pose tracking and speaker diarization. In: International conference on multimodal interfaces, ICMI 36. Pianesi F, Zancanaro M, Lepri B, Cappelletti A (2007) A
multi-modal annotated corpus of consensus decision making meetings. Lang Resour Eval 41:409–429
37. Poole MS, Holligshead AB, McGrath JE, Moreland RL, Rohrbaugh J (2004) Interdisciplinary perspectives on small groups. Small Group Res 35(1):3–16
38. Ricci E, Odobez J (2009) Learning large margin likelihoods for realtime head pose tracking. In: International conference on image processing, ICIP
39. Rienks R, Heylen D (2005) Dominance detection in meetings using easily obtainable features. In: Bourlard H, Renals S (eds) Revised selected papers of the 2nd joint workshop on multimodal inter-action and related machine learning algorithms, Springer, Berlin, pp 76–86
40. Rienks R, Zhang D, Gatica-Perez D, Post W (2006) Detection and application of influence rankings in small group meetings. In: Inter-national conference on multimodal interfaces, ICMI
41. Salas E, Sims DE, Burke CS (2005) Is there a big five in teamwork. Small Group Res 36(5):555–599
42. Sanchez-Cortes D, Aran O, Mast MS, Gatica-Perez D (2010) Identifying emergent leadership in small groups using nonverbal communicative cues. In: International conference on multimodal interfaces, ICMI
43. Sanchez-Cortes D, Aran O, Gatica-Perez D (2011) An audio visual corpus for emergent leader analysis. In: Workshop on multimodal corpora for machine learning: taking stock and road mapping the future, ICMI-MLMI
44. Sanchez-Cortes D, Aran O, Mast MS, Gatica-Perez D (2011) A nonverbal behavior approach to identify emergent leaders in small groups. IEEE Trans Multimed
45. Stein RT (1975) Identifying emergent leaders from verbal and non-verbal communications. Pers Soc Psychol 32(1):125–135 46. Stein RT, Heller T (1979) An empirical analysis of the correlations
between leadership status and participation rates reported in the literature. J Pers Soc Psychol 37(11):1993–2002
47. Stiefelhagen R, Zhu J (2002) Head orientation and gaze direction in meetings. In: CHI’02 Extended abstracts on human factors in computing systems, CHI EA ’02
48. Subramanian R, Staiano J, Kalimeri K, Sebe N, Pianesi F (2010) Putting the pieces together: Multimodal analysis in social attention in meetings. In: ACM Multimedia, MM