Predicting the impacts of climate change on genetic
diversity in an endangered lizard species
Sylvain Dubey&David A. Pike&Richard Shine
Received: 22 July 2010 / Accepted: 27 June 2012 / Published online: 21 July 2012 # Springer Science+Business Media B.V. 2012
Abstract Many endangered species persist as a series of isolated populations, with some populations more genetically diverse than others. If climate change disproportionately threatens the most diverse populations, the species’ ability to adapt (and hence its long-term viability) may be affected more severely than would be apparent by its numerical reduction. In the present study, we combine genetic data with modelling of species distri-butions under climate change to document this situation in an endangered lizard (Eulamprus leuraensis) from montane southeastern Australia. The species is known from only about 40 isolated swamps. Genetic diversity of lizard populations is greater in some sites than others, presumably reflecting consistently high habitat suitability over evolutionary time. Species distribution modelling suggests that the most genetically diverse populations are the ones most at risk from climate change, so that global warming will erode the species’ genetic variability faster than it curtails the species’ geographic distribution.
1 Introduction
There is broad scientific consensus that global climate change will imperil many species, but the pathways by which taxa will be affected remain unclear. The simplest situation involves the disappearance or spatial displacement of suites of climatic conditions upon which a species relies, but less overt challenges to species viability may be important also. For example, climate change might pose a disproportionately high threat to specific populations
S. Dubey (*)
Department of Ecology and Evolution, Biophore Bld, University of Lausanne, 1015 Lausanne, Switzerland
e-mail: [email protected] D. A. Pike
:
R. ShineSchool of Biological Sciences A08, University of Sydney, Sydney, NSW 2006, Australia Present Address:
D. A. Pike
whose loss would threaten the long-term viability of the species as a whole. Vulnerability to climate change may be highest for taxa that are already rare, and are restricted to habitats whose distinctive climates will disappear under warming climates (e.g. Theurillat and Guisan 2001; Dirnbock et al. 2003; Dubey and Shine 2011). For example, montane topography may preclude dispersal to the nearest climatically suitable area, especially for low-vagility taxa such as many reptiles and amphibians (Araujo and Pearson2005; Smith and Green 2005; Araujo et al. 2006). The problem is exacerbated for species that are restricted to habitat fragments, especially if that pattern of population subdivision has persisted over evolutionary time (thus generating genetic discontinuities across the species’ range) rather than as a result of recent (e.g., anthropogenic) habitat loss (e.g. Mitrovski et al. 2007; Finger et al.2009; Dubey and Shine2010a,b). In combination, these attributes may render a species vulnerable not only to the most overt consequence of climate change– a reduction in the area providing suitable climatic conditions– but also in more subtle ways, whereby spatially variable impacts of climate change are overlaid on heterogeneity in genetic traits of the threatened taxon.
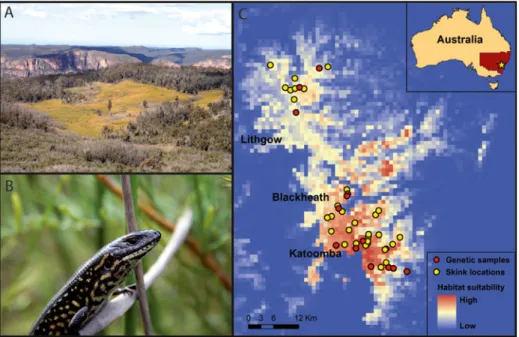
We studied the effects of predicted climate change on genetic diversity in a lizard species that fits all of the above criteria. It is endangered, and restricted to a specialised type of montane swamp with a highly disjunct distribution in the Great Dividing Range west of Sydney, New South Wales, Australia (Fig.1). Most of the known populations (about 40) likely consist of relatively few individuals each: the swamps are small (typically < 1 ha) and mark-recapture studies suggest low population sizes (Dubey and Shine 2010a). Some populations have much higher genetic diversity than others (Dubey and Shine 2010a,b),
Fig. 1 a typical swamp habitat of the Blue Mountains Water Skink (Eulamprus leuraensis), b an adult Blue Mountains Water Skink, and c the entire geographic distribution of this lizard species, with indices of habitat suitability as predicted by maximum entropy modelling (Maxent) under current climatic conditions. The map also shows sites where we collected tissue samples for genetic analyses, as well as all known localities used in Maxent modelling
providing an opportunity for us to examine (1) which populations contain the highest genetic diversity; and (2) whether climate change may disproportionately affect such populations.
2 Materials and methods 2.1 Study species and sampling
The Blue Mountains Water Skink (BMWS; Eulamprus leuraensis) is a medium-sized (to 85-mm snout–vent length (SVL), 15 g; Dubey et al.2010) viviparous lizard. The most distant populations are separated by less than 70 km and within its range the species is found only within distinctive types of swamps that result from porous sandstone overlaying non-porous claystone; the system also depends upon a narrow range in rates of runoff (Young and Wray 2000; Fig.1a). Analyses of mitochondrial and microsatellite markers have shown that most local populations are genetically distinctive, with little gene flow even between adjacent habitat patches (Dubey and Shine2010a,b). Tissue samples were collected as part of a larger study on conservation genetics of this endangered species (see Dubey and Shine2010a,b; for sampling protocols and laboratory methods). Calculation of genetic diversity was based on (i) a mitochondrial gene (NADH dehydrogenase subunit 4; nucleotide diversity; Dubey and Shine 2010a) and (ii) seven microsatellite markers, (allelic richness; Dubey and Shine 2010b), derived from 13 populations and 234 and 241 individuals, respectively. Unlike microsatellite markers, mtDNA can be impacted by older events as well as recent ones, because mtDNA evolves more slowly and is maternally inherited. Therefore, the two types of markers can convey different types of information (see e.g. Brown et al. 2005; Bruyndonckx et al.2010; Dubey and Shine2010a,b; Ferchaud et al.2011).
2.2 Modeling approach
We used Maxent version 3.3.2 (Phillips et al.2006) to model the distribution of skinks; this approach has equalled or outperformed other species distribution modelling algorithms (e.g., Elith et al. 2006; Hernandez et al. 2006). Briefly, locality data and randomly-sampled background points are combined with climatic data to predict the probability of occurrence of the target species within each grid cell. We obtained georeferenced locality data for BMWS from a Wildlife Atlas (compiled by the Department of Climate Change, Environment, and Water) and used 19 climate variables to describe annual and seasonal variation in temperature and precipitation (for details see Hijmans et al. 2005). Current climatic conditions were averaged over the period 1950 to 2000 (Hijmans et al.2005), and we also modelled distributions under two different emission scenarios (low: B2, high: A2) using three climate change models (CCCMA-CGCM2, CSIRO-MK2, HADCM3) for the years 2020 and 2050 (Intergovernmental Panel on Climate Change 2001). Climate data consisted of 1×1 km grid cells and we restricted our study area to a 100 km buffer around all known BMWS populations.
We used the Maxent default parameters (for full details see Phillips et al. 2006,2009; Phillips and Dudík 2008) and a 10-fold crossvalidation approach to alleviate bias with respect to locality data. This method divided presence locations (n045, each within a unique grid cell) into ten approximately equal partitions, with nine of the partitions used to train the model and the tenth to test the model. These partitions were run through sequentially, to generate ten maps (one per run) with each grid cell containing a single value to represent the probability of skinks occurring within that cell (hereafter referred to as our “habitat
suitability” score). Suitability values range from 0 (unsuitable habitat) to 1.0 (highly suitable habitat), with 0.5 representing habitat suitability at typical presence locations (Phillips and Dudík2008). Previous analyses have found that this measure of habitat suitability correlates positively with abundance data for a wide range of taxa, including lizards (VanDerWal et al. 2009). We averaged the 10 resultant maps for current climatic conditions, and the three different B2 (low emission) and A2 (high emission) scenarios for the models CCCMA-CGCM2, CSIRO-MK2, and HADCM3. This method generated a single low and high average prediction for the species’ distribution in 2020 and 2050. We also examined habitat suitability scores for each of the 13 populations for which we have genetic data, under each climate change scenario.
We evaluated model performance using the area under the receiver operating character-istic curve (AUC). The AUC is the probability that randomly selected occurrence points and randomly selected background points are classified correctly. Random models have a value close to 0.5, with better discrimination between occurrences and background points as AUC approaches 1.0. We used a one-tailed binomial probability to test the null hypothesis that the presence points are no better at predicting a distribution than the random sample of background points (Phillips et al.2006). All statistical comparisons between the Maxent (habitat suitability) scores and genetic diversity (nucleotide diversity and allelic richness) were performed in JMP 7.0 (SAS Institute Inc2007)
3 Results
3.1 Mitochondrial marker
Differences in levels of nucleotide diversity among the 13 populations were not an artefact of sample sizes (no significant relationship between genetic diversity index and number of lizards sampled per population: linear regression, F1,1200.002, R2<0.01, P00.96; see Dubey and Shine2010afor details).
The climate variables we used robustly predicted lizard distributions under current climatic conditions (Training AUC00.99±0.0002, Test AUC00.99±0.002). Over 90 % of the variation in these models was attributable to annual temperature variation (i.e., isother-mality) and precipitation variables (Table1). The distribution map generated under current climatic conditions suggested that skinks are distributed throughout their entire climatic envelope (Fig.1c).
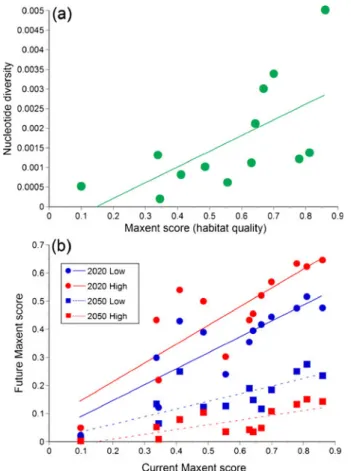
In a spatial comparison, areas with highly suitable habitat (based on Maxent scores) contained more genetically diverse lizard populations (under current climatic conditions; linear regression, n013 populations, F1,1207.68, R200.41, P00.018; Fig. 2a). That is, populations with high genetic diversity are found in areas with high suitability scores, and populations with low genetic diversity occur in areas with lower suitability scores.
The same pattern was observed in comparisons between the nucleotide diversity and the habitat-suitability scores for 2020 (linear regression, n013 populations, high emission scenario: F1,12 05.73, R200.34, P00.036; low emission scenario: F1,12 04.94, R200.31, P00.048): However, the relationship between these variables is not statistically significant for 2050 (linear regression, n013 populations, high emission scenario: F1,12 03.48, R20 0.24, P00.09; low emission scenario: F1,1201.49, R200.12, P00.25). Consequently, this relationship weakens through time, suggesting that sites with a currently high genetic diversity are not those with the highest predicted habitat suitability (highest maxent score) by 2050.
We also found significant and positive relationships between the current and future Maxent scores (n013 populations, linear regressions; High 2020: F1,12026.19, R200.70, P <0.001; Low 2020: F1,12029.07, R200.73, P<0.001; High 2050: F1,12013.18, R200.55, P<0.01; Low 2050: F1,12014.91, R200.58, P<0.01; Fig. 2b). That is, areas that are currently more suitable for the species are likely to remain relatively suitable even under climate change.
However, Maxent calculations under a range of climate-change scenarios predicted that habitat suitability overall will decrease rapidly for this endangered species (two-tailed paired t-tests comparing current Maxent values at the 13 sampled populations with those of 2020 and 2050; all P<0.01). That is, sites that are currently suitable will become increasingly less favourable (e.g., compare mean suitability scores for 2020 vs 2050 scenarios in Fig. 2b). Importantly, the sites that are likely to decrease most in habitat suitability are the ones that are currently best for the species; note that the slope of the lines linking current to future suitability in Fig.2bdecline through time, such that by 2050 all sites have relatively similar (and low) habitat suitability (Maxent) scores.
Because lizard populations in the habitat patches with the highest habitat suitability scores also currently have the highest genetic diversity (Fig. 2a), a disproportionate climate change impact on the “best” sites (Fig. 2b) means that the most genetically diverse lizard populations will be the most vulnerable to climate change. Figure 2b confirms that the magnitude of decrease in predicted habitat suitability under climate change is greatest for populations that currently contain the highest levels of nucle-otide diversity. Linear regressions between the change in habitat suitability (future minus current scores) and the genetic diversity of populations under the different scenarios, were non-significant but negative for 2020 (High: linear regression, F1,120 1.27, R200.10, P00.28; Low: linear regression, F1,1203.43, R200.24, P00.09; Fig. 3) and significant and negative for 2050 (High: linear regression, F1,1207.08, R200.39, P< 0.022; Low: linear regression, F1,1209.29, R200.46, P<0.011; Fig. 3). These predicted changes in nucleotide diversity can be visualised in geographic space by converting the Maxent habitat suitability scores into nucleotide diversity by extrapo-lating the regression equation in Fig. 2a throughout the entire range of the BMWS Table 1 Average contributions of
climatic variables to the Maxent model of habitat suitability for the Blue Mountains Water Skink un-der current climatic conditions; over 90 % of the variation in these models was attributable to annual temperature variation (i.e., isother-mality) and precipitation
Variable name
Variable description Percent contribution
bio 3 Isothermality 29.5
bio 18 Precipitation of the warmest quarter 26.1 bio 16 Precipitation of the wettest quarter 9.1 bio 13 Precipitation of the wettest month 8.5 bio 8 Mean temperature of the wettest quarter 7.9 bio 15 Precipitation seasonality 6.2 bio 17 Precipitation of the driest quarter 3.6 bio 1 Annual mean temperature 3.2 bio 6 Minimum temperature of the coldest month 1.5 bio 2 Mean diurnal temperature range 1.3 bio 5 Maximum temperature of the warmest month 1.3
(Fig. 4). Thus, even after averaging all climate scenarios (i.e., both low and high) the populations that currently contain the highest levels of nucleotide diversity are pre-dicted to be impacted the most (Fig. 4).
3.2 Microsatellite markers
We found no significant relationship between the allelic richness of the populations and their current maxent scores (linear regression, n013 populations, F1,1201.49, R200.12, P00.25). Nevertheless, the same trend was present (i.e. increase of maxent scores with an increase of the genetic diversity). Differences between the mitochondrial and the microsatellite markers are likely linked to differences in mutation rates and to their mode of inheritance (maternally versus bi-parentally). Mitochondrial markers evolve more slowly, and thus are influenced by the long-term history of the population (over evolutionary time) than are microsatellite markers (which reflect short term influences, over the few preceding generations; see e.g. Brown et al. 2005; Bruyndonckx et al. 2010; Dubey and Shine2010a,b; Ferchaud et al.2011).
Fig. 2 Relationships between current levels of habitat suitability (i.e., Maxent scores) for the Blue Mountains Water Skink and a nucleotide diversity of lizards from 13 populations, and b climate change scenarios for 2020 and 2050 (low and high emission scenarios in blue and red respectively). See text for descriptions of climate scenarios
4 Discussion
The Blue Mountains Water Skink is endangered because of its restricted distribution, its dependence on a specialized and highly fragmented habitat type, and its low rate of dispersal between habitat patches within this increasingly degraded habitat (Dubey and Shine2010a,b). Our current analysis suggests an additional threat to the long-term viability of this taxon: not only will habitat suitability decline overall as a consequence of climate change, but the sites that currently contain most of the species’ genetic variation will be the areas that are affected most severely.
The strong spatial correlation between habitat suitability (as quantified by Maxent) and genetic diversity likely reflects a tendency for sites with specific conditions of temperature and moisture to have remained suitable for the taxon (and hence, to have supported relatively large lizard populations) over evolutionary time. Populations in areas with less favourable suites of hydric and thermal regimes may have been extirpated and recolonised, or reduced
Fig. 3 Relationship between the predicted change in Maxent habitat suitability score for the Blue Mountains Water Skink (future value minus current value) and nucleotide diversity of lizard populations, shown for low (blue) and high (red) climate scenarios in 2020 and 2050. See text for descriptions of climate scenarios. Areas that currently contain the most genetically diverse lizard populations are likely to be the ones most severely affected by climate change
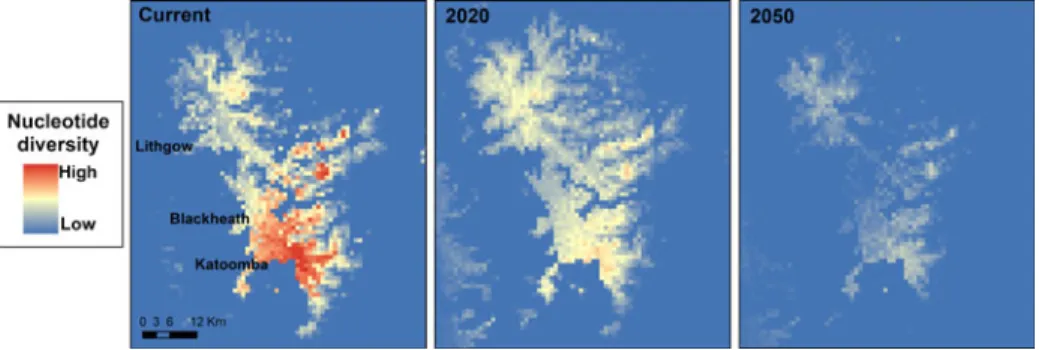
Fig. 4 Predicted nucleotide diversity throughout the entire range of the Blue Mountains Water Skink under current climatic conditions, and averaged across all low and high emissions scenarios for 2020 and 2050. Predicted diversity was calculated using the regression equation between Maxent scores and nucleotide diversity under current climatic conditions, as shown in Fig.1
to low numbers (and thus, low genetic diversity) by intermittently unfavourable conditions of drought, fire, or other factors. Thus, much of the species’ entire genetic variation is restricted to high-precipitation sites with suitable temperatures (Fig.4).
Unfortunately, our analyses of habitat suitability suggest that although these high-diversity sites have provided stable refuges over very long periods (Dubey and Shine2010a), they are unlikely to remain highly suitable for the species in the decades to come. Predicted patterns of climate change suggest that the Blue Mountains Water Skink will come under severe and spatially-variable threat, and the populations with currently high genetic diversity will have a greater reduction in habitat suitability score (Fig.3). The impact of any such habitat degradation will be amplified by direct effects of climate change on the hydric dynamics of these montane swamps (i.e., changes to critical habitat features may be more extreme than predicted by Maxent, because these swamps depend upon specific rates of runoff: Young and Wray2000) and by the very limited ability of the lizards to move between swamps (Dubey and Shine2010a,b).
Sadly, the situation in Blue Mountains Water Skinks may well apply to many other endemic montane taxa in this area, because the Greater Blue Mountains World Heritage area is one of the three most diverse areas for scleromorphic plant species worldwide. It is a centre of plant endemism, with at least 1,500 species, including 10 % of Australian vascular plants (the highest diversity of any of temperate zone; UNEP–WCMC 2007), including iconic species such as the Wollemi pine (a ‘living fossil’: Jones et al.1995; Hill1996). Consequently, climate change could have a devastating impact on this biodiversity hotspot. The fauna and flora of many montane areas worldwide may face similar threats, with habitat fragmentation (either natural or anthropogenic) rendering them unable to migrate to new areas of suitable climatic conditions. For example, many endemic montane amphibians and reptiles in the anthropogenically-fragmented forests of Madagascar are unlikely to survive imminent global warming, because they will be unable to disperse to climatically suitable areas (Raxworthy et al. 2008). In North America, montane small mammals (e.g., the Pika Ochotona princeps) are rapidly disappearing because of their obligate association with discontinuously distributed habitat (and hence, their inability to move to new patches: Beever et al.2003).
It may often be the case that specific high-elevation sites have offered refuges over evolutionary time, and hence retain a disproportionate share of a species’ genetic variation. Many global-warming scenarios suggest that such mountain-top sites will be at high risk, because the unique abiotic conditions they provide will disappear from the landscape as conditions typical of low-elevation sites move up towards the mountain-tops (e.g. Theurillat and Guisan2001; Dirnbock et al.2003). Our analyses suggest that the threat posed by this fragility of upper montane areas to endangered taxa may be exacerbated by spatial patterns of current genetic diversity within those taxa. The most important populations (from the perspec-tive of long-term species viability) may be the first to go.
Acknowledgements We thank Michael Hensen and the Blue Mountains City Council for their enthusiastic support for our work, Maya Chevalley for her assistance in the field, and the Australian Research Council and the Swiss National Science Foundation for funding.
References
Araujo MB, Pearson RG (2005) Equilibrium of species’ distributions with climate. Ecography 28:693–695 Araujo MB, Thuiller W, Pearson RG (2006) Climate warming and the decline of amphibians and reptiles in
Beever EA, Brussard PE, Berger J (2003) Patterns of apparent extirpation among isolated populations of pikas (Ochotona princeps) in the Great Basin. J Mammal 84:37–54
Brown KM, Baltazar GA, Hamilton MB (2005) Reconciling nuclear microsatellite and mitochondrial marker estimates of population structure: breeding population structure of Chesapeake Bay striped bass (Morone saxatilis). Heredity 94:606–615
Bruyndonckx N, Biollaz F, Dubey S, Goudet J, Christe P (2010) Mites as biological tags of their hosts. Mol Ecol 19:2770–2778
Intergovernmental Panel on Climate Change (2001) Third Assessment Report. Climate Change 2001: The Scientific Basis
Dirnbock T, Dullinger S, Grabherr G (2003) A regional impact assessment of climate and land-use change on alpine vegetation. J Biogeogr 30:401–417
Dubey S, Shine R (2010a) Pleistocene diversification and genetic population structure of an endangered lizard (the Blue Mountains water skink, Eulamprus leuraensis) in southeastern Australia. J Biogeogr 37:902–914 Dubey S, Shine R (2010b) Restricted dispersal and genetic diversity in populations of an endangered montane
lizard (Eulamprus leuraensis, Scincidae). Mol Ecol 19:886–897
Dubey S, Shine R (2011) Predicting the effects of climate change on an endangered montane lizard, Eulamprus leuraensis (Scincidae). Clim Chang 107:531–547
Dubey S, Chevalley M, Shine R (2010) Sexual dimorphism and sexual selection in a montane scincid lizard (Eulamprus leuraensis). Aust Ecol 36:68–75
Elith JC, Graham CH, the NCEAS Species Distribution Modelling Group (2006) Novel methods improve prediction of species’ distributions from occurrence data. Ecography 29:129–151
Ferchaud A-L, Lyet A, Cheylan M, Arnal V, Baron J-P, Montgelard C, Ursenbacher S (2011) High genetic differentiation among french populations of the Orsini’s viper (Vipera ursinii ursinii) based on mitochon-drial and microsatellite data: Implications for conservation management. J Hered 102:79–87
Finger A, Schmitt T, Zachos FE, Meyer M, Assmann T, Habel JC (2009) The genetic status of the violet copper Lycaena helle -a relict of the cold past in times of global warming. Ecography 32:382–390 Hernandez PA, Graham CH, Master LL, Albert DL (2006) The effect of sample size and species characteristics on
performance of different species distribution modeling methods. Ecography 29:773–785
Hijmans RJ, Cameron SE, Parra JL, Jones PG, Jarvis A (2005) Very high resolution interpolated climate surfaces for global land areas. Int J Climatol 25:1965–1978
Hill KD (1996) The Wollemi pine: discovering a living fossil. Nat Resour 32:20–25
Jones WG, Hill KD, Allen JM (1995) Wollemia nobilis, a new living Australian genus and species in the Araucariaceae. Telopea 6:173–176
Mitrovski P, Henze DA, Broome L, Hoffmann AA, Weeks AR (2007) High levels of variation despite genetic fragmentation in populations of the endangered mountain pygmy-possum, Burramys parvus, in alpine Australia. Mol Ecol 16:75–87
Phillips SJ, Dudík M (2008) Modeling of species distributions with Maxent: new extensions and a compre-hensive evaluation. Ecography 31:161–175
Phillips SJ, Anderson RP, Schapire RE (2006) Maximum entropy modeling of species geographic distribu-tions. Ecol Model 190:231–259
Phillips SJ, Dudik M, Elith J, Graham CH, Lehmann A, Leathwick J, Ferrier S (2009) Sample selection bias and presence-only distribution models: implications for background and pseudo-absence data. Ecol Appl 19:181–197 Raxworthy CJ, Pearson RG, Rabibisoa N, Rakotondrazafy AM, Ramanamanjato JB, Raselimanana AP, Wu S, Nussbaum RA, Stone DA (2008) Extinction vulnerability of tropical montane endemism from warming and upslope displacement: a preliminary appraisal for the highest massif in Madagascar. Glob Chang Biol 14:1703–1720
SAS Institute Inc (2007) JMP. Version 7.0. SAS Institute, Cary
Smith MA, Green DM (2005) Are all amphibian populations metapopulations? Dispersal and the metapopu-lation paradigm in amphibian ecology and conservation. Ecography 28:110–128
Theurillat JP, Guisan A (2001) Potential impact of climate change on vegetation in the European Alps: a review. Clim Chang 50:77–109
UNEP–WCMC (2007) Greater Blue Mountains Area, Australia. Encyclopedia of Earth (ed Cleveland CJ). United Nations Environment Programme (UNEP)–World Conservation Monitoring Centre (WCMC). Environmental Information Coalition, National Council for Science and the Environment, Washington, DC. Available at:http://www.eoearth.org/article/Greater_Blue_Mountains_Area_Australia
VanDerWal J, Shoo LP, Johnson CN, Williams SE (2009) Abundance and the environmental niche: environ-mental suitability estimated from niche models predicts the upper limit of local abundance. Am Nat 174:282–291
Young RW, Wray RAL (2000) The geomorphology of sandstones in the Sydney region. In: McNally GH, Franklin BJ (eds) Sandstone city - Sydney’s Dimension Stone and other Sandstone Geomaterials