ORIGINAL PAPER
Mineralisation and mechanical strength of the glenoid cavity
subchondral bone plate
Marko Kraljević&Valentin Zumstein&Dieter Wirz& Rolf Hügli&Magdalena Müller-Gerbl
Received: 7 June 2011 / Accepted: 11 June 2011 / Published online: 7 July 2011 # Springer-Verlag 2011
Abstract
Purpose Failures in total shoulder replacements are often due to aseptic loosening of the glenoid component; the subchondral bone plate is an important factor governing primary fixation of implant materials. Therefore, we investigated characteristic mineralisation patterns of the subchondral bone plate, which demonstrate long-term stress on articular surfaces, age-related changes, postsurgical biomechanical situations and regions of fixation. Using computed tomography osteo-absorptiometry (CT-OAM), these distribution patterns can be demonstrated in vivo. The aim of this study was to investigate the relationship between subchondral bone-plate mineralisation measured with CT-OAM and the mechanical strength measured by indentation.
Methods A total of 32 cadaverous glenoid cavities were evaluated by CT-OAM and indentation testing. Linear regression was used to compare mineralisation and strength of the subchondral bone plate.
Results Results showed two patterns of mineralisation distribution. Twenty-eight cavities were related to bicentric distribution pattern and four showed a single maximum. The correlation coefficient between CT-OAM density and subchondral bone-plate strength was determined to be between 0.62 and 0.96 (P<0.02).
Conclusions Long-term stress affects not only the subchon-dral but also the underlying cancellous bone. It therefore can be assumed that mineralisation patterns of the sub-chondral bone plate continue in cancellous bone. Areas of high density could serve as anchoring locations for orthopaedic implants in resurfacing the glenoid cavity.
Introduction
Subchondral bone quality is an important factor regarding total shoulder joint replacement outcome. Specific miner-alisation distribution patterns of the subchondral bone plate represent loading history of a joint [11]. Schulz et al. [18] showed that localisation of density maxima is usually bicentric in the glenoid cavity. However, the interrelation-ship between bone density and mechanical strength has not yet been satisfactorily investigated in the subchondral bone plate [10]. Using the noninvasive computed tomography osteo-absorptiometry (CT-OAM) to assess individual long-term stress in vivo, correlations between subchondral bone strength and radiological density could be established, thus providing information about mechanical quality [11].
Fixation of orthopaedic endoprostheses, mainly the glenoid part, is still a challenge in shoulder arthroplasty. The rate of complications is high. Joint instability and glenoid loosening are among the most common postoper-ative complications [19,22], which are caused by eccentric loading of the glenoid and a decentered humeral head [6,
M. Kraljević (*)
:
V. Zumstein:
M. Müller-Gerbl Anatomical Institute, University of Basel, Pestalozzistrasse 20,4056 Basel, Switzerland
e-mail: [email protected] D. Wirz
Laboratory of Biomechanics & Biocalorimetry, University of Basel,
Klingelbergstrasse 50–70, 4056 Basel, Switzerland R. Hügli
Institute of Radiology and Nuclear Medicine, Kantonsspital Bruderholz,
4101 Bruderholz, Switzerland DOI 10.1007/s00264-011-1308-5
25]. Preoperative detection of humeral-head decentring is clinically important, because a subluxation tendency exists preoperatively [6,7,24]. Cases identified early and repaired operatively improve postoperative outcomes [4,24]. Infor-mation about subchondral bone density might also be informative if resurfacing is necessary in order to allow optimal prosthesis fixation. The importance of subchondral bone for optimal screw positioning has been emphasised by several authors [8].
Characteristic mineralisation patterns of the subchondral bone plate reflect long-term stress on articular surfaces [11]. Some authors demonstrated that age [14] and geometry of the articular surface are important for subchondral bone mineral-isation [14, 21]. CT-OAM provides information regarding mineralisation distribution in the subchondral bone plate [11]. In contrast to the usual methods of CT densitometry, which permit calculation of absolute values for bone density over a large area, including compact and spongy bone, CT-OAM demonstrates differences in relative concentration within a joint surface [15]. If there are high correlations between these parameters, predictions concerning bone quality can be made with this method.
As far as we know, correlation between subchondral mineralisation and mechanical strength of the glenoid cavity has not been studied. Results from such study could help the development of new fixation methods in shoulder arthroplasty. We hypothesised that there is an interrelation between mineral density distribution patterns and strength of the same anatomical specimen. The aim of the study was to determine whether a correlation exists between bone density and mechanical strength of the glenoid cavity. We therefore compared CT-OAM results with those of indentation testing.
Material and methods Preparation
Twenty-one glenohumeral joints were obtained from the cadaver-dissecting course at the University of Basel. Patient age distribution was 59–95 years (eight male, 12 female, one unknown gender) with an average age of 80.5 years (Table1). Additionally, we included 11 specimens from the Anatomical Institute of Ludwig Maximilian University in Munich. Gender and age of these specimens were unknown. Glenohumeral joints with signs of degeneration or traumatic findings were excluded from our study. Computed tomography osteo-absorptiometry
To demonstrate mineralisation, CT data sets were recorded in a GE Lightspeed 16 X-ray CT scanner (General Electric
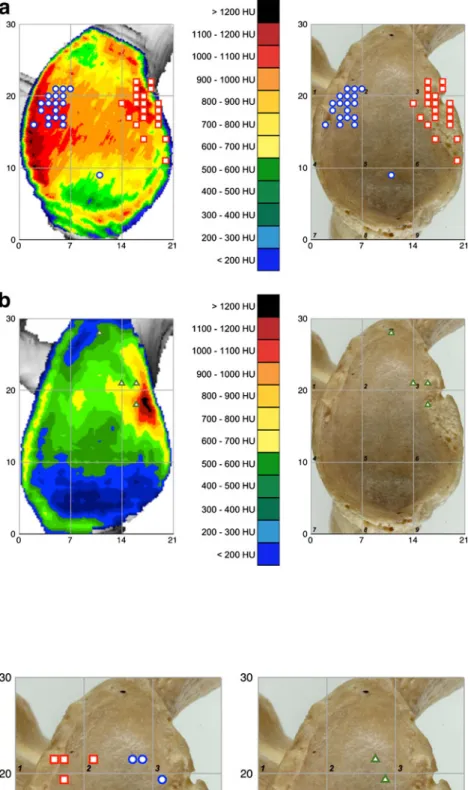
Healthcare Corporation,Waukesha, WI, USA) [11–13]. Axial section thickness was set to 0.6 mm, and data were evaluated using the image analysing system ANALYZE 7.5.5. (Biomedical Imaging Resource, Mayo Foundation, Rochester, MN, USA) to visualise mineralisation distribu-tion. First, a 3D reconstruction of the cavity was calculated so that a frontal view on the joint surface was achieved. Then, the subchondral bone plate was segmented in each slice and reconstructed in 3D using maximum intensity projection (MIP). To illustrate density distribution, grey values of the subchondral bone plate were converted to false colours (Fig.1a). Overlaying the cavity with the false colour figure resulted in a topographical view of mineral-isation patterns. To quantify distribution patterns, a 21×30 U grid was projected onto the densitogram of each cavity. The grid was positioned in tangential contact so that its borders matched the borders of the glenoid face. The number of units was maintained to standardise coordinates for larger and smaller glenoid cavities. Coordinates of each mineralisation maximum were noted in order to generate a summary chart.
Indentation testing
The position of the glenoid cavity is important for reproduc-ible indentation testing. The glenoid cavities were measured and divided into a standardised grid. There were 16 measuring points tagged on each cavity, and the interval between points was 7–10 mm (Fig. 1b). The cavity was cemented into a small plastic box with polymethyl-methacrylate and rotated so that the needle bored through the articular surface perpendicular to the surface. A mechanical test machine (Synergie 100, MTS Systems, Eden Prairie, MN, USA) was used for all indentation measurements. The steel needle indented a standardised hole 7 mm deep and a surface diameter 1.3 mm. The vertical speed of the needle was set to 1 mm/s. According to Aitken et al. [1] and Saitoh et al. [17], we recorded the maximum force (in Newton) required. These values were registered into a standardised grid system.
Density-strength correlation
To compare density with strength, we determined density values for each corresponding stiffness measurement point using the image analysing system. The grid and the surface measured (5.47 mm2) were the same as for indentation testing. Statistical analysis
Measured data were examined by linear regression for statistical evaluation. The Pearson product-moment corre-lation coefficient and determination coefficient were
estab-lished for all measured specimens. Using the t test, we proved that a significant correlation between manifestations of the sample characteristics exists (n=16).
Results
Patterns of density distribution
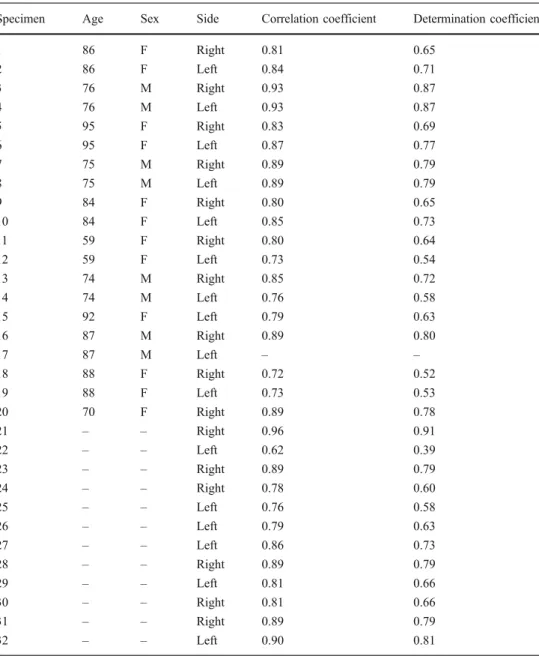
CT data sets revealed that mineralisation of the subchondral bone plate is not homogeneous. This means that there are surfaces with lower and higher density values. We found two dissimilar mineralisation patterns: 28 cavities could be attributed to a bicentric distribution pattern; only four cavities showed a monocentric maximum (Fig. 2a). The most frequent maximum values of bicentric distribution were detected in squares 4 and 6, anterior and posterior, respectively. Monocentric cavity maximum is shown in squares 3 and 6, anterior (Fig.2b). Density maxima showed an interindividual range between 680 and 1,010 HU. We found no statistically significant difference in the average
age between bicentric and monocentric glenoid cavities. Mean age of the bicentric glenoid cavities was from 79-year-old specimens; the monocentric glenoid cavities were from specimens 87 years old on average.
Strength distribution
Similar to density distribution, strength was not homoge-nous. Again, strength maxima were located frequently at anterior and posterior (bicentric) areas of the articular surface and only rarely at the anterior part. Bicentric strength maxima were concentrated in squares 4 and 6 and monocentric in squares 5 and 6 (Fig.3). We recorded interindividual differences between absolute density values and measured peak forces between 50 N and 1,079 N necessary to indent a hole of 7 mm.
Density-strength correlation
A graphic view of mineralisation and strength distribution demonstrated a similar aspect in all specimens (Fig.4). By
Fig. 1 a Density distribution of the subchondral bone plate was analysed by maximum intensity projection and visualised with false colours. Black typified density values >1,200 HU, fol-lowed in descending order by red, orange, yellow, green and blue <200 HU. b The subchon-dral bone plate was indented 16 times using a 1.3 mm diameter steel needle
Fig. 2 a Twenty-eight glenoid cavities showed a bicentric den-sity distribution. Blue circles represent posterior and red squares anterior peak values; left glenoids are mirrored. b Only four glenoid cavities showed a monocentric density distribution; triangles represent peak values
Fig. 3 Twenty-eight glenoid cavities showed a bicentric (left image) strength distribution; on-ly four glenoid cavities showed a monocentric (right image) strength distribution
comparing density and strength values, we established a linear dependence. The correlation coefficient was between 0.62 and 0.96 (Table1). The determination coefficient ( R2)
was between 0.39 and 0.91. For a confidence interval (CI) of 98%, the information was statistically significant (Fig. 5).
Fig. 4 Distribution of mineral density (left image) and distri-bution of strength (right image) of the glenoid cavity
Specimen Age Sex Side Correlation coefficient Determination coefficient
1 86 F Right 0.81 0.65 2 86 F Left 0.84 0.71 3 76 M Right 0.93 0.87 4 76 M Left 0.93 0.87 5 95 F Right 0.83 0.69 6 95 F Left 0.87 0.77 7 75 M Right 0.89 0.79 8 75 M Left 0.89 0.79 9 84 F Right 0.80 0.65 10 84 F Left 0.85 0.73 11 59 F Right 0.80 0.64 12 59 F Left 0.73 0.54 13 74 M Right 0.85 0.72 14 74 M Left 0.76 0.58 15 92 F Left 0.79 0.63 16 87 M Right 0.89 0.80 17 87 M Left – – 18 88 F Right 0.72 0.52 19 88 F Left 0.73 0.53 20 70 F Right 0.89 0.78 21 – – Right 0.96 0.91 22 – – Left 0.62 0.39 23 – – Right 0.89 0.79 24 – – Right 0.78 0.60 25 – – Left 0.76 0.58 26 – – Left 0.79 0.63 27 – – Left 0.86 0.73 28 – – Right 0.89 0.79 29 – – Left 0.81 0.66 30 – – Right 0.81 0.66 31 – – Right 0.89 0.79 32 – – Left 0.90 0.81
Table 1 Clinical and statistical data of all specimens
Discussion
As initially mentioned, joint instability and glenoid loosening are among the most common postoperative complications, often caused by eccentric loading of the glenoid due to a malcentred humeral head [19, 22]. This emphasises the importance of preoperative identification of such cases to allow these problems to be corrected intraoperatively and thus prevent postoperative complications. The subchondral bone plate is also an important factor governing orthopaedic endoprostheses implantation. It is therefore of utmost importance to set the endoprosthesis at areas of high strength. Some authors report the effect of bone quality on shoulder arthroplasty outcomes and note that poor bone quality is an important factor in glenoid loosening [16]. Ding et al. [5] showed by micro-CT that decreased mechanical properties of subchondral cancellous bone in osteoarthritis indicate poor bone quality. Quantification of subchondral bone-plate mineralisation based on conventional CT data, which may be used as a marker for long-term stress distribution [3,11], could help in preoperative identification. CT-OAM is a reproducible and highly sensitive method for determining subchondral bone mineralisation [11, 12]. In contrast to the usual methods of CT densitometry, which deal with the calculation of an absolute value for bone density, CT-OAM demonstrates differences in relative concentration within a joint surface [11].
As we used formalin-fixed cadaveric specimens, it is important to determine whether fixing in formalin affects mineralisation and strength. Previous studies noted that formalin-fixed specimens showed no statistically significant differences in strength and bone mineral density compared to fresh specimens [2, 23]. Our examinations of the subchondral articular surfaces showed that regional differ-ences in distribution of density and strength in each specimen, including the position of maxima and the extension of density areas, do exist. Individual diversity
of exposure at work, sports or daily routine have an influence on long-term stress in the human shoulder. This stress factor is expressed in densitogram mineralisation patterns [15].
Density distribution within the glenoid cavity was nonho-mogeneous, as expected. Based on physiological incongruity of the joint partners, mineralisation distribution and strength demonstrate that load is not divided equally across the cavity [21]. Despite the nonhomogeneity, we detected a distribution regularity. Our summary charts, calculated from maximum density and strength values, demonstrate this. Analyses of density maxima most frequently revealed a bicentric distribution, with opposing maxima located close to the anterior and posterior glenoid rim due to the physiological mismatch in the human shoulder joint. Physiological incongruity of the shoulder joint is a principle to prevent osteoarthritis [1,11,18]. Soslowsky et al. [20] described the importance of the articular cartilage for glenohumeral congruity. Consecutive swelling of the articular cartilage after periods of high loading increases incongruity and stimulates the cartilage to remain healthy. Furthermore, the humeral head shows tendencies towards a bigger ball radius than the respective socket, which emphasises this concept of physiological mismatch [20]. Only in four of 32 cavities did we find a monocentric distribution pattern. These results can be explained by a loss of incongruity with increasing age [14]. Preponderance of several muscles of the rotator cuff during internal rotation could also explain the less frequent patterns of distribution [18]. In these situations, the humeral head is ventrally decentred and the posterior contact area no longer exists. The glenoid contact area shifts towards the central and anterior parts of the articular surface, which leads to anterior maxima in mineralisation distribution. Stress on the articular surfaces caused by load distribution was evidently highest in these areas [13,15].
Examinations of strength values are in accordance with the results of the density values. This means that bicentric patterns with anterior and posterior maxima and mono-centric patterns with anterior maxima could also be detected in strength summary charts. The force needed to penetrate zones of high density was significantly higher than in zones with low density. Our observations showed that long-term stress on the glenoid cavity is responsible for the nonhomogeneous mineralisation distribution in the sub-chondral bone plate and an increase of density in these areas. Statistical evaluation demonstrated that areas of high-density values in the densitograms correspond to values measured during indentation testing. Low-density values relate to low strength values, as well. We believe that long-term stress leads not only to characteristic subchondral mineralisation patterns but also to an increased amount of absolute density in these areas. Our results reveal that CT-OAM can provide information regarding subchondral bone
Fig. 5 Correlation between strength and density on one glenoid cavity
strength, an important factor in the implantation of orthopaedic prostheses. Therefore, the best mechanical quality for implant is obtained in the anterior and posterior areas close to the glenoid rim.
Conclusions
Mineralisation distribution and bone density in the subchondral bone plate provides information regarding long-term stress in diarthrodial joints [12]. We demonstrated that density and strength within the articular surface of the glenoid cavity correlate statistically significantly (P<0.02). As long-term stress affects not only the subchondral bone but also the subarticular cancellous bone [9], we assume that subchondral bone-plate mineralisation patterns continue in cancellous bone. From a clinical point of view, knowing details about the subchondral bone plate might be interesting regarding implantation of more durable and adjustable orthopaedic endoprostheses in resurfacing. Several authors emphasise the importance of subchondral bone for optimal screw positioning [8]. Therefore, areas of high density could serve to influence the development of new fixation methods in shoulder arthroplasty.
References
1. Aitken GK, Bourne RB, Finlay JB, Rorabeck CH, Andreae PR (1985) Indentation stiffness of the cancellous bone in the distal human tibia. Clin Orthop Relat Res 201:264–270
2. Burkhart KJ, Nowak TE, Blum J, Kuhn S, Welker M, Sternstein W, Mueller LP, Rommens PM (2010) Influence of formalin fixation on the biomechanical properties of human diaphyseal bone. Biomed Tech 55(6):361–365. doi:10.1515/BMT.2010.043
3. Carter DR, Fyhrie DP, Whalen RT (1987) Trabecular bone density and loading history: regulation of connective tissue biology by mechanical energy. J Biomech 20(8):785–794. doi: 10.1016/0021-9290(87)90058-3
4. Collins D, Tencer A, Sidles J, Matsen F 3rd (1992) Edge displacement and deformation of glenoid components in response to eccentric loading. The effect of preparation of the glenoid bone. J Bone Joint Surg Am 74(4):501–507
5. Ding M, Odgaard A, Hvid I (2003) Changes in the three-dimensional microstructure of human tibial cancellous bone in early osteoarthritis. J Bone Joint Surg Br 85(6):906–912 6. Franklin JL, Barrett WP, Jackins SE, Matsen FA 3rd (1988) Glenoid
loosening in total shoulder arthroplasty. Association with rotator cuff deficiency. J Arthroplasty 3(1):39–46. doi:10.1016/S0883-5403(88) 80051-2
7. Friedman RJ (1995) Biomechanics of total shoulder arthroplasty: a preoperative and postoperative analysis. Semin Arthroplasty 6(4):222– 232
8. Gordon KD, Duck TR, King GJ, Johnson JA (2003) Mechanical properties of subchondral cancellous bone of the radial head. J Orthop Trauma 17(4):285–289
9. Lim D, Seliktar R, Farrell E, Tom J, Nunes L, Sun W, Wee J (2004) Loading conditions and bone formation in the GH region of the shoulder. Conf Proc IEEE Eng Med Biol Soc 7:5092–5095. doi:10.1109/IEMBS.2004.1404407
10. Muhlhofer H, Ercan Y, Drews S, Matsuura M, Meissner J, Linsenmaier U, Putz R, Muller-Gerbl M (2009) Mineralisation and mechanical strength of the subchondral bone plate of the inferior tibial facies. Surg Radiol Anat 31(4):237–243. doi:10.1007/s00276-008-0430-6
11. Muller-Gerbl M (1998) The subchondral bone plate. Adv Anat Embryol Cell Biol 141(III-XI)
12. Muller-Gerbl M, Putz R, Hodapp N, Schulte E, Wimmer B (1989) Computed tomography-osteoabsorptiometry for assessing the density distribution of subchondral bone as a measure of long-term mechanical adaptation in individual joints. Skeletal Radiol 18(7):507–512. doi:10.1007/BF00351749
13. Muller-Gerbl M, Putz R, Kenn R (1992) Demonstration of subchondral bone density patterns by three-dimensional CT osteoabsorptiometry as a noninvasive method for in vivo assessment of individual long-term stresses in joints. J Bone Miner Res 7(Suppl 2):S411–418. doi:10.1002/jbmr.5650071409
14. Muller-Gerbl M, Putz R, Kenn R (1993) Distribution pattern of subchondral mineralization in the glenoid cavity in normal subjects, athletes and patients. Z Orthop Ihre Grenzgeb 131 (1):10–13. doi:10.1055/s-2008-1039896
15. Muller-Gerbl M, Weisser S, Linsenmeier U (2008) The distribu-tion of mineral density in the cervical vertebral endplates. Eur Spine J 17(3):432–438. doi:10.1007/s00586-008-0601-5
16. Raiss P, Pape G, Kleinschmidt K, Jager S, Sowa B, Jakubowitz E, Loew M, Bruckner T, Rickert M (2010) Bone cement penetration pattern and primary stability testing in keeled and pegged glenoid components. J Shoulder Elbow Surg. doi:10.1016/j.jse.2010.09.006
17. Saitoh S, Nakaksuchi Y, Latta L, Milne E (1994) Distribution of bone mineral density and bone strength of the proximal humerus. J Shoulder Elbow Surg 3:234–242. doi:10.1016/S1058-2746(09) 80041-4
18. Schulz CU, Pfahler M, Anetzberger HM, Becker CR, Muller-Gerbl M, Refior HJ (2002) The mineralization patterns at the subchondral bone plate of the glenoid cavity in healthy shoulders. J Shoulder Elbow Surg 11(2):174–181. doi:10.1067/mse.2002.121635
19. Skirving AP (1999) Total shoulder arthroplasty– current problems and possible solutions. J Orthop Sci 4(1):42–53. doi:10.1007/ s007760050073
20. Soslowsky LJ, Flatow EL, Bigliani LU, Mow VC (1992) Articular geometry of the glenohumeral joint. Clin Orthop Relat Res 285:181–190
21. Tillmann B (1971) The stress of the human elbow joint. I. Functional morphology of the articular surfaces. Z Anat Entwicklungsgesch 134(3):328–342. doi:10.1007/BF00519919
22. Torchia ME, Cofield RH, Settergren CR (1997) Total shoulder arthroplasty with the Neer prosthesis: long-term results. J Shoulder Elbow Surg 6(6):495–505. doi:10.1016/S1058-2746 (97)90081-1
23. van Haaren EH, van der Zwaard BC, van der Veen AJ, Heyligers IC, Wuisman PI, Smit TH (2008) Effect of long-term preservation on the mechanical properties of cortical bone in goats. Acta Orthop 79(5):708–716. doi:10.1080/17453670810016759
24. Walch G, Badet R, Boulahia A, Khoury A (1999) Morphologic study of the glenoid in primary glenohumeral osteoarthritis. J Arthroplasty 14(6):756–760. doi:10.1016/S0883-5403(99)90232-2
25. Walch G, Boulahia A, Boileau P, Kempf JF (1998) Primary glenohumeral osteoarthritis: clinical and radiographic classifi-cation. The Aequalis Group. Acta Orthop Belg 64(Suppl 2):46– 52