Co-inoculated
Plasmopara viticola genotypes compete
for the infection of the host independently
from the aggressiveness components
Benedetta Roatti&Cesare Gessler&Michele Perazzolli&Ilaria Pertot
Accepted: 7 January 2013 / Published online: 27 January 2013 # KNPV 2013
Abstract During Plasmopara viticola epidemics only few genotypes produce most of the secondary lesions and dominate in the population. Selection of dominant genotypes is hypothesized to be linked to environmental conditions and can occur rapidly, particularly if there is also difference between genotypes in terms of fitness and aggressiveness. Measurements of aggressiveness components can largely determine the rate of epidemic development, although the components of aggressive-ness do not take into account potential direct competi-tion between genotypes. Differences in aggressiveness have been also reported to be greater under non-optimal conditions suggesting for genotype adapta-tion to different condiadapta-tions. To evaluate differences in latency at non-optimal conditions, we character-ized genotypes deriving from different climatic regions at three different temperatures (15, 25 and 35 °C) and we found no differences. To investigate whether other factors may impact on competition between P. viticola genotypes, we evaluated polycy-clic infections of P. viticola by co-inoculating three
genotypes with similar aggressiveness components in two different co-inoculation experiments and an increas-ing prevalence of one of the two genotypes was observed. Competition was not related to the origin of the genotype and we hypothesize that competitive selection is modulated by differences in the secretion of effector molecules which can contribute to the estab-lishment of dominant genotypes over an epidemic season.
Keywords Fitness index . Competitive SSR amplification . Effectors . Plasmopara viticola
Introduction
Downy mildew is one of the most damaging fungal diseases of grapevine (Vitis vinifera) worldwide. The causal agent, Plasmopara viticola (Berck. and Curt.) Berl. and de Toni, is a heterothallic (Wong et al.2001) diploid oomycete and obligate biotrophic parasite na-tive to North America. The pathogen overwinters as sexually-produced oospores in fallen leaves and the disease cycle starts when the oospores germinate pro-ducing sporangia and zoospores, which cause the pri-mary infections (Gessler et al.2011). All green parts of the plants which have active stomata can be attacked, and symptoms are easily recognized as yel-lowish lesions on leaves, known as“oilspots”. When conditions are favourable, sporangia containing asexually-produced zoospores are released from the
B. Roatti
:
M. Perazzolli:
I. PertotDepartment of Sustainable Agro-ecosystems and
Bioresources, Research and Innovation Centre, Fondazione Edmund Mach (FEM), Via E. Mach 1,
San Michele all’Adige 38010, Italy B. Roatti
:
C. Gessler (*)Institute of Integrative Biology, ETH, Zürich 8092, Switzerland
primary lesion and asexual secondary infection cycles occur throughout the growing season alongside prima-ry infections (Gessler et al.2011).
Population genetic studies with microsatellite markers (SSR) have focused specifically on character-izing population structures in the field on large and fine spatial scales. These studies have shown that P. viticola has high evolutionary potential due to large population sizes, high genotypic diversity, moderate migration ability of asexual propagules, a mixed re-productive system and random mating (Gobbin et al.
2006). Primary oosporic infections have been shown to contribute in highly varying degrees to an epidemic throughout the season, and despite producing large amounts of sporangia (Reuveni2003), only a few of these genotypes have been found to produce second-ary lesions and to predominate in summer populations of the pathogen (Rumbou and Gessler2004; Gobbin et al. 2005; Gobbin et al. 2006; Rumbou and Gessler
2006; Gobbin et al.2007). The main reason the ma-jority of genotypes fail to reproduce further after pri-mary infection has been hypothesized as being linked to variable sensitivity to environmental conditions (Gobbin et al.2005). Moreover, selection of dominant genotypes within populations can occur rapidly, par-ticularly if there is a considerable difference between genotypes in terms of their fitness (Young et al.2009), defined as the ability of a phenotype to contribute to the next generation (Antonovics and Alexander1989). In the interaction between plant and pathogen geno-types, single generation measurements, such as infec-tion efficacy, latent period, spore producinfec-tion rate, infectious period and lesion size are commonly used as“quantitative traits related to pathogenicity” which determine the aggressiveness of single isolates (Pariaud et al.2009). Many studies have documented differences in aggressiveness among isolates belong-ing to the same pathotype (Pariaud et al.2009) and, in experiments of co-inoculation of different P. viticola isolates, changes in their frequency may be largely dependent on differences in the aggressiveness com-ponents measured for the single isolates (Corio-Costet et al. 2011). However, while the aggressiveness of individuals may affect the competition between them and could explain the selection of dominant genotypes in field, it is also possible that direct competition or other mechanisms between genotypes also plays a role (Young et al.2009). Among pathogen isolates, differ-ences in aggressiveness have also been reported to be
greater under non-optimal conditions (Pariaud et al.
2009), suggesting that differential responses in terms of aggressiveness may exist between genotypes originating from different climatic regions where genotypes may have been adapted to growing at different conditions.
To study differences in growth among P. viticola isolates under non-optimal conditions and to evaluate whether factors other than aggressiveness components could be responsible for genotype selection, we eval-uated: i) differences in latency in P. viticola genotypes deriving from different climatic regions at non-optimal conditions; and ii) polycyclic infections of P. viticola in a competitive environment by co-inoculating geno-types with similar aggressiveness components, measured considering the latent period, infection frequency and spore production of pathogen’s life cycle (Corio-Costet et al. 2011). Competition be-tween the genotypes was assessed using a method based on a microsatellite marker developed for P. viticola (Gobbin et al. 2003; Delmotte et al. 2006). Moreover, the microsatellite-based quantification method (Naef et al. 2006; Reininger et al. 2011) was optimized for quick detection and quantifica-tion of P. viticola genotypes at different stages of the asexual infection cycle.
Materials and methods
Collection and propagation of Plasmopara viticola isolates
Entire leaves or fragments with single P. viticola lesions were collected. Each single lesion presumably represents a single P. viticola genotype (Gobbin et al.
2003). Vegetal material was placed separately, abaxial side up, on wet blotting paper in Petri dishes and incubated overnight in the dark at 25 °C to induce sporulation. Sporangia produced by the lesions were harvested separately in 4 ml of cold (4 °C) distilled water and the suspensions were used to inoculate Vitis vinifera cv. Pinot Noir cuttings (rootstock Kober 5BB) by spraying the abaxial leaf surface. Plants were incu-bated overnight in the dark for 12 h at 25 °C with 99– 100 % RH, and then maintained at 25 °C, 60±10 % RH. Once oilspot symptoms appeared, sporulation was induced by placing the plants in the dark over-night at 25 °C and 99–100 % RH (Perazzolli et al.
four consecutive infection cycles. Once infected leaves reached 80–100 % disease severity (i.e. per-centage of leaf area covered by sporulation), part of them were harvested, immediately frozen in liquid nitrogen and kept at−80 °C for DNA extraction, while the remaining leaves were kept at−20 °C for long term storage of the isolates (Laviola et al.2006).
Effect of temperature on latency in Plasmopara viticola genotypes from different regions
Six strains were randomly isolated from single leaf lesions originating from different climatic regions in 2009: two isolates were from northern Italy (Lat: 45.918378, Long: 11.071558), one from central Italy (Lat: 44.486326, Long: 11.333106) two from southern Italy (Lat: 41.136262, Long: 16.871567) and one from Israel (Lat: 31.741015, Long: 35.182514). Sporangia from each lesion were collected and propagated as de-scribed above. Leaves from the fourth to the sixth node starting from the apical meristem of 10 week old plants grown in greenhouse were detached so that all leaves were of similar age and size. Leaves were randomly placed abaxial side up on moistened filter paper in Petri dishes. Nine leaves per strain were inoculated with six droplets of 20 μl of 5×10⁴ sporangia ml−1 and incubated in greenhouse under the conditions described above. The day after inoculation, leaves were divided into three groups and incubated in the greenhouse under different temperature conditions: two groups were incu-bated at 15 °C and 25 °C, respectively, until sporulation, while the third group was incubated at 35 °C for 3 days, then at 25 °C until sporulation. Sporangia appearance was monitored daily through visual notation to estimate the latent period, defined as the time (days) from inoc-ulation to first sporinoc-ulation.
Microsatellite SSR analysis of Plasmopara viticola isolates
DNA was extracted from 100 mg of infected leaves or from 10 mg of freeze-dried inoculum suspensions using the DNeasy plant mini kit (Qiagen, Hilden, Germany). Samples were amplified using primers tar-geting the polymorphic P. viticola SSR loci ISAnew, BERnew (Gobbin et al. 2003; Matasci et al. 2010), Pv7, Pv13, Pv14, Pv17 (Delmotte et al.2006), where each forward primer was labeled with the fluorophore VIC (Applied Biosystems, Foster City, CA). PCR
reactions were carried out with a T-Professional Thermocycler (Biometra, Goettingen, GE) using the DreamTaq DNA Polymerase (Fermentas, St. Leon-Rot, Germany). PCR product was diluted 1:10 with sterile water, and 0.5μl was mixed with 9.2 μl of HiDi formamide and 0.2 μl of GeneScan 500 LIZ size standard (Applied Biosystems). Samples were dena-tured for 2 min at 94 °C and cooled on ice. Fragments were separated on an ABI PRISM 3130 sequencer (Applied Biosystems) following the manufacturer’s instructions, and analyzed using the Genemapper v 4.0 software (Applied Biosystems). PCR reactions and fragment analysis were performed in triplicate. Aggressiveness components and fitness index Three genotypes named BO, VOL 1 and VOL 2 were selected based on SSR profiles and analyzed for latent period, infection frequency and spore production us-ing the methods described by Corio-Costet et al. (2011). All experiments were carried out as described above however using leaf disks with diameter of 2 cm instead of whole leaves. Three replicates (plates) were used for each genotype. Each disk was inoculated with three droplets (15 μl) of 2.5×10³sporangia ml−1 on the abaxial side and incubated in greenhouse at 25 ° C. Sporangia appearance was monitored daily through visual notation to estimate the latent period (LP), defined as the time (days) from inoculation to first sporulation. Sporangia production was calculated 7 days after the inoculum as the total number of sporangia produced per plate (Nt) divided by the 562 deposited sporangia (Nt0) (Corio-Costet et al.2011). Sporulating spots of all leaf disks of each Petri dish were suspended in 20 μl of water and the number of sporangia per plate was determined using a haemocy-tometer. Infection frequency (IF) was calculated as the proportion of inoculated spots per plate (Corio-Costet et al. 2011) on which lesions had developed 7 days post-infection. The fitness index (FI) was calculated for each isolate using the formula described by Corio-Costet et al. (2011) FI = Ln (Nt/Nt0 × IF × 1/LP). Experiments were repeated twice independently. Co-inoculations with two different Plasmopara viticola genotypes
Fresh sporangia deriving from the three selected iso-lates were used to prepare inoculum suspensions. Two
co-inoculations experiments were performed combin-ing the different genotypes in two different couples (BO and VOL 1; VOL 1 and VOL 2). Leaves were washed in cold (4 °C) distilled water and sporangia concentration was adjusted to 105 sporangia ml−1. Inoculum suspensions were prepared by mixing the genotypes in varying proportions and used to inocu-late V. vinifera cv. Pinot Noir cuttings at the conditions previously described. In the first co-inoculation exper-iment (BO and VOL 1), genotype BO was inoculated at 10, 30, 50, 70 and 80 % of the total infection while in the second co-inoculation experiment (VOL 1 and VOL 2) genotype VOL 2 was inoculated at 30, 50 and 80 % of the total infection. Each inoculum suspension was sprayed onto three leaves of single plants and they were considered as repetitions in the experiment. Leaves were selected as previously described and ap-proximately 2 ml of inoculum suspension per leaf was sprayed. As controls, plants were inoculated separate-ly with genotypes alone. Residual inoculum suspen-sions of first inoculum solution (around 10 ml) were freeze-dried and used for DNA extraction as described above. Plants were maintained in greenhouse in the conditions previously described until all leaves showed symptoms. Infected leaves were then de-tached, individually transferred onto wet blotting pa-per in Petri dishes, and incubated overnight in the dark to induce sporulation. Disease severity was assessed in control plants as percentage of abaxial leaf area cov-ered by sporulation (Perazzolli et al.2011). Sporangia from each leaf were harvested separately in 4 ml of cold distilled water and each sporangia solution was uniquely used to inoculate one single leaf on a new plant. The leaves after washing off the sporangia were immediately frozen in liquid nitrogen and kept at −80 °C for DNA extraction. The infection procedure was repeated in order to cover three consecutive asex-ual infection cycles.
Competitive microsatellite PCR and analysis of fluorescence data
The quantification method based on competitive microsatellite PCR relies on co-amplification of microsatellites of different sizes (Naef et al. 2006; Reininger et al. 2011). Competitive PCR with the SSR marker Pv14 (Delmotte et al.2006) and fragment analysis was performed as described above on DNA mixtures of the genotypes BO (Pv14 allele size: 125)
and VOL 1 (Pv14 allele size: 121) and on DNA mixtures of the genotypes VOL 1 (Pv14 allele size: 121) and VOL 2 (Pv14 allele size: 125). Total fluo-rescence per sample was calculated as the sum of the heights of each peak. BO and VOL 2 normalized fluorescence was calculated as its peak height divided by total fluorescence. Normalized fluorescence values were plotted against the known quantities of genotype DNA and a linear regression analysis was performed on data points.
Statistical analysis
Data were analysed using the Statistica 9 software (StatSoft, Tulsa, OK). Data with normal distribution (K-S test, P>0.05) were validated for variance homoge-neity (Leven’s test, P>0.05) and the analysis of variance (ANOVA) was performed using Fisher’s test to detect significant differences between genotypes (P<0.05). In case data were not homogeneous according to K-S test (spore production and infection frequency data) data were transformed in LOG10and analysed as described above.
Results
Effect of temperature on latency in Plasmopara viticola genotypes from different regions
To evaluate differences in genotypes development we compared the latency of six strains deriving from four climatic regions at three different incubation temper-atures. Sporulation occurred in all strains incubated at 25 °C 5 days after inoculation, while those incubated at 15 °C and those kept at 35 °C displayed sporulation 7 days after inoculation, showing that growth rates at different temperatures were independent of the origin of the strains. No difference in latent period was ob-served among isolates.
Genotype selection and measurement of fitness index Of the P. viticola genotypes collected, three were selected for the following characteristics: different al-lele size at locus Pv14 for at least one genotype (VOL 1, Pv14 allele size 121; BO and VOL 2, Pv14 allele size 125) and homozygosis for this specific SSR mark-er. Given that they were collected in Bologna (Emilia
Romagna, Lat: 45.918378, Long: 11.071558) and Volano (Trentino region, Lat: 44.486326, Long: 11.333106) they were named BO, VOL 1 and VOL 2. Sporangia production and infection frequency were found to be similar in all three genotypes (Fig.1a and b), as was latent period (5 days after inoculation at 25 C°). The calculated fitness index (Fig.1c), which associates the spore production, infection frequency and latency period for all three genotypes, were ranging from mean values of 2.1 (VOL 2), 2.2 (BO) and 2.5 (VOL 1), however without being significantly different according to Fisher’s test (P>0.05).
Optimization of competitive microsatellite PCR for identification and quantification
of Plasmopara viticola genotypes
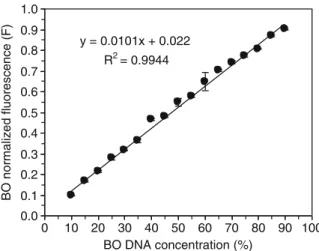
Amplification with the SSR Pv14 of the DNA of the two isolates BO (allele size 125) and VOL 1 (allele size 121) mixed in 1:1 ratio yielded two clearly distinct peaks with the same height (Fig. 2), showing that the two alleles were ampli-fied in PCR with the same efficiency. We mixed DNA extracts of BO and VOL 1 in differing proportions and found a significant linear correla-tion (R2= 0.9944; P < 0.001) between increasing BO concentration, corresponding to decreasing VOL 1 concentration, and the normalized fluorescence (Fig. 3). DNA extracts of VOL 1 (Pv14 allele size 121) and VOL 2 (Pv14 allele size 125) were also mixed in different proportions and for this allele couple we obtained similar results of significant correlation (R2= 0.9860; P < 0.001) between the in-creasing VOL 2 concentration and the corresponding normalized fluorescence (data not shown). The light emission peaks not only provide information on the presence or absence of specific alleles, but their fluorescence intensity is in proportion to the amount of DNA in the original sample. The good correlation found allowed us to use the competi-tive microsatellite PCR with the SSR marker Pv14 to quantify two genotypes in a co-inoculation ex-periment. The contribution of each P. viticola ge-notype to infection was expressed as the fluorescence of its allele as a proportion of the total sample fluorescence. 1 10 100 1000 10000 BO VOL 1 VOL 2 Spore production 0 0.2 0.4 0.6 0.8 1 1.2 BO VOL 1 VOL 2 Infection frequency 0 0.5 1 1.5 2 2.5 3 3.5 BO VOL 1 VOL 2 Fitness index
b
c
a
Fig. 1 Sporangia production (a), infection frequency (b) and fitness index (c) of Plasmopara viticola genotypes BO, VOL 1 and VOL 2. No differences were found between genotypes (Fisher’s test, P>0.05). Mean values and standard errors of three replications of one representative experiment are presented
Fig. 2 Electropherogram from ABI GeneMapper software il-lustrating peak sizes (base pairs) and height (fluorescence) of the SSR marker Pv14 on the 1:1 DNA mixture of Plasmopara viticola genotypes BO (size 125.67; height 4,740) and VOL 1 (size 121.67; height 4,760). Both genotypes are homozygous for the SSR marker Pv14
Co-inoculation dynamics of Plasmopara viticola genotypes
Competitive microsatellite PCR gave a precise estima-tion of the biomass of different P. viticola genotypes co-inoculated in the same plant tissue (Fig.4). BO and VOL 1 genotypes were co-inoculated in five different starting proportions (Fig.4a) and at each consecutive infection event (from inoculum to the third infection cycle) there was an increasing prevalence of genotype BO over genotype VOL 1. When the initial concen-tration of BO was greater than 50 %, it took two
consecutive infection events for BO to predominate over VOL 1. When the initial concentration of BO was 53 and 36 %, BO prevailed at the third infection cycle, while at an initial concentration of 11 %, BO gradually prevailed over VOL 1 until the last infection cycle, although not completely (89 %).
In a second co-inoculation experiment (Fig.4b), the VOL 1 was co-inoculated with a second isolate deriv-ing from the same vineyard (VOL 2), and an increased prevalence of the genotype VOL 2 over the genotype VOL 1 was obtained at three different starting propor-tions. In the first two cycles, where VOL 2 concentra-tion was 84 %, the initial proporconcentra-tions remained quite stable, however, at the third infection cycle, VOL 2 concentration reached a value higher than 98 %. When initial concentration was 53 % the VOL 2 concentra-tion remains stable until the first cycle, then in the following cycles its frequency gradually increases to the value of 98 %, being practically the only genotype present in the infection. When VOL 2 was present at 31 % in the starting inoculum, gradually its concen-tration increases reaching the value of 91 % at the third infection cycle. Also in this co-inoculation experiment VOL 1 tends to disappear after repetitive infection cycles, permitting to VOL 2 to prevail. Control plants were inoculated with pure BO, VOL 1 and VOL 2 genotypes, resulting in successful infection and pro-duction of sporangia at every infection event. Moreover, analysis of the inoculum suspensions and infected leaves confirmed the absence of cross-contamination between genotypes during the experi-ment (data not shown).
y = 0.0101x + 0.022 R2= 0.9944 0.0 0.1 0.2 0.3 0.4 0.5 0.6 0.7 0.8 0.9 1.0 0 10 20 30 40 50 60 70 80 90 100 BO DNA concentration (%) BO normalized fluorescence (F)
Fig. 3 Normalized fluorescence values and linear regression analysis for the SSR marker Pv14 of Plasmopara viticola DNA genotype BO (allele size 125) mixed with genotype VOL 1 (allele size 121) in proportions ranging from 10 to 90 % at intervals of 5 %. Mean values and standard error of three PCR replicates are reported
0 20 40 60 80 100
Inoculum Cycle 1 Cycle 2 Cycle 3
VOL 2 concentration (%) 0 20 40 60 80 100
Inoculum Cycle 1 Cycle 2 Cycle 3
BO concentration (%) a b c de f c d e f g de f h fg h
b
a b ef b bc e cd d ef fg ga
Fig. 4 Different proportions of Plasmopara viticola genotypes BO (a) and VOL 2 (b) expressed as percentages of total infections a: BO + VOL 1; b: VOL 1 + VOL 2) inoculated on grapevine leaves followed by three asexual infection cycles. Different start-ing proportions of the two genotypes were used in the two
infection experiments. At each infection cycle, sporangia were harvested separately from each infected leaf and used to inoculate new single leaves. Each point represents mean and standard error of three infected leaves of the same plant. Different letters indicate significant differences according to a Fisher’s test (P<0.05)
Discussion
In a given P. viticola population, particular genotypes dominate while others disappear and never produce secondary lesions (Gobbin et al.2005). This could be attributed to differences in aggressiveness compo-nents, such as sporulation, duration of latency (Pariaud et al.2009; Corio-Costet et al.2011) or could be due to external factors such as resistance to applied fungicides or differences in microclimate conditions (Gessler et al.2011). We initially tested the genotypes collected in different geographical locations (northern, central and southern Italy, and Israel) to ascertain whether different strains had adapted to grow at dif-ferent temperatures and we were able to exclude the temperature as a factor affecting the growth (latency) of the isolates. Apart from external factors potentially influencing growth and self-reproduction, other fac-tors such as competition between genotypes during asexual cycles may contribute to the dominance of a given genotype, indicating that additional, as yet iden-tified, processes are playing a role. We therefore stud-ied the dynamics of co-inoculations by P. viticola genotypes with similar aggressiveness components in order to assess potential competition during infection. To have a precise estimation of genotypes aggressive-ness we referred to the measure of three quantitative traits of pathogen’s life cycle such as infection effi-ciency, latent period and sporulation rate (Pariaud et al.2009). From these different parameters, a compos-ite fitness index (Corio-Costet et al.2011) was calcu-lated for each genotype, giving, as a result, that the three genotypes used in our co-inoculations experi-ments had similar aggressiveness; therefore, theoreti-cally, the same chances to successfully produce an infection, grow within the plant tissue, and produce sporangia. To quantify the biomasses of the genotypes co-inoculated in the host, we developed a precise method based on competitive microsatellite PCR. Competitive PCR is a precise quantification tool (Zentilin and Giacca 2007) and, given the natural length polymorphism of the SSR marker Pv14, differently-sized microsatellite DNA deriving from different P. viticola genotypes can serve as mutual competitors. The method allowed us to differentiate and quantify the biomasses of different P. viticola genotypes within the same plant tissue with sufficient resolution to study their variation over time. This quantification method requires careful selection of
microsatellite markers as they often generate stutter peaks, which can mask or overlap onto other alleles, and shorter alleles can be preferentially amplified (Daniels et al. 1998). These drawbacks were circum-vented in our PCR assay by selecting genotypes pre-senting similar, but still clearly distinguishable, fragment lengths in homozygosis for the SSR marker Pv14, which were also suitable (sharp peak and low stutter bands) for the quantification method based on competitive PCR. Unlike Naef et al. (2006) and Reininger et al. (2011) we directly quantified the bio-masses of the genotypes in the experimental samples without interpolation on the calibration curve. The fluorescence values obtained with the electrophero-gram were internally normalized and comparison with a standard was not necessary, on the assumption that the sum of the two peaks is equal to 100 and fluores-cence of each peak is expressed as a percentage.
When P. viticola genotypes were individually inoc-ulated, infections and subsequent sporulation occurred throughout the experiments at comparable rates. However, in both co-inoculation experiments, the two genotypes strongly compete, indicating the exis-tence of other factors for genotype selection. Analysis of three consecutive co-inoculation cycles in two dif-ferent co-inoculation experiments revealed a de-creased frequency of the VOL 1 genotype in the infections, independently of the proportions in the initial inoculum. Whereas the tested genotypes had comparable aggressiveness components and fitness indexes under individual inoculations, VOL 1 had the part of the weaker competitor in the co-inoculation experiments, indicating the additional fac-tors that may play a key role in competition. Although the mechanisms by which different genotypes com-pete are not well understood, for other oomycetes (i.e. Phytophthora infestans) it has been hypothesized that some genotypes could induce production of defence proteins in the host plant earlier than others in a competitive situation (Young et al.2009). Genotypes that are able to overcome the earlier plant defence reaction would have a competitive advantage, which, coupled with subsequent inhibition of other geno-types, would explain competitive selection (Young et al. 2009). In the pathogenic process caused by Peronosporaceae, effector proteins are responsible for modulation of plant cell defence and/or induction of cell death thus creating a favourable environment for infection (Stassen and Van den Ackerveken2011).
P. viticola does seem to modulate host cell defences through apoplastic and cytoplastic effectors secreted during the first stages of infection (Dìez-Navajas et al.
2008) and a first identification of effector genes have been recently described in germinating zoospores (Mestre et al.2012). The genetic variability of effec-tors across isolates has been demonstrated in var-ious oomycete species (Halterman et al. 2010) and in P. infestans isolates genetic variability at one effector locus has also been correlated with patho-gen aggressiveness (Halterman et al. 2010). Thus, as hypothesized for P. infestans genotypes (Young et al. 2009), the more competitive P. viticola gen-otypes could have a more complex arsenal of effectors enabling it to suppress or overcome host resistance, while the less competitive genotypes are more vulnerable to the host defence mechanism triggered by the more competitive genotype. The results and interpretations presented here represent a valuable addition to current knowledge of the biology of this grapevine pathogen. Plant-pathogen interactions seem to be more complex than mere colonization of plant tissue, since dif-ferent P. viticola genotypes react difdif-ferently when they co-exist on a unique substrate. Thus, differ-ences in the production of effector molecules could contribute to the establishment of dominant genotypes in the field over the course of an epidemic season of downy mildew.
Acknowledgments This research was supported by the Envir-oChange Project funded by the Autonomous Province of Trento.
References
Antonovics, J., & Alexander, H. M. (1989). The concept of fitness in plant-fungal pathogen systems. In K. J. Leonard & W. E. Fry (Eds.), Plant disease epidemiology (pp. 185– 214). New York, USA: Mc-Graw-Hill.
Corio-Costet, M.-F., Dufour, M.-C., Cigna, J., Abadie, P., & Chen, W.-J. (2011). Diversity and fitness of Plasmopara viticola isolates resistant to QoI fungicides. European Journal of Plant Pathology, 129(2), 315–329.
Daniels, J., Holmans, P., Williams, N., Turic, D., McGuffin, P., Plomin, R., et al. (1998). A simple method for analyzing microsatellite allele image patterns generated from DNA pools and its application to allelic association studies. The American Journal of Human Genetics, 62(5), 1189–1197. Delmotte, F., Chen, W. J., Richard-Cervera, S., Greif, C.,
Papura, D., Giresse, X., et al. (2006). Microsatellite DNA
markers for Plasmopara viticola, the causal agent of downy mildew of grapes. Molecular Ecology Notes, 6(2), 379–381.
Dìez-Navajas, A. M., Wiedemann-Merdinoglu, S., Greif, C., & Merdinoglu, D. (2008). Nonhost versus host resis-tance to the grapevine downy mildew, Plasmopara viticola, studied at the tissue level. Phytopathology, 98(7), 776–780.
Gessler, C., Pertot, I., & Perazzolli, M. (2011). Plasmopara viti-cola: a review of knowledge on downy mildew of grapevine and effective disease management. Phytopathologia Mediterranea, 50, 3–44.
Gobbin, D., Pertot, I., & Gessler, C. (2003). Identification of microsatellite markers for Plasmopara viticola and establishment of high throughput method for SSR anal-ysis. European Journal of Plant Pathology, 109(2), 153–164.
Gobbin, D., Jermini, M., Loskill, B., Pertot, I., Raynal, M., & Gessler, C. (2005). Importance of secondary inoculum of Plasmopara viticola to epidemics of grapevine downy mildew. Plant Pathology, 54(4), 522–534.
Gobbin, D., Rumbou, A., Linde, C. C., & Gessler, C. (2006). Population genetic structure of Plasmopara viticola after 125 years of colonization in European vineyards. Molecular Plant Pathology, 7(6), 519–531.
Gobbin, D., Bleyer, G., Keil, S., Kassemeyer, H. H., & Gessler, C. (2007). Evidence for sporangial dispersal leading to a single infection event and a sudden high i n c i d e n c e o f g r a p e v i n e d o w n y m i l d e w. P l a n t Pathology, 56(5), 843–847.
Halterman, D. A., Chen, Y., Sopee, J., Berduo-Sandoval, J., & Sànchez-Pérez, A. (2010). Competition between Phytophthora infestans effectors leads to increased aggres-siveness on plants containing broad-spectrum late blight resistance. PLoS One, 5(5), e10536.
Laviola, C., Cannizzaro, G., Conigliaro, G., & Burruano, S. (2006). Simple techniques for long-term storage of Plasmopara viticola. Phytopathologia Mediterranea, 45, 271–275.
Matasci, C., Jermini, M., Gobbin, D., & Gessler, C. (2010). Microsatellite based population structure of Plasmopara viticola at single vine scale. European Journal of Plant Pathology, 127(4), 501–508.
Mestre, P., Piron, M.-C., & Merdinoglu, D. (2012). Identification of effector genes from the phytopathogenic Oomycete Plasmopara viticola through the analysis of gene expression in germinated zoospores. Fungal Biology, 116(7), 825–835.
Naef, A., Senatore, M., & Défago, G. (2006). A micro-satellite based method for quantification of fungi in decomposing plant material elucidates the role of Fusarium graminearum DON production in the sapro-phytic competition with Trichoderma atroviride in maize tissue microcosms. FEMS Microbiology Ecology, 55(2), 211–220.
Pariaud, B., Ravigné, V., Halkett, F., Goyeau, H., Carlier, J., & Lannou, C. (2009). Aggressiveness and its role in the adaptation of plant pathogens. Plant Pathology, 58(3), 409–424.
Perazzolli, M., Roatti, B., Bozza, E., & Pertot, I. (2011). Trichoderma harzianum T39 induces resistance against
downy mildew by priming for defense without costs for grapevine. Biological Control, 58(1), 74–82. Reininger, V., Grünig, C., & Sieber, T. (2011).
Microsatellite-based quantification method to estimate biomass of Endophytic Phialocephala species in strain mixtures. Microbial Ecology, 61(3), 676–683.
Reuveni, M. (2003). Activity of the new fungicide benthiavali-carb against Plasmopara viticola and its efficacy in con-trolling downy mildew in grapevines. European Journal of Plant Pathology, 109(3), 243–251.
Rumbou, A., & Gessler, C. (2004). Genetic dissection of Plasmopara viticola population from a Greek vineyard in two consecutive years. European Journal of Plant Pathology, 110(4), 379–392.
Rumbou, A., & Gessler, C. (2006). Particular structure of Plasmopara viticola populations evolved under
Greek island conditions. Phytopathology, 96(5), 501–509.
Stassen, J. H. M., & Van den Ackerveken, G. (2011). How do oomycete effectors interfere with plant life? Current Opinion in Plant Biology, 14(4), 407–414.
Wong, F. P., Burr, H. N., & Wilcox, W. F. (2001). Heterothallism in Plasmopara viticola. Plant Pathology, 50(4), 427–432.
Young, G. K., Cooke, L. R., Kirk, W. W., Tumbalam, P., Perez, F. M., & Deahl, K. L. (2009). Influence of competition and host plant resistance on selection in Phytophthora infestans populations in Michigan, USA and in Northern Ireland. Plant Pathology, 58(4), 703–714.
Zentilin, L., & Giacca, M. (2007). Competitive PCR for precise nucleic acid quantification. Nature Protocols, 2(9), 2092– 2104.