Proceedings of the Nutrition Society (1997), 56, 2540 25
Human pattern of food intake and fuel-partitioning during weight recovery after starvation: a theory of autoregulation of body composition
BY A. G . DULL00
Department of Physiology, Faculty of Medicine, CMU, University of Geneva, I rue Michel-Servet, 1211 Geneva 4, Switzerland
A paradox in human bioenergetics today is the contrast between our detailed knowledge of
complex biochemical pathways of intermediary metabolism, and the large gap which exists in our understanding of basic physiological laws which govern weight regulation. The widespread application of powerful techniques of molecular biology to nutritional en- ergetics promises to sharpen this contrast even further. A striking example, of particular relevance to the present symposium on Mechanisms of Energy Compensation, is the recent identification of an adipocyte-specific gene (Zhang et al. 1994) whose expression is ‘ap-
parently’ consistent with the notion of a feedback signal between adipose tissue depletion and compensatory increases in food intake (Flier, 1995; Trayhurn, 1996). Yet, the relative importance of fat depletion as a determinant of post-starvation hyperphagia in human subjects is unknown, and the increase in appetite predicted to occur after lipectomy in animal models has been difficult to demonstrate (Weigle, 1994). On the other hand, the question of whether the depletion of lean tissues can provide a feedback signal on the hunger-appetite drive is rarely a subject for debate, despite evidence that food intake during growth is dominated by the impetus for lean tissue deposition (Webster, 1993), and in spite of the strong arguments put forward by Millward (1995) for the existence of a protein-stat mechanism for the regulation of lean body mass. In fact, a feedback loop between fat depletion and the food intake control centres cannot explain why human subjects recovering weight after a period of energy deprivation continue to overeat well after body weight and body fat have been restored to pre-starvation levels. This phe- nomenon of post-starvation energy over-compensation and overshoot in body weight, first documented by Benedict (1907) and Benedict et al. (1919) in studies of experimental
starvation and refeeding, was subsequently observed during follow-up studies of famine victims of World War I1 (Table 1).
THE SWISS FOOD RATIONING ‘EXPERIMENT’
In Switzerland, when food rationing was implemented in 1941, the physiologist Fleisch was asked by the ‘Federal Commission for Wartime Feeding’ to monitor the health consequences of this intervention. In addition to the assessment of mortality and morbidity related to cardiovascular, digestive and infectious diseases, the nutritional status was also determined in 700 persons of different ages, social status, and living areas, every 1-2 months between Autumn 1941 and Spring 1946 (Schwaben, 1947). The data collected on food consumption and body weight, compiled and published about 30 years later by Martin
& Demole (1973), are shown in Fig. l(a). Food intake and body weight dropped to the lowest level during the summer of 1945. At the end of that year, food rationing was abandoned and products were available again in larger quantities; food consumption and body weight rose rapidly. Of particular interest in these results of food deprivation in free- living human subjects is that they reveal that even under conditions when food intake was
26 A. G. DULL00 10 5 - 0 -5 -10 -15
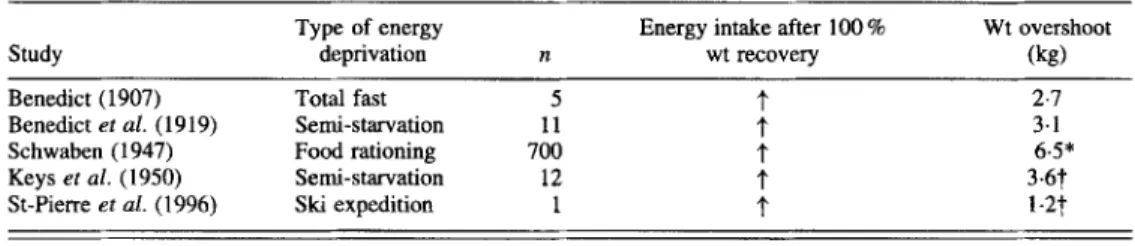
Table 1. Post-starvation energy over-compensation and weight overshooting in human subjects
Type of energy Energy intake after 100 % Wt overshoot
Study deprivation n wt recovery (kg)
-
-~
- - -
Benedict (1907) Total fast 5
t
2.7Benedict ef al. (1919) Semi-starvation 11 f 3.1
Schwaben (1947) Food rationing 700 f 6.5*
Keys ef al. (1950) Semi-starvation 12 f 3.6t
St-Pierre et al. (1996) Ski expedition 1 f 1 - 2 t
*Data calculated from Martin & Demole (1973).
?Excess weight was accounted for by fat, measured by hydrostatic weighing.
somehow restricted until weight had returned to its pre-weight-loss level, the phenomena of energy over-compensation and weight overshooting were evident during the subsequent months when food availability improved further.
THE MINNESOTA EXPERIMENT
Coincidentally, it was during the same time period that Keys et al. (1950), motivated by the desire to obtain quantitative information upon which to base an efficacious relief programme directed at nutritional rehabilitation of the starvation victims of World War 11, were conducting their study of experimental semi-starvation and refeeding in Minnesota (Fig. l(b)). The thirty-two healthy volunteers (many of whom were conscientious objectors
of war), were in continuous residence at the University of Minnesota during the 12-week control baseline period, 24 weeks of semi-starvation, and 12 weeks of restricted rehabilitation; furthermore, twelve of them also remained in the laboratory during the
(a) Swiss Food Rationing 'Experiment' tb) Minnesota Experiment
m Y 2 G .G
B E
LL 'O'OF
9.2t
8.41
7.5t
80 70 60 50 L!
"\
I
C S12 524 R12 R20 I~ S e m i - s t a r v a t i o n ~ l c R e f e e d i n ~ ~ l I 0 0z
X W Y (I) 4- .- > 0, w PFig. 1. Energy over-compensation and weight overshooting during weight recovery in human subjects (a) under free- living conditions during food rationing in Switzerland (adapted from Martin & Demole, 1973). and (b) under laboratory conditions during the classical Minnesota Experiment (adapted from Keys et al. 1950). (-), Body weight; (- - -),
food intake; C, end of 12 weeks of control period; S12, S24, end of 12 weeks and 24 weeks of semi-starvation respectively; R12, R20, end of 12 weeks of restricted refeeding and 8 weeks of ad libitum refeeding respectively.
MECHANISMS OF ENERGY COMPENSATION 27
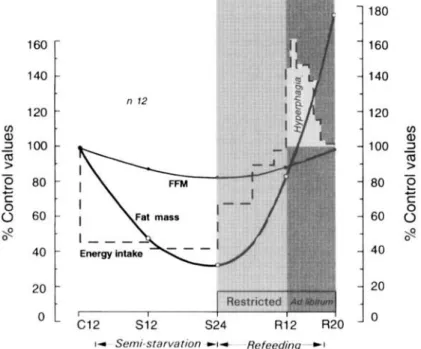
first 8 weeks after removal of dietary control, i.e. ad libitum refeeding. The total loss in body weight of about 25% of the original weight in each individual reproduced the conditions of severe semi-starvation, and is comparable with values found in severe famine. The design of the study was such that at the beginning of rehabilitation, the thirty- two subjects were divided into four groups, and were refed at four energy levels during the first 12 weeks, but even for those in the highest-energy group, the refeeding energy intake was maintained below the pre-starvation control level. It can be seen in Fig. l(b) that following removal of dietary control at the end of week 12 of restricted rehabilitation, the food intake increased markedly above the pre-starvation level, and that this hyperphagic response persisted for several weeks after body weight had reached the pre-starvation level. A closer inspection of the data on body composition (Fig. 2) reveals that when body fat had been completely recovered (i.e. 100 % of control level), at which point the fat-free mass (FFM) was not yet fully recovered, the hyperphagia was still very much evident, and seemed to disappear as
FFM
recovery approached 100% of the control level. These observations raise the possibility of a link between energy over-compensation and lean tissue recovery.THE GREENLAND EXPEDITION CASE STUDY
The experiences of semi-starved explorers over-indulging in food for weeks and months on their return from expeditions also document particularly well the phenomenon of energy over-compensation. Recently, St-Pierre et al. (1996) have described a case study of energy
160 140 120 100 80 60 $! 40 20 0 c12 s12 S24 R12 R20 180 160 140 120 100 80 60 40 20 0
-
P
4- C00
I ~ S e m i - s t a r v a t i o n - c l - R e f e e d i n g , ~ IFig. 2. Pattern of changes in energy intake, and in the main body energy compartments (i.e. fat and fat-free mass (FFM)). All values are expressed as percentages of corresponding values during the control (pre-starvation) period (Reproduced from Dulloo e? al. (1997) with permission). C12, end of 12 weeks of control period; S12, S24, end of 12 weeks and 24 weeks of semi-starvation respectively; R12, R20, end of 12 weeks of restricted refeeding and 8 weeks of ad libifurn refeeding respectively.
28 A. G. DULL00
balance before and after a ski expedition through Greenland in a 59-year-old man with a
habitual weight maintenance of 67.2 kg (Table 1). At 2-3 weeks after his return, his ad
libitum food intake was found to be 1.5MJ/d in excess of his habitual intake despite the
fact that his body weight and body fat had already been completely restored to habitual levels; by contrast his FFM was still lower by 1 kg. At
4
months post-expedition, hisFFM
was still not completely recovered, but his body weight and body fat had increased further to exceed his habitual levels by 1 a2 and 2.5 kg respectively, and food intake was 1.2 MJ/d in excess of his habitual intake. The results of this case study are consistent, therefore, with the previously mentioned observation in the Minnesota Experiment that the persistent hyperphagia is associated with an incomplete restoration of lean tissue.
FUNDAMENTAL QUESTIONS
These observations about energy over-compensation and their relationship with changes in body composition raise two issues of fundamental importance to the regulation of body composition during weight recovery, namely:
(1) What is the relative importance of lean and/or fat tissue depletion as determinants of the post-starvation hyperphagia?
(2) Why is fat recovered faster than lean tissue during weight recovery, and what are the determinants of the post-starvation pattern of lean and fat tissue deposition?
DETERMINANTS OF POST-STARVATION HYPERPHAGIA
There are very few studies that provide quantitative data on food intake and body weight in human subjects recovering from chronic energy deprivation, whether following experimental starvation, war famines or therapeutic dieting. To date, the Minnesota Experiment (Keys et at. 1950) is the only study in which both food intake and body composition were measured before severe weight loss and during subsequent weight recovery in a sufficiently large number of subjects. Given the previously mentioned observations from Fig. 2 suggesting a possible association between the pattern of hyperphagia and the recovery of lean and fat tissues, we have recently re-analysed the individual data on food intake and body composition with the main objective of determining the extent to which the degree of depletion of fat and lean tissue compartments at the end of the first phase of restricted refeeding (at week 12 of restricted rehabilitation period) could predict the degree of hyperphagia during the subsequent period (8-week period after removal of dietary control) of ad libitum refeeding (Dulloo et al. 1997).
Methods
The individual data on food intake, body fat and FFM of the twelve subjects who remained in the laboratory during this period of ad libitum refeeding were used to calculate the following variables:
(1) a quantitative index of hyperphagia, i.e. the total hyperphagic response during the ad
libitum refeeding period, calculated as the energy intake in excess of that during the pre-
starvation (control) period;
(2) a quantitative index of the degree of fat and FFM replenishment before ad libitum refeeding, calculated as the deviation in fat and
FFM
from their respective pre-starvation values, andMECHANISMS OF ENERGY COMPENSATION 29
Fat recoven/ at R12 FFM recovery at R12
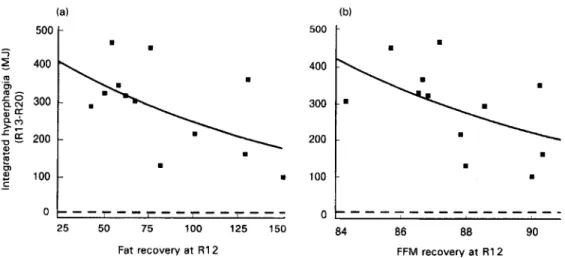
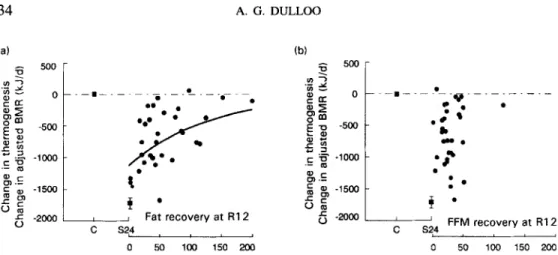
Fig. 3. Relationship between the hyperphagic response during ad libitum refeeding and the degree of (a) fat recovery or (b) FFM recovery, both expressed as 70 control values. The correlation between hyperphagia and one of the two tissue compartments persists after adjusting (by partial correlation) for variability in the other compartment. By stepwise- regression analysis, the hyperphagic response was found to be determined by (1) the degree of fat recovery, (2) the degree of food intake deficit in the preceding period of restricted refeeding, and (3) the degree of FFh4 recovery; these three independent determinants together contributed to about 80 % of the inter-individual variability in the hyperphagic response (Reproduced from Dulloo et al. (1997) with permission). R12, R20, end of 12 weeks of restricted refeeding and 8 weeks of ad libitum refeeding respectively. (a) ? 0.3. (h) 3 0.3.
(3) a quantitative index of the deficit in energy intake before ad libitum refeeding, cal-
culated as the difference between the energy intake during the period of restricted refeeding and that during the pre-starvation control period.
Results
The results of regression analyses (simple and partial) indicated that the total hyperphagic response (integrated hyperphagia) was inversely correlated to both the degree of fat recovery (Fig. 3(a)) as well as that of FFM recovery (Fig. 3(b)), and that the latter are two independent determinants of hyperphagia. While these findings are in line with the lipostatic theory of Kennedy (1953) in that the greater the degree of fat depletion (i.e. the lower the degree of fat recovery), the greater the hyperphagic response, they also reveal that post-starvation hyperphagia is also a function of the degree of lean tissue depletion. Thus, as for body fat, the greater the degree of lean tissue depletion (i.e. the lower the degree of FFM recovery), the greater the hyperphagic response. Furthermore, after adjusting for the varying degrees of the previous energy intake deficit during restricted refeeding, the correlations between the hyperphagia and fat recovery or FFM recovery still persisted. They actually improved, thereby suggesting that the drive to overeat after food restriction is not only determined by psychophysiological responses to the previous degree of food deprivation per se, but also by the extent to which both fat and FFM are depleted. In fact, the results of stepwise-regression analysis indicated that of the three determinants for post-starvation hyperphagia, it is the degree of fat recovery that is the strongest, with a significant contribution from the FFM recovery as well. Consequently the possibility arises that feedback loops between the state of depletion of the fat and FFM compartments and the hunger-appetite centres in the central nervous system play a central role in post-
30 A. G . DULL00
starvation hyperphagia. In other words, a considerable component of the hyperphagic response to chronic energy deprivation can be regarded as the outcome of an autoregulatory control system that contributes to the restoration of body weight and body composition.
DETERMINANTS OF POST-STARVATION PATTERN OF LEAN AM) FAT TISSUE DEPOSITION
A large inter-individual variability in the composition of weight gain and a disproportionately greater gain in fat tissue relative to lean tissue are common observations in human subjects recovering weight after a period of negative energy balance or growth arrest (Jackson, 1984; Waterlow, 1992). For example, studies of nutritional rehabilitation in malnourished infants and children often report either poor recovery of body weight (Ashworth, 1969) or that gains in body weight during apparently successful catch-up growth are largely fat, with the reconstitution of lean body mass lagging behind (Reeds et
al. 1978; MacLean & Graham, 1980). This same phenomenon, that fat increases more rapidly than active tissues, has been pointed out since the turn of the century in adults recovering body weight after diseases or famines (Jamin & Muller, 1931; Kornfeld &
Schiiller, 1931). In particular, Debray et al. (1946) noted that the early increase in the
weight of prisoners transferred from German concentration camps to a Paris hospital in a condition of severe starvation was largely due to the accumulation of fat rather than to the rebuilding of muscles. Keys et al. (1950) in their study on long-term experimental semi- starvation and refeeding went to the extent of describing this phenomenon as ‘post- starvation obesity’. During more recent decades, there have been many more reports about the preferential increase in body fat rather than in lean tissue recovery in adult patients recovering from severe weight losses due to protein-energy malnutrition (Barac-Nieto et
al. 1979), anorexia nervosa (Mitchell & Truswell, 1987), and various pathophysiological conditions including cancer (Van Eys, 1985), septic shock (Streat et al. 1987), and acquired
immune deficiency syndrome (Kotler et al. 1990). It has been suggested that this phenomenon by which the rate and/or amount of fat deposition predominates over muscle reconstitution occurs because dietary protein or other nutrient supply may not be high enough for optimal protein deposition, or that the absolute amount of food consumed may greatly exceed the energy requirements for maintenance, tissue synthesis and physical work, such that the extra energy ingested is deposited as fat. Such arguments, however, focus entirely upon the role of unbalanced diets or excess dietary intake. They do not explain individual variability in the composition of weight gained during rehabilitation on well-balanced diets and under conditions of restricted refeeding, not that the dispropor- tionate deposition of body fat over lean tissue recovery persists independently of dietary protein intake and levels of energy supplementation. In fact, little attention has been directed as the possibility that these phenomena may also result from individual variability in the control of energy-partitioning and/or from alterations in the control of thermogenesis, despite the fact that these control systems are known to play a critical role in determining the pattern of protein and fat mobilization during weight loss. Indeed, the analysis of human data during severe energy deficit has demonstrated that:
(1) the control of energy partitioning during weight loss is an individual characteristic based on the fact that the proportion of energy mobilized from protein (the P ratio) during
prolonged starvation varies considerably among individuals (Dugdale & Payne, 1977; Henry et al. 1988);
(2) the reduction in BMR during weight loss is greater than can be accounted for by the loss of active tissues (Rentice et al. 1991; Luke & Schoeller, 1992; Leibel et al. 1995). This reduction in the energy cost of maintenance (i.e. reduction in thermogenesis) is
MECHANISMS OF ENERGY COMPENSATION 31
adaptive in that it conserves energy and, hence, reduces the rate at which the body’s energy reserves are being depleted.
The critical questions, therefore, are whether the control systems operating via energy partitioning and/or via suppression of thermogenesis during weight loss also operate during weight recovery. Using the approach of ‘system analysis’, we have re-analysed the data on dynamic changes in body composition and BMR of the thirty-two Minnesota men who completed the 24 weeks of semi-starvation and 12 weeks of restricted refeeding (Dulloo et
al. 1996). Our main objectives were as follows:
(1) to determine whether the control of energy partitioning, as an individual characteristic, is conserved during weight recovery, and establish whether a predictor could be statisti- cally identified;
(2) to determine whether the reduction in thermogenesis during weight loss persists during weight recovery, and underlies the disproportionate recovery of fat tissue.
Methods
For each of the thirty-two Minnesota men, the individual data on body fat,
FFM
and BMR assessed during the control period, at the end of the 24 weeks of semi-starvation and at the end of this subsequent 12-week period of restricted refeeding were used to calculate the following variables:(1) a quantitative index of energy partitioning, the P ratio, defined as the proportion of body energy mobilized as protein during weight loss (the semi-starvation P ratio), or as the proportion of body energy gained as protein during weight recovery (the refeeding P ratio); (2) a quantitative index of altered thermogenesis, defined as the change in BMR adjusted for changes in
FFM
(or for changes in bothFFM
and fat mass):(3) the degree of replenishment of the fat and
FFM
compartments, defined as the recovery of body fat andFFM
(during refeeding) as a percentage of that lost during semi-starvation.Results
The results of these analyses, on the basis of data on body composition either uncorrected or corrected for changes in hydration and for relative bone mass, indicated the following:
(a) (b) - 6 0.30 - 0 0.25 - $ g 5 E
z
c 5 4-
3 2 1 * * -1 1 0.00 0.05 0 10 0.15 0.20 0.25 0.30 Semi-starvatton P ratioFig. 4. (a) Relationship between the proportion of energy mobilized from protein (P ratio) dunng refeeding and P ratio during semi-starvation; (-), the line of identity of these two P ratios; 3 0.31. (b) Three-dimensional plot showing inter- relationshp between P ratio dunng semi-starvation, P ratio dunng refeeding, and the natural logarithm of body fat recovery dunng refeeding; 2 0.6 (Reproduced from Dulloo et al. (1996) with permission).
32 A. G . DULL00
(1) the highly variable P ratio during refeeding is strongly correlated with the P ratio during semi-starvation, particularly after controlling for the varying degrees of fat recovery (Fig. 4);
( 2 ) of several anthropometric variables monitored during the control period (weight,
height, BMI, body fat, percentage fat, abdominal circumference), the percentage fat during the control period is the most important predictor of inter-individual variability in P ratio (Fig. 5);
( 3 ) at week 12 of restricted refeeding, thermogenesis is found to be reduced by a mag-
nitude which is inversely proportional to the degree of fat recovery (Fig. 6(a)), but un- related to the degree of
FFM
recovery (Fig. 6(b)).Control of energy partitioning: an individual characteristic
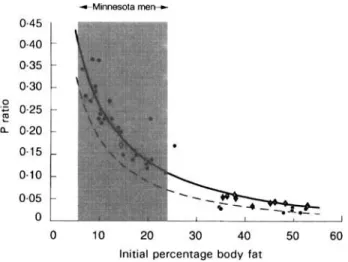
The notion that the control of energy partitioning between the two major energy stores (protein and fat) is an individual characteristic was first proposed by Payne & Dugdale (1977), and supported by data from studies of prolonged fasting showing that the P ratio during weight loss varies among individuals but is relatively constant in the same individual (Henry et al. 1988). The demonstration from data of the Minnesota men that their highly variable P ratios during refeeding are strongly correlated with their P ratios during semi-starvation (Fig. 4), provides direct evidence that the control of energy partitioning is an individual characteristic and, hence, a critical factor underlying the large inter-individual variability in the composition of weight gain during refeeding. Furthermore, the data on the predictors of the P ratio revealing that body composition during the control period, and more specifically the initial percentage body fat, is the most important determinant of variability in energy partitioning, suggests that the higher the initial percentage body fat, the lower the proportion of energy mobilized as protein and, hence, the greater the propensity to mobilize fat during semi-starvation and to subsequently deposit fat during refeeding. This inverse relationship between the degree of fatness and P ratio observed in the Minnesota men is in full accord with the analysis of human data on prolonged fasting by Henry et al. (1988) who showed that the P ratio was inversely related to BMI and was five to ten times lower in obese individuals than in lean individuals. In order to examine in more detail the relationship between adiposity and the characteristic P ratio of an individual, we have pooled the data obtained on P ratio during semi-starvation in the Minnesota Experiment on normal weight Caucasians with (a) those calculated by Henry et al. (1988) during prolonged fasting in obese Caucasians, and (b) with P ratio data which we have calculated from energy and N balance on obese Caucasians undergoing semi-starvation for 40-45 d (Passmore et al. 1958). As can be seen in Fig. 5, more than 85 % of the variance in P ratio could be explained by the percentage body fat before energy deficit; the same relationship is obtained independently of whether or not excess hydration of the
FFM
is taken into account in the calculation of the P ratio for the Minnesota men. The steep part of the exponential curve lies between 8-20 % body fat, and a shift from the lower to the upper values in this range, generally considered to reflect a ‘normal’ range of adiposity for men living in affluent societies, results in 2.5-3-fold reduction in P ratio. This extremely high sensitivity of the P ratio with regard to the initial body compositionemphasizes the critical importance of even small differences in the initial percentage body fat in dictating the individual’s energy-partitioning characteristic and, hence, the pattern of lean and fat tissue deposition during weight recovery.
MECHANISMS OF ENERGY COMPENSATION 33 +Minnesota m e w 0.45 0.40 0.35 0.30
,E
0.25 a 0.20 0.15 0.10 0.05 0 L 0 10 20 30 40 50 60Initial percentage body fat
Fig. 5. Relationship between the proportion of energy mobilized from protein (P ratio) during severe energy deficit and the initial (pre-starvation) percentage body fat (Reproduced from Dulloo et al. (1996) with permission). All data are
from Caucasians and derived from studies of Keys et al. (1950), Henry et al. (1988), and Passmore et al. (1958). (0). Semi-starvation; (0, +). prolonged starvation; (-, - - -), based on data for the Minnesota men either corrected ( 3
0.90) or uncorrected (3 0.84) for excess hydration and relative bone mass respectively; ( ), The range of percentage body fat for normal-weight individuals.
Adaptive reduction in thennogenesis speciJic for fat replenishment: source of disproportionate recovery of fat over lean tissue
On the other hand the finding, shown in Fig. 6, that the adaptive reduction in
B M R
during refeeding is primarily a function of fat recovery (and not related toFFM
recovery), suggests that, in addition to the energy-partitioning (P ratio) characteristic of the individual,mechanisms that increase metabolic efficiency and, hence, economize energy also contribute to increase the rate of fat deposition during refeeding. Direct evidence for the existence of mechanisms that suppress thermogenesis and accelerate specifically the replenishment of body fat stores has been reported during complete energy-balance studies in laboratory animals regaining weight after energy restriction (Dulloo & Girardier, 1990).
Under conditions whereby the rehabilitated animals were pair-fed to weight-matched controls, the rate of protein deposition was found to be the same as in controls, but the rate of fat deposition was increased by 2-3-fold as a result of 10-15% lower energy expenditure during refeeding. Furthermore, this increased metabolic efficiency for fat replenishment resulting from suppression of thermogenesis was found to persist independently of the duration of previous underfeeding, the age of the animal (Dulloo &
Girardier, 1990, 1993), environmental temperature (Dulloo et al. 19956) and the
macronutrient composition of the rehabilitation diet (Dulloo & Girardier, 1992; Dulloo et al. 199%). The data from the Minnesota Experiment suggest that similar energy-
conservation mechanisms specific for fat replenishment also exist in human subjects, and that they are revealed under conditions of restricted refeeding after severe depletion of body fat stores. Quantitatively, this reduced thermogenesis during restricted refeeding in human subjects also represents an economy of 10-15 % in
BMR,
when integrated between 0 and 100% fat recovery (Dulloo et al. 1996).34 A. G . D U L L 0 0 (a) (bt
-
500 B .;2
,"a Og z
/"J
g a -p
-500 5 s ca
-1000 g .t6 :
'*.*
.-I'
6 -15006
-2000 I ' I I Fat recovery at R 1 2 C S24 & C * 'z
: *I '
FFM recovery at R12-
C S24 0 50 1Mf 150 2M) 0 50 100 150 200Fig. 6. Relationship between altered thermogenesis during weight recovery (assessed as BMR adjusted for changes in fat-free mass (FFM)) and the recovery of fat or FFM (Reproduced from Dulloo et al. (1996) with permission). There is an exponential relationship between the change in thermogenesis and fat recovery (a; 3 0.34), which contrasts with the lack of correlation with regard to FFM recovery (b; 2 0.002). The data for fat and FFM recovery are expressed as percentage of fat and FFM lost during semi-starvation respectively, and the same relationships are obtained if fat or
FFM recovery are expressed as a percentage of their corresponding vaiues during the control (pre-starvation; C) period. S24, End of 24 weeks of semi-starvation; R12, end of 12 weeks of restricted feeding.
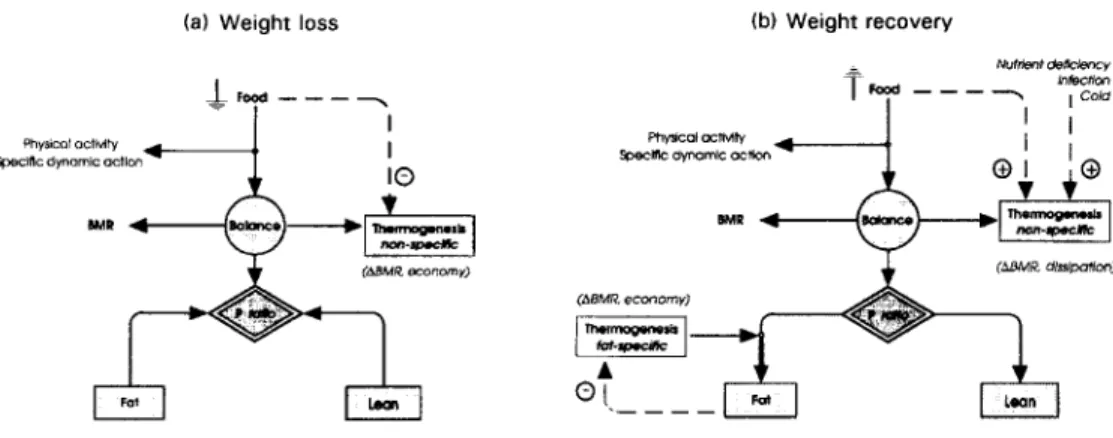
INTEGRATING THE CONTROL OF ENERGY PARTITIONING AND THERMOGENESIS The central finding of this re-analysis, therefore, is that the control systems that modulate the pattern of lean and fat tissue mobilization during weight loss, i.e. the control of energy partitioning and thermogenesis, also operate during weight recovery to modulate the pattern of lean and fat tissue deposition. The overall integration of these control systems in the regulation of body composition during a cycle of weight loss and weight recovery is discussed with the help of the schematic diagram presented in Fig. 7. This model embodies the findings that the control of energy partitioning is an individual characteristic, and takes into account the two distinct control systems for adaptive thermogenesis which can operate independently of each other:
(1) one form of thermogenesis which is a direct function of food intake;
(2) the other form of thermogenesis modulates the efficiency of fat storage by a function which is inversely proportional to the degree of fat replenishment.
Operational mode of proposed compartmental model
During weight loss (Fig. 7(a)), the control of energy partitioning determines the relative proportions of protein and fat to be mobilized from the body as fuel (i.e. the individual's P
ratio), and the reduction in thermogenesis is directed at reducing the energy imbalance, with the net result that there is a slowing in the rate of protein and fat mobilization in the same proportions as defined by the characteristic P ratio of the individual. Support for the contention here that a reduction in thermogenesis during weight loss does not alter the P
ratio can be obtained from the demonstration of Henry et al. (1988) that within the same individual, the P ratio remains relatively constant during the course of prolonged
starvation. During severe energy deficit, therefore, the pattern of lean and fat tissue mobilization is determined essentially by individual variability in the control of energy partitioning, and adaptive reductions in thermogenesis serve to reduce the overall rate of fuel utilization; hence, sparing 'non-specifically' the lean and fat compartments.
MECHANISMS OF ENERGY COMPENSATION
35
(a) Weight loss (b) Weight recovery
Fig. 7. Schematic representation of a compartmental model for the regulation of body composition during a cycle of (a) weight loss and (h) weight recovery. During weight loss, the energy economy resulting from a reduction in thennogenesis is directed in such a way as to spare (non-specifically) both the lean and fat compartments as defined by the characteristic proportion of energy mobilized from protein (P ratio) for the individual. In contrast, during weight recovery, the energy economy resulting from a reduction in thennogenesis is specifically directed at replenishing the fat compartment, with the net result that the measured (apparent) P ratio during weight recovery will be lower than the characteristic P ratio for the individual. The existence of these two distinct forms of adaptive thennogenesis provides an explanation for the co-existence of a hypermetabolic state (e.g. in response to infections, nutrient deficiencies, cold exposure) and the suppression of thennogenesis specific for accelerating fat replenishment. ABMR, change in BMR. (Adapted from Dulloo et al. (1996) with permission.)
During weight recovery (Fig. 7(b)), the control of energy partitioning operates in such a way that protein and fat are deposited in the same relative proportion as that determined by the P ratio of the individual during weight loss, and the energy saved as a result of reduced thermogenesis is directed specifically at accelerating body fat replenishment. The net effect is that fat is deposited in excess of that determined by the characteristic P ratio of the individual, thereby contributing to the disproportionate rate of fat relative to lean tissue recovery.
Co-existence of reduced thermogenesis for fat replenishment and other energy-dissipating mechanisms
It should be borne in mind that the reduction in thermogenesis specific for fat replenishment, as assessed by the fall in BMR (adjusted for changes in FFM and fat) during refeeding in the Minnesota men, is an underestimation since it is partially masked by other factors influencing BMR during weight recovery, e.g. by the total energy cost for lean and fat tissue synthesis andor deposition, and possibly also by increases in other forms of thermogenesis, e.g. those under sympathetic neural control. Since these confounding factors will increase in magnitude with higher planes of nutrition, it is understandable that other studies examining metabolic rate during rehabilitation using much more generous energy loads than in the Minnesota Experiment, have not found adjusted BMR to be lower, but to be normal or high during the early phase of refeeding (Grande et al. 1958; Jackson, 1984; Waterlow, 1992). However, since the mechanism suppressing thermogenesis is primarily governed by the degree of fat replenishment, this implies that it can operate concomitantly and independently of other mechanisms for thermogenesis and energy dissipation. The model presented in Fig. 7(b), therefore,
36 A. G . DULL00
provides a structural framework that explains the apparent paradox that the suppression of thennogenesis enabling accelerated fat deposition during refeeding can actually co-exist alongside conditions whereby other forms of thermogenesis are activated; such as during exposure to cold (Dulloo et al. 1995b), during refeeding with low-protein diets (Kashyap et
al. 1988) or under conditions of pathophysiological hypermetabolic states (Jackson, 1984). It can also co-exist with situations in which total energy expenditure is high as a result of higher rates of protein synthesis (e.g. during catch-up growth), or lipogenesis, which in turn depend on the P ratio of the individual and on the dietary energy intake and the fat : carbohydrate ratio.
A CONCEPTUAL MODEL OF AUTOREGULATION OF BODY COMPOSITION DURING WEIGHT
RECOVERY
The control systems operating through energy partitioning, thermogenesis, and hunger- appetite have been incorporated in a conceptual model of autoregulation of body weight and body composition depicted in Fig. 8, and are outlined below.
1. Energy partitioning between lean and fat tissue compartments is a characteristic of the individual based on the observation that for a particular adult individual, the proportion of the total body energy mobilized as protein during weight loss (i.e. the P ratio) is strongly correlated with the proportion of body energy deposited as protein during weight recovery, and that variability in P ratio between individuals is very strongly determined by the initial (pre-starvation) percentage body fat. This leads to the concept that the initial percentage body fat provides a ‘lean-fat compartmental memory’ which defines the P ratio of the individual and dictates not only his (her) pattern of lean and fat tissue mobilization during energy deficit, but also the way that energy deposited during refeeding is repartitioned into lean and fat tissue compartments.
2. Thermogenesis is suppressed during weight recovery, and by a magnitude which is
proportional to the degree of fat depletion, but unrelated to the degree of FFM depletion. This leads to the concept that there exists a memory of the largest fat stores reached in a given individual, i.e. a ‘fat-stores memory’ which governs the suppression of thermo- genesis as a function of the replenishment of the fat stores. The functional importance of the economy in thermogenesis during weight recovery is, therefore, to accelerate specifi- cally the replenishment of the fat stores, thereby contributing to the disproportionate rate of fat relative to lean tissue recovery. This control of ‘fat-specific’ thermogenesis functions as a specific accelerator of body fat during weight recovery, and is distinct from the control of ‘non-specific’ thermogenesis which functions as an attenuator of energy imbalance.
3. Hunger-appetite drive leads to hyperphagia during weight recovery, and the magnitude
of this hyperphagic response is determined at least in part by the extent to which body fat and FFM are depleted, with the degree of fat depletion being the stronger determinant. The hyperphagic response, therefore, seems to be dictated not only by a memory of the initial fat stores but also by a memory of the initial FFM (hence, lean tissue) compartment. The functional importance of this increase in the hunger-appetite sensation, with consequential hyperphagia, is to accelerate the restoration of both lean and fat compartments, as defined by the energy-partitioning characteristic of the individual.
Implications for energy compensation
That the ‘autoregulatory component’ of the hyperphagic response to energy deprivation goes beyond an explanation based entirely on the lipostatic theory, and that it is also
MECHANISMS OF ENERGY COMPENSATION 37
Concepts
I
Memories of body composition II Fat : FFM . - - .. - -. . ._ . Fat _-_
___
-. FFM , - . .I
Fat4
4
+
4
Determinants Control systems Regulated system . - - . -__ . . . - - - .. .- .__
.-___
. - .Attenuator Accelerator Individual Accelerator
A Energy balance Fat recovery characteristic Fat and FFM Fat: FFM partitioning recovery
Fig. 8. Conceptual model for autoregulation of body composition during weight recovery; for details, see p. 36. P raho, proportion of energy mobilized from protein; FFM, fat-free mass; A, change. The components of this model are all based on evidence derived from the re-analysis of data of the Minnesota Expenment (Adapted from Dulloo et al. (1997) with perrmssion).
governed by the degree of lean tissue depletion has both theoretical and clinical implications with regard to problems associated with the management of obesity, and malnutrition and/or cachexia.
Energy over-compensation and fat overshooting: a role for adaptive thermogenesis
One important feature of this model (Fig. 8) is the sharp contrast between the determinants
of the two accelerators: the suppression of thermogenesis (fat-specific) is dictated specifically by the degree of depletion of body fat (and not by
FFM
depletion) whereas the control system operating through increased hunger-appetite is dictated by the degree of depletion both in fat and FFM. This differential relationship of hyperphagia and fat-specific thermogenesis with regard to the two tissue compartments suggests that there is an asymmetry in the way lean and fat tissues are recovered, with fat being recovered at a faster rate than lean tissue. This would provide an explanation for the fact that when fat recovery in the Minnesota men reached 100 %, theFFM
recovery was incomplete (Fig. 2). Since the depletion of FFM can also drive hyperphagia, a consequence of the delay in achieving 100%FFM
recovery is that the hyperphagia is prolonged until FFM is fully recovered. However, since the completion of FFM recovery can only be achieved through the process of energy partitioning, more body fat is also deposited, hence accentuating the phenomenon of fat overshooting. Simplistically, it can be said that fat overshooting is a consequence of delayed protein repletion, in turn resulting from the suppression of thermogenesis favouring specifically the replenishment of fat stores.38 A. G. DULL00
Management of obesity and cachexia
A role for lean tissue depletion in the post-starvation hyperphagic response also has direct implications for the treatment of obesity since it raises the possibility that the use of approaches designed to limit the loss of lean tissues is likely to reduce the drive on hunger, and, hence, improve the efficacy of dietary slimming regimens. On the other hand, the notion that protein depletion is a weaker determinant of the hyperphagic response than fat depletion may also have clinical implications with regard to the difficulties of recovering lean tissue (and, hence, bodily functions) during nutritional rehabilitation of malnourished and cachexic patients. These pathophysiological states are often characterized by poor appetite, with a tendency for weight gain to be disproportionately high in fat relative to lean tissue. Consequently, on the basis that the degree of fat depletion is the strongest determinant of the hyperphagic response, approaches designed to maintain the fat stores in a state of depletion are likely to provide a stronger drive to eat, thereby promoting lean tissue recovery in these patients.
CONCLUDING REMARKS
The recent advances in the area of molecular genetics, adipocyte functions and myofibrillar gene expression are major breakthroughs that offer powerful tools and ‘entry points’ for elucidating potential pathways and feedback loops that constitute control systems regulating body composition. The compartmental and conceptual models for the regulation of body composition during cycles of weight loss-weight recovery proposed here offer a theoretical framework in which to integrate these ‘forthcoming’ pathways and feedback loops in the context of system physiology. Such an interdisciplinary approach will be invaluable for our understanding of the mechanisms that control body weight in health and disease, and in the design of novel and more effective strategies for improving 1ean:fat tissue recovery in malnourished and/or cachexic patients, as well as for counteracting the relapse of obesity and its associated health hazards.
RE! F E RE N C E S
Ashworth, A. (1969). Growth rates in children recovering from protein-calorie malnutrition. British Journal of Nutrition 23, 835-845.
Barac-Nieto, M., Spurr, G. B.. Lotero, H., Maksud, M. G. & Dahners, H. W. (1979). Body composition during nutritional repletion of severely undernourished men. American Journal of Clinical Nutrition 32, 981-991. Benedict, F. G. (1907). The Influence of Inanition on Metabolism. Carnegie Institute of Washington Publication
no. 77. Washington, DC: Camegie Institute of Washington.
Benedict, F. G., Miles, W. R., Roth, P. & Smith, H. M. (1919). Human Vitaliry and ESJiciency under Prolonged Restricted Diet. Carnegie Institute of Washington Publication no. 280. Washington, DC: Carnegie Institute of Washington.
Debray, C., Zarakovitch, M., Ranson, B., Jacquemin, J., Robert, J. & Siraga, M. (1946). Contribution B I’ttude de la pathologie des dtportts (Contribution to the study on the pathology of the deportees). Seminuire H6pitd de Paris 22, 863-870.
Dugdale, A. E. & Payne, P. R. (1977). Pattern of lean and fat deposition in adults. Nature 266, 349-351. Dulloo, A. G. & Girardier, L. (1990). Adaptive changes in energy expenditure during refeeding following low
calorie intake: evidence for a specific metabolic component favouring fat storage. American Joumal of Clinical Nutrition 52, 415-420.
Dulloo, A. G. & Girardier, L. (1992). Influence of dietary composition on energy expenditure during recovery of body weight in the rat: Implications for catch-up growth and obesity relapse. Metabolism 41, 1336-1342. Dulloo, A. G. & Girardier, L. (1993). Adaptive role of energy expenditure in modulating body fat and protein
deposition dunng catch-up growth after early undernutntion. American Journal of Clinical Nutrition 58, 614421.
Dulloo, A. G., Jacquet, J. & Girardier, L. (1996). Autoregulation of body composition during weight recovery in humans: the Minnesota Experiment revisited. Intertuitional Journal of Obesity 20, 393-405.
MECHANISMS OF ENERGY COMPENSATION 39 Dulloo, A. G., Jacquet, J. & Girardier, L. (1997). Post-starvation hyperphagia and body fat overshooting in humans: a role for feedback signals from lean and fat tissues. American Journal of Clinical Nutririon (In the Press).
Dulloo, A. G., Men& N., Seydoux, J. & Girardier, L. (1995a). Differential effects of high-fat diets varying in fatty-acid composition on the efficiency of lean and fat tissue deposition during weight recovery after low food intake. Metabolism 44, 273-279.
Dulloo, A. G., Seydoux, J. & Girardier, L. (1995b). Dissociation of enhanced efficiency of fat deposition during weight recovery from sympathetic control of thermogenesis. American Journal of Physiology 269, R365- R369.
Flier, J. S. (1995). The adipocyte: storage depot or node on the energy information superhighway? Cell 80, Grande, F., Anderson, J. T. & Keys, A. (1958). Changes of basal metabolic rate in man in semi-starvation and
refeeding. Journal of Applied Physiology 12, 230-238.
Henry, C. J. K., Rivers, J. P. W. & Payne, P. R. (1988). Protein and energy metabolism in starvation reconsidered. European Journal of Clinical Nutrition 42, 543-549.
Jackson, A. A. (1984). Nutritional adaptation in disease and recovery. In Nutritional Adaptation in Man, pp. 11 1-126 [K. Blaxter and J. C. Waterlow, editors]. London: John Libby.
Jamin, F. & Muller, E. (1931). Uber das spezifische Gewicht des lebenden Menschen mit bsonderer Beriicksichtigung eines fiir klinische Zwecke brauchbaren ‘spez. Aequivalentengewichts’ (Specific weight of
the living man with clinical applications for recovery of body weight). Miinchener Medizinishche Wochenschrifi 51, 349-362.
Kashyap, S., Schulze, K. F., Forsyth, M., Zucher, C., Dell, R. B., Ramakrishnan, R. & Heird, W. C. (1988). Growth, nutrient retention, and metabolic response in low birth weight infants fed varying intakes of protein and energy. Journal of Pediatrics 113, 713-721.
Kennedy, G. C. (1953). The role of depot fat in the hypothalamic control of food intake in the rat. Proceedings of the Royal Society, London 140B, 578-592.
Keys, A., Brozek, I., Henschel, A., Mickelsen, 0. & Taylor, H. L. (1950). The Biology of Human Starvation. Minnesota: University of Minnesota Press.
Kornfeld, W. & Schiiller, H. (1931). Das Verhalten der Weichteilmasse w&end der Freiluftbehandlung bei Kindern mit inaktiver Tuberkulose (Pattern of lean tissue deposition in free-living children recovering from tuberculosis). Zeitschrij? fur Kinder und Jugendpsychiatrie 51, 349-362.
Kotler, D. P., Tierney, A. R., Culpepper-Morgan, J. A., Wong, J. & Pierson, R. M. Jr (1990). Effect of parented nutrition on body composition in patients with acquired immunodeficiency syndrome. Journal of Parenteral and Enteral Nutrition 14, 454-458.
Landsberg, L. & Young, J. B. (1978). Fasting, feeding and regulation of the sympathetic nervous system. New England Journal of Medicine 298, 1295-1301.
Leibel, R. L., Rosenbaum, M. & Hirsch, J. (1995). Changes in energy expenditure resulting from altered body weight. New England Journal of Medicine 332, 621-628.
Luke, A. & Schoeller, D. (1992). Basal metabolic rate, fat-free mass, and body cell mass during energy restriction. Metabolism 41, 450-456.
MacLean, W. C. & Graham, G. G. (1980). The effect of energy intake on nitrogen content of weight gained by recovering malnourished infants. American Journal of Clinical Nutrition 33, 903-909.
Martin, E. & Demole, M. (1973). Une exp6rience scientifique d’alimentation controlte: le rationnement en Suisse pendant la deuxiime guerre mondiale (A scientific experiment of controlled food intake: food rationing in Switzerland during World War 11). In Rkgulation de Z’Equilibre Energktique chez 1’Homme. vol. 1, pp. 185-193 [M. Apfelbaum, editor]. Paris: Masson.
Millward, D. J. (1995). A protein-stat mechanism for regulation of growth and maintenance of the lean body mass. Nutrition Research Reviews 8, 93-120.
Mitchell, P. B. & Truswell, A. S. (1987). Body composition in anorexia nervosa and starvation. In Handbook of Eating Disorders. Part 1, Anorexia and Bulimia Nervosa, pp. 45-71 [P. J. V. Beumont, G. D. Burrows and R. C. Casper, editors]. Amsterdam: Elsevier.
Passmore, R., Strong, J. A. & Ritchie, F. J. (1958). The chemical composition of the tissue lost by obese patients
on a reducing regimen. British Journal of Nutrition 12, 113-122.
Payne, P. R. & Dugdale, A. E. (1977). Mechanisms for the control of body weight. Lancet i, 583-586. Prentice, A. M., Goldberg, G. R., Jebb, S. A., Black, A. E. & Murgatroyd, P. R. (1991). Physiological responses Reeds, P. J., Jackson, A. A., Picou, D. & Poulter, N. (1978). Muscle mass and composition in malnourished Schwaben, B. (editor) (1947). Ernahrungsprobleme in Mangelzeiten (Nutritional Problems During Food St-Pierre, S., Roy, B. & Tremblay, A. (1996). A case study on energy balance during an expedition through
15-18.
to slimming. Proceedings of the Nutrition Society 50, 441458.
infants and children and changes seen after recovery. Pediatric Research 12, 613-618. Rationing). Basel: A. Fleisch.
40 A. G. DULL00
Streat, S. J., Brodie, A. H. & Hill, G. L. (1987). Aggressive nutritional support does not prevent protein loss Trayhum, P. (1996). Expression of the ob (obese) gene and the leptin system. International Journal of Obesity Van Eys, J. (1985). Nutrition and cancer. Annual Review of Nutrition 5 , 435-461.
Waterlow, J. C. (1992). Protein Energy Malnutrition. London: Edward Arnold.
Webster, A. J. F. (1993). Energy partitioning, tissue growth and appetite control. Proceedings of the Nutrition Weigle, D. S . (1994). Appetite and the regulation of body composition. FASEB Journal 8, 302-310. Zhang, Y., Proenca, R., Maffei, M., Barone, M., Leopold, L. & Friedman, J. M. (1994). Positional cloning of the
despite fat gain in septic intensive care patients. Journal of Trauma 27, 262-266. 20, Suppl. 4, 22-23.
Society 52, 69-76.
mouse obese gene and its human homologue. Nature 372, 425-431.