Fine-scale population structure analysis of seven
local Swiss sheep breeds using genome-wide SNP
data
A. Burren
1,
H. Signer-Hasler
1,M. Neuditschko
2,J. Tetens
3,J. Kijas
4,C. Drögemüller
5andC. Flury
1 1School of Agricultural, Forest and Food Sciences HAFL, Bern University of Applied Sciences, Länggasse 85, 3052 Zollikofen, Switzerland;2Swiss National Stud Farm, Agroscope, Les Long Prés, Case postale 191, CH-1580 Avenches, Switzerland;3Institute of Animal Breeding and Husbandry, Christian-Albrechts-University Kiel, Hermann-Rodewald-Straße 6, 24118 Kiel, Germany;4CSIRO Livestock Industries, St Lucia, Brisbane, Queensland, Australia;5University of Berne, Institute of Genetics, Bremgartenstrasse 109, 3001 Berne, Switzerland
Summary
As part of the global sheep Hapmap project, 24 individuals from each of seven indigenous Swiss sheep breeds (Bundner Oberländer sheep (BOS), Engadine Red sheep (ERS), Swiss Black-Brown Mountain sheep (SBS), Swiss Mirror sheep (SMS), Swiss White Alpine (SWA) sheep, Valais Blacknose sheep (VBS) and Valais Red sheep (VRS)), were genotyped using Illumina’s Ovine SNP50 BeadChip. In total, 167 animals were subjected to a detailed analysis for genetic diversity using 45 193 informative single nucleotide polymorph-isms. The results of the phylogenetic analyses supported the known proximity between populations such as VBS and VRS or SMS and SWA. Average genomic relatedness within a breed was found to be 12 percent (BOS), 5 percent (ERS), 9 percent (SBS), 10 percent (SMS), 9 percent (SWA), 12 percent (VBS) and 20 percent (VRS). Furthermore, genomic relationships between breeds were found for single individuals from SWA and SMS, VRS and VBS as well as VRS and BOS. In addition, seven out of 40 indicated parent –off-spring pairs could not be confirmed. These results were further supported by results from the genome-wide population cluster analysis. This study provides a better understanding offine-scale population structures within and between Swiss sheep breeds. This relevant information will help to increase the conservation activities of the local Swiss sheep breeds.
Keywords: dense marker data, genetic diversity, ovis aries Résumé
En el marco del proyecto internacional Hapmap Ovino, se genotiparon, con el chip Ovine SNP50 BeadChip de Illumina, 24 ejemplares de cada una de las siete razas ovinas autóctonas de Suiza (Oveja del Oberland de los Grisones (OG), Oveja Roja de Engadina (RE), Oveja Negra-marrón de Montaña (NM), Oveja Espejo (OE), Oveja Alpina Blanca (AB), Oveja de Hocico Negro del Valais (HN) y Oveja Pelirroja del Valais (PV)). En total, 167 animales fueron sometidos a un análisis minucioso de diversidad genética, para el cual se usaron 45 193 polimorfismos informativos de nucleótido simple. Los resultados de los análisis filogenéticos confirmaron la ya conocida cercanía entre ciertas poblaciones tales como la HN y la PV o la OE y la AB. El parentesco genómico medio intra-racial fue de 12 por ciento para la OG, de 5 por ciento para la RE, de 9 por ciento para la NM, de 10 por ciento para la OE, de 9 por ciento para la AB, de 12 por ciento para la HN y de 20 por ciento para la PV. Se detectó además parentesco genómico entre razas para ejem-plares aislados de la AB y la OE, la PV y la HN y la PV y la OG. Por otro lado, no se pudieron confirmar 7 de las 40 parejas señaladas de progenitores-descendencia. Estos resultados fueron posteriormente respaldados por los resultados de un análisis de conglomerados del genoma completo de la población. Este estudio permite una mejor comprensión de la estructura a pequeña escala de las poblaciones intra- e inter- razas ovinas suizas. Con esta información, será posible llevar a cabo un mayor número de actividades para la conservación de las razas ovinas locales de Suiza.
Mots-clés: diversité génétique, information de marqueurs denses, ovis aries Resumen
Dans le cadre du projet international Hapmap Ovins, 24 individus de chacune des sept races ovines autochtones de la Suisse (Mouton de l’Oberland Grison (OG), Mouton Roux d’Engadine (RE), Mouton de Montagne Noir-marron (MN), Mouton Miroir (MM), Mouton Alpin Blanc (AB), Mouton Nez-Noir du Valais (NN) et Mouton Roux du Valais (RV)) ont été génotypés en utilisant la puce Ovine SNP50 BeadChip d’Illumina. En tout, 167 animaux ont été soumis à une analyse minutieuse de diversité génétique, pour laquelle 45 193 polymorphismes nucléotidiques informatifs ont été utilisés. Les résultats des analyses phylogénétiques ont corroboré la proximité déjà connue entre certaines populations telles que NN et RV ou MM et AB. La parenté génomique moyenne intra-raciale a été de 12 pour cent pour le OG, de 5 pour cent pour le RE, de 9 pour cent pour le MN, de 10 pour cent pour le MM, de 9 pour cent pour le AB, de 12 pour cent pour le NN et de 20 pour cent pour le RV. En outre, des rapports génomiques interraciaux ont été décelés entre individus
Correspondence to: C. Flury, School of Agricultural, Forest and Food Sciences HAFL, Bern University of Applied Sciences, Länggasse 85, 3052 Zollikofen, Switzerland. email:christine.fl[email protected]
isolés des races AB et MM, RV et NN et RV et OG. Par ailleurs, 7 des 40 paires parents-descendants signalées n’ont pas pu être confirmées. Ces résultats ont été ultérieurement corroborés par les résultats d’une analyse de groupement de l’ensemble du génome de la population. Cette étude permet une meilleure compréhension de la structure à petite échelle des populations intra- et inter-races ovines suisses. Cette information servira à mener un plus grand nombre d’activités pour la conservation des races ovines locales de la Suisse.
Palabras clave: diversidad genética, información de marcadores densos, ovis aries
Submitted 7 March 2014; accepted 16 May 2014
Introduction
Switzerland has numerous indigenous and locally devel-oped sheep breeds. These genetic resources with unique adaptive traits are assumed to respond best to the pressures of the local environment (Glowatzki-Mullis et al., 2009). To understand variation within and between local sheep breeds, the regular analysis of available genetic diversity is advised. Pedigree-based analysis of different genetic diversity parameters has been conducted for four main breeds using a generic report for population management named POPREP (Groeneveld et al., 2009): Swiss White Alpine (SWA), Swiss Black-Brown Mountain sheep (SBS), Valais Blacknose sheep (VBS) and Brown Headed Meat (Burren et al., 2012). For the year 2008, almost 30 000 SWA lambs were produced by SWA, and, for the latter three breeds, about 10 000 lambs were born, according to herdbook records (Burren et al.,2012). Due to the remarkable average inbreeding coefficient of 9.2 per-cent and an effective population size below 100 regular monitoring of the available genetic diversity was proposed for the VBS breed (Burren et al., 2012), a local breed which is limited to one geographic region of Switzerland. Beside the four main breeds under scrutiny, Glowatzki-Mullis et al. (2009) investigated the genetic diversity of Engadine Red sheep (ERS), Swiss Mirror sheep (SMS), Valais Red sheep (VRS), East Friesian and Skudden sheep using 44 microsatellites. Using the software program STRUCTURE (Pritchard et al., 2000), the two local breeds (VRS and VBS), which originated in the same geographical area, could not be differentiated. In addition, genetic proxim-ity between SWA and SMS was determined. These results were in line with the findings of an earlier study based on 31 microsatellites (Stahlberger-Saitbekova et al.,2001). Within the International Sheep Genomic Consortium (ISGC), a genome-wide single nucleotide polymorphism (SNP) panel was developed and tested based on genotypes from 2 819 sheep belonging to 74 breeds (Kijas et al., 2012). Out of these, seven were local sheep breeds from Switzerland. Based on a principal component analysis (PCA), this study showed clear genetic divisions separat-ing European, Asian and African sheep breeds. Even though: aspects of genetic diversity andfine-scale popula-tions of local Swiss breeds are only sparsely covered by these authors. Therefore, the public available genotypes
from 168 individuals of seven Swiss breeds (SWA, SBS, VBS, ERS, SMS, VRS and Bundner Oberländer sheep (BOS)) were isolated from the ISGC (Kijas et al., 2012) and re-analysed with special focus on genetic diversity of local Swiss breeds. The primary goal of the current study was to investigate fine-scale population structures within and between Swiss sheep breeds using dense SNP data and applying network-based clustering methods. The results are compared with results from earlier studies based on microsatellites. Potential needs for genetic mon-itoring and conservation activities are underlined.
Material and methods
Data
The sheep breeds used in this study were previously described in detail by Kijas et al. (2012). During the trial, 24 individuals from each of the seven indigenous Swiss sheep breeds were genotyped using the Illumina Ovine SNP50 BeadChip (Kijas et al., 2012). In the sheep HapMap project, it was subjected that a breed includes at least one parent–offspring pair, therefore some of the individuals included in the data sample are known relatives to each other (Kijas et al., 2012) and these relationship were described in the data release. Totally, the analysed data set comprised 20 trios (i.e. gen-otyped individual and genotypes for both parents) (Table S1). Beside this information, no more pedigree information was available for genotyped individuals. The data set wasfiltered using PLINK-1.07 (Purcell et al., 2007). Firstly, non-annotated SNPs or SNPs with missing positions were removed. Secondly, SNPs with a minor allele frequency below 0.05, with more than 10 percent missing genotypes per marker or per individual, or those deviating from Hardy–Weinberg equilibrium ( p = 0.0001) were excluded. 45 193 SNPs (92 percent) from the initial available 49 034 SNPs passed thefiltering pro-cedure. Using qualityfiltered SNPs, the genome-wide pro-portions of shared alleles identical by descent (IBD) between all samples were calculated using PLINK-1.07. The estimated genomic relationship (pi-hat) between two samples from the VRS breed was 100 percent (identical) and so one duplicate genotype was excluded from further
analysis. Due to restricted sample size, the genotypic infor-mation for 20 trios was not omitted from thefinal analysis. Finally, the genotypic information from a total of 167 indi-viduals and 45 193 SNPs covering 26 ovine autosomes was considered for the population structure analysis.
Cluster analysis and genomic relationships
The program ADMIXTURE (Alexander, Novembre and Lange, 2009) was used to determine the optimal number of k clusters and for assigning individuals to their true clus-ters. The algorithms implemented in ADMIXTURE are con-sidered to be computationally more efficient (Alexander, Novembre and Lange, 2009) than the algorithms imple-mented in the software STRUCTURE (Pritchard et al., 2000) and can be easily applied on genome-wide data sets to infer individual ancestry. By adding the –cv flag, ADMIXTURE includes a cross-validation procedure that allows identification of the optimal value of k for which the model has best predictive accuracy (Alexander, Novembre and Lange, 2009). Within this analysis, –cv was set to 10, and the k with the lowest cross-validation error was used for the choice of the optimal number of clusters for the set of genotypes under investigation. The software DISTRUCT (Rosenberg, 2004) was used for the graphical presentation of each cluster assignment increas-ing k from 2 to 8.Due to the availability of large numbers of SNPs, it was possible to calculate genome-wide IBD or identical by state (IBS) between samples using the PLINK-1.07 (Purcell et al., 2007) option –genome. This option was used to estimate the genome-wide proportions of IBD (pi-hat) between individuals. The estimated proportions of IBD were graphically converted using the R-function levelplot of the packageLATTICE(Sarkar,2008).
Besides the model-based cluster analysis, we further investigated the population structure of sheep breeds using PCA and multi-dimensional scaling (MDS). PCA and MDS are non-parametric approaches, which utilize pairwise relationships between individuals for the final visualization of genome-wide population structures. PCA identified the principal components that represented the population structure based on genetic correlations (shared ibs segments) between individuals, whereas MDS identified dimensions that explained observed genetic distance between individuals (Wang et al., 2009). For MDS analysis, genome-wide pairwise ibs-distances between individuals were used in conjunction with the –mds-plot –cluster = 3 option in PLINK-1.07 (Purcell et al., 2007). The MDS plot was created using the R-package SCATTERPLOT3D (Ligges and Mächler, 2003).
Finally, we used high definition network visualization for the available SNP genotypes to detect fine-scale popula-tion structures within and between sheep breeds (Neuditschko, Kathkar and Raadsma,2012). The so-called
NETVIEW approach (Neuditschko, Kathkar and Raadsma, 2012) consists of five distinct components: data prepar-ation and editing, calculprepar-ation of a genetic-relprepar-ationship or genetic distance matrix among all individuals and samples, network construction, clustering of individuals within the population network and finally, the visualization of the clustering results using the software CYTOSCAPE(Shannon et al., 2003). The number of nearest neighbours (k-NN) was set equal 10. For additional visualization of hierarch-ical population structures, the R-packagePHYTOOLS(Revell, 2012) was applied. Thickness of lines connecting indivi-duals was set in proportion to ibs-distances between indi-viduals (i.e. ibs-distances >0.8 = thick line; ibs-distances <0.8 = thin line).
Phylogenetic analysis
To evaluate the general hierarchical population structure of the sheep breeds, pairwise FST-values were calculated
among the seven sheep breeds from population allele frequencies across all 45 193 autosomal SNPs using the program package GENEPOP 4.1.4 (Rousset, 2008). For the graphical presentation of phylogenetic relationships between the seven breeds, the common applied neighbour-joining (NJ)-method was chosen, as implemented in the program SPLITSTREE4 (Huson and Bryant,2006).
Derivation of linkage disequilibrium (LD) and
estimation of effective population size (N
e)
PLINK-1.07 (Purcell et al.,2007) was used to estimate pair-wise LD between SNPs. r2-values over all 26 autosomes were grouped according to their physical intermarker-distances, assuming a constant recombination rate, and were then averaged for distance bins of 50 kb. The smal-lest bin ranged from 0 to 50 kb and the largest from 1 950 to 2 000 kb, resulting in bins with a minimum average intermarker-distance of 25 kb up to a maximum of 1 975 kb. To derive estimates of recent effective population sizes (i.e. Nefive or ten generations ago) two ‘maxi’-bins
for pairs of SNPs with an average intermarker-distance of 4 975 and 9 975 kb, respectively, were created.
For the derivation of Ne, Sved’s equation (Sved,1971) was
applied
E(r2)= 1/(1 + 4Nec).
In the case of restricted sample sizes, Weir and Hill (1980) proposed that the equation be completed using the term (1/n). Thus, the equation was converted allowing for an estima-tion of Ne
E(r2)= 1/(1 + 4Nec)+ 1/n,
where E(r2) is the expectation of the correlation between allele frequencies of two loci, n is 2* sampled animals, c is the genetic distance between loci in Morgan and Ne
is the effective population size. The genetic distance between SNPs (c) was approximated by setting 1 Mb equal to 0.01 Morgan. Applying this formula, Ne was
estimated for 1/2c previous generations (Hayes et al., 2003).
Results
Cluster analysis and genomic relationships
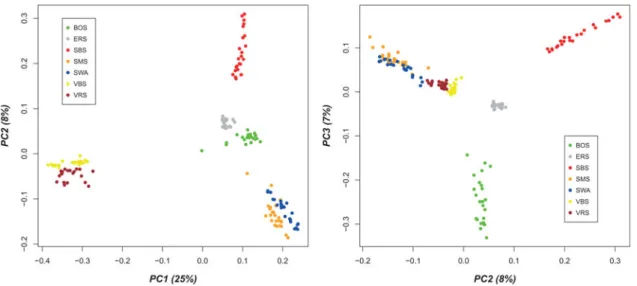
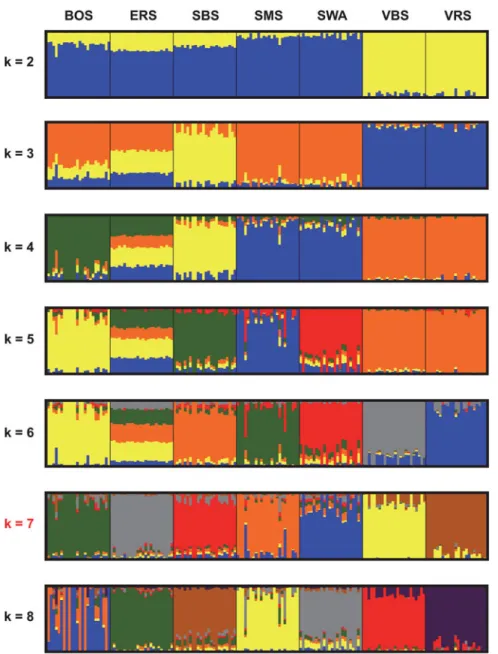
The graphical visualization of the results from cluster analysis of the 167 animals for k ranging from two to eight clusters is shown in Figure 1. The cross-validation error was assessed to define the optimal value for k for the different number of clusters (Supplementary Figure S2). The cross-validation error decreased to k = 7 and then increased again. Therefore, k = 7 was determined to be an optimal number of clusters for the analysis given inFigure 1.Thefirst principal component (PC1) explained 25 percent of the observed variation (Figure 2), the second (PC2) 8 percent and the third (PC3) 7 percent, respectively. The separation of the seven breeds was obvious by contrasting PC1 versus PC2 and PC2 versus PC3. Thefirst component identified the separation of the Valais breeds (VBS and VRS) from the other breeds, whereas the second compo-nent showed the separation between SBS, ERS and BOS, as well as SMS and SWA. Using the third compo-nent, the separation between BOS and ERS became clear-er, whereas the Valais breeds (VBS and VRS) and SMS had higher connection with SWA. The MDS plot is given in Supplementary Figure S1.
The visualization of the investigated network for the data is given in Figure 3. The thickness of the lines varies in proportion with the genetic distance and is used to visual-ize the individual relationships within and between
populations. The node size varied in proportion to the numbers of edges per node, and illustrated how well each individual was connected within the population (Neuditschko, Kathkar and Raadsma, 2012).
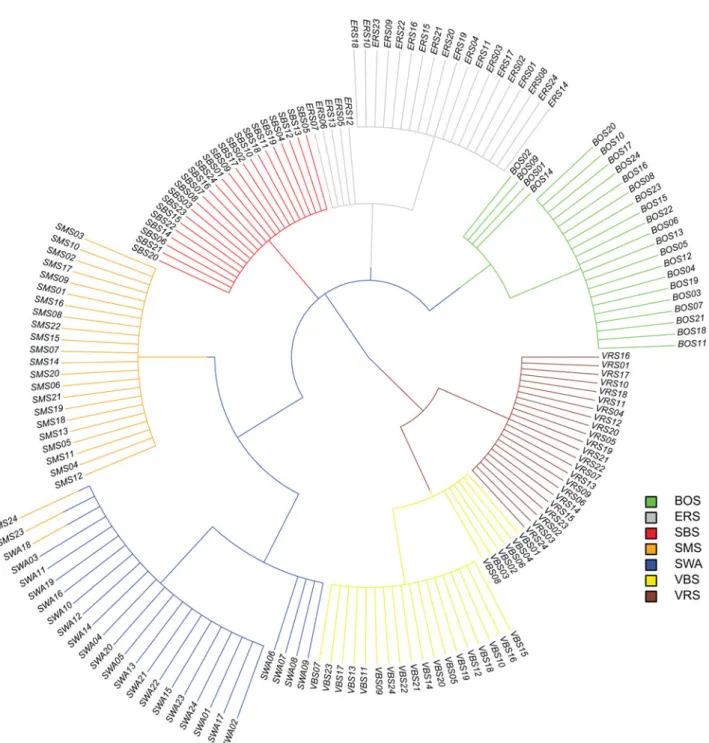
Additionally, the network-based-cluster tree is given in Figure 4, where each breed is represented by the same col-our as inFigure 3. At the base of the tree, the Valais breeds (VBS and VRS) were separated from the otherfive breeds. At the second level, all breeds were assigned into distinct clusters, except SMS and SWA individuals. At the third level substructures within BOS, ERS and the VBS breed became visible, while VRS, SBS and SMS reflect homo-genous samples. Additionally, SWA and SMS were clus-tered according to the initial breed assignment into distinct groups, except two SMS individuals (SMS24 and SMS23). Substructure in SWA occurred at the fourth and thefinal level of the tree.
Genomic relationships within and between breeds are given in Figure 5. The average genomic relationships (within breeds) varied from 5 percent (ERS), 9 percent (SBS), 9 percent (SWA), 10 percent (SMS), 12 percent (BOS), 12 percent (VBS) to 20 percent (VRS). Some gen-omic relationships (>0 between populations) were found for two SMS individuals (SMS24 and SMS23) and SWA (light blue), for some VRS individuals with VBS (light green) and for one BOS individual with VRS. Estimated genomic relationships between the 20 offspring with their genotyped parents are given in Supplementary Table S1. For seven offspring genomic relationships below 0.35 with one parent were found.
Phylogenetic analysis
The NJ-tree (Supplementary Figure S3) represents the phylogenetic relationships for the seven Swiss sheep breeds based on FST-distances. VBS and VRS were
found to be clearly distinct from other breeds. SWA and
SMS were also on a separate branch, but less far away from the other breeds. The shortest FST-distance was
found between SBS and ERS breeds.
Marker-based estimation of effective
population size
Estimates of pairwise LD between SNPs for different dis-tance bins were used to derive effective population sizes for the seven Swiss sheep breeds investigated. The result for the development of Neover the last 2 000
genera-tions for all breeds is shown in Supplementary Figure S4, where the population sizes for all seven breeds showed a decreasing trend. Based on the two maxi bins, estimates for recent Ne (last five to ten generations) as 18–35 for
SBS, 27–44 for VRS, 26–47 for BOS, 29–49 for SMS, 29–58 for VBS, 30–58 for ERS and 31–66 for SWA, respectively, were determined.
Discussion
Genetic diversity between breeds
Based on the PCA results (Figure 2) and the MDS plot (Supplementary Figure S1), the seven breeds can be clus-tered intofive distinct groups with evidence of additional sub-structures. The three breeds, BOS, SBS and ERS, com-prised distinct groups, whereby VBS/VRS and SMS/SWA individuals were not clearly separated from each other. The proximity between VBS/VRS and SMS/SWA was fur-ther supported by the Admixture and NetView analysis pre-sented inFigures 1and4, while these two methods divide the individuals into seven respective breed groups. However, based on these results, it was assumed that the proximities within these two clusters are of different origin. VBS and VRS are local Swiss alpine breeds, which are geographically restricted to the canton of Valais. The differentiation of these two breeds from the otherfive breeds was supported by data
shown inFigure 1, i.e. from k = 2 to 5, the two breeds clus-tered together and are clearly distinct from all others. In Figure 4, VBS and VRS are separated from the other breeds at the base of the tree. Data illustrated in Figure S3 showed that the common branch connecting the two breeds with the other breeds is quite long. Therefore, it was assumed that the geographical differences for these two breeds com-pared with the other breeds is, genetically, rather old. The proximity between VRS and VBS was determined using
44 microsatellites (Glowatzki-Mullis et al., 2009) and 31 microsatellites (Stahlberger-Saitbekova et al.,2001). Based on PCA, Kijas et al. (2012) found the two Valais breeds to be genetically distinct from the other breeds. Based on their genetic uniqueness, a high potential for conservation is attributed to these two breeds.
Network visualization (Figure 3) showed that VRS21 was related to BOS07. This relationship was supported by four
genomic relationships that were slightly greater than zero (0.0376, 0.0283, 0.0251 and 0.0247) between this VRS individual and two BOS individuals (Figure 5). This con-nection was thought to originate from breeding practices over the last 20 years. Four sheep breeds (BOS, ERS, SMS and VRS) were not officially annotated before 1999. In the year 1982, the foundation ‘ProSpecieRara’ was created to promote plant and livestock genetic resources (FOAG, 2007). The foundation collected remaining animals of these four sheep breeds and sup-ported farms keeping such individuals. Therefore, it is possible that a certain exchange between these breeds hap-pened by chance on farms with small herds of different breeds or before the collection of remaining individuals.
The similarity between SMS and SWA was supported by Glowatzki-Mullis et al. (2009), Stahlberger-Saitbekova et al. (2001) and Kijas et al. (2012). The SMS is a des-cendant of the ancient Grisons breed (FOAG,2007) and, as stated previously, was not officially annotated until 1999. The main visual differentiation between SMS and SWA are the dark-haired patterns found in SMS animals around the mouth and the eyes (resembling spectacles). It is expected that crossbreeding with SWA – the most popular sheep breed in Switzerland– occurred in the recent past before the breeding programme for SMS started (Stahlberger-Saitbekova et al., 2001; Glowatzki-Mullis et al., 2009). The results from network-analysis (Figure 3) showed that one SMS individual (SMS23) fell between
the SMS and the SWA clusters and one individual from SMS (SMS24) lay in the SWA cluster, which is related to SMS. The first individual was assumed to be a crossbred with SWA, although for the second sheep, a wrong breed assignment of the sampled DNA could be an explanation. In Figure 4, these two individuals were grouped into the SWA cluster. In Figure 5, these two SMS individuals could be recognized, based on the genomic relationships. They were almost certainly not related to the majority of the other individuals from the SMS sample, but showed a certain relationship with many individuals of the SWA breed. Unfortunately, animal identities were not available and therefore the retrospective reconstruction of such connections based on herdbook-information was not possible.
The results for the ERS breed were also interesting. In the PCA plot (Figure 2) and the MDS plot (Supplementary Figure S1), the sample group for the ERS fell between all the other clusters. Based on the results from ADMIXTURE (Alexander, Novembre and Lange, 2009) for k = 3–6, the breed seemed to be a conglomerate of genetic resources from different origins (Figure 1). However, with k = 7, ERS became clearly distinguishable from the other clusters. The specific pattern of the ERS sample was not observed in a cluster analysis based on 41 microsatellites (Glowatzki-Mullis et al.,2009). The network visualization allowed a more detailed understanding of connections between individuals of the ERS sample to individuals of the other breeds (Figure 3). One ERS individual fell out-side the ERS cluster and had connections to individuals from the BOS and SBS breeds. Additionally, this individ-ual was directly related to an ERS individindivid-ual that was con-nected to an outlier of the SMS breed (Figure 3). According to the data shown in Supplementary Figure S3, the differ-entiation time was shortest between ERS and SBS, fol-lowed by BOS. However, no genomic relationships (>0) could be found between the 24 ERS individuals and those from the SBS and BOS samples. The origins of the
ERS can be traced back to the Stone sheep of the Eastern Alps and the Bergamasca sheep (FOAG,2007). In a recent-ly published study, the genetic relationships between Italian sheep breeds and other European sheep breeds were derived using genome-wide SNP data (Ciani et al., 2014). This study confirms the known proximity between ERS and the Bergamasca breed at molecular level as ERS clustered closest to this Italian breed in a NJ tree based on Reynolds-genetic distances. Hence, for the ERS breed it is concluded, that the consideration of samples from Swiss sheep breeds only, limits the understanding of itsfine-scale population structures.
Genetic diversity within breeds
Average genomic relationships within breeds ranged from 5 percent (ERS) to 20 percent (VRS) (Figure 5). As previ-ously stated, the VRS breed is historically restricted to a single region in the canton Valais. Furthermore, the actual population size of VRS is considerably small (about 1 000 herdbook individuals). With average genomic relationships of 12 percent, the VBS and BOS breeds showed the sec-ond highest average genomic relationships within breed. Based on pedigree information, an average inbreeding coefficient of 9.2 percent was found for the 10 000 VBS individuals born in the year 2008 (Burren et al., 2012). For SBS, SMS and SWA breeds, the average genomic rela-tionships ranged from 9 to 10 percent. The lowest average genomic relationships within the ERS sample was not sur-prising due to the known historic influences of different breeds mentioned above. The availability of dense SNP data allows the derivation of pairwise genomic relation-ships when pedigree information is missing (Hasler et al., 2011). The genomic relationships of parent –off-spring pairs for the 20 trio indicated in the initial file are given in Supplementary Table S1. For seven offspring, the estimated genomic relationships with one parent were found to be lower than 0.35. Due to the remarkable dis-crepancy of the realized genomic relationships from the expected relationships (eq. (0.5)) it assumed that the indi-cation of six sires and one dam for these seven offspring is not correct. Thisfinding was further supported by missing thick lines between these pairs inFigure 4.
NetView visualization demonstrated that the samples for all breeds showed a certain substructure (Figures 3and4). Reasons for this could include the sampling procedure (i.e. sampling related individuals from one herd) and cross-breeding. The substructure of the VBS and the SWA sample (Figures 3and4) is mainly a fact of the sampling of directly related animals (i.e. trio). The two main Swiss sheep breeds SWA and SBS are especially known to be influenced by other European sheep breeds. This result was supported by Kijas et al. (2012), where SWA, SBS and SMS were in an intermediate position in the PCA of European sheep breeds.
Estimates of ancestral and recent Ne for the seven sheep
breeds based on SNP data are shown in Supplementary
Figure 5. Genomic relationships within and between breeds (the colour scale for the levels of genomic relationships is given at the right end of the matrix).
Figure S4. The Neshowed a decreasing trend over the last
2 000 generations, with an increasingly steeper slope since about 700 generations ago. The highest historically effect-ive population size was found for ERS and the lowest for SMS. For recent effective population sizes, the estimates varied from 18 (SBS) to 31 (SWA)five generations ago, to 35 (SBS) and 66 (SWA) ten generations ago. Generally, the differences for recent effective population sizes between breeds were rather small. However, as some of the investigated samples were influenced by admixture and restricted sample sizes, those estimates should be interpreted with caution (Corbin et al.,2012). Based on the genetic uniqueness of the VRS and the VBS breed and the high level of relatedness within those two breeds, the implementation of monitoring programmes to control genetic diversity in daily breeding practice is pro-posed. For the other breeds, regular monitoring of genetic diversity is advised.
Conclusions
Genomic relationships greater than zero were found for some individuals from different breeds. Thus having genome-wide SNP data available, it is possible to over-come the limitation of pedigree information and derive genomic relationships between breeds. The results related to general population structures are comparable with those from earlier studies based on microsatellites. However, dense SNP data used here in combination with network-theory allowed for a more detailed analysis of fine-scale population structures of seven Swiss sheep breeds. The two geographically separated breeds, VBS and VRS, are clearly distinct from the other Swiss sheep breeds and show remarkable genomic relationships within population. Therefore, the implementation of mechanisms to control genetic diversity is proposed for these breeds.
Acknowledgements
The Swiss Federal Office of Agriculture is acknowledged for the financial support of the costs for genotyping. Lucy Waldron is acknowledged for grateful support related to language editing.
References
Alexander, D., Novembre, J. & Lange, K. 2009. Fast model-based estima-tion of ancestry in unrelated individuals. Genome Res., 19: 1655–1664. Burren, A., Flury, C., Aeschlimann, C., Hagger, C. & Rieder, S. 2012. Populationsstruktur und genetische Diversität von Schweizer Schafrassen. Agrarforschung Schweiz., 3: 140–147.
Ciani, E., Crepaldi, P., Nicoloso, L., Lasagna, E., Sarti, F.M., Moioli, B., Napolitano, F., Carta, A., Usai, G., D’Andrea, M., Marletta, D., Ciampolini, R., Riggio, V., Occidente, M., Matassino, D.,
Kompan, D., Modesto, P., Macciotta, N., Ajmone-Marsan, P. & Pilla, F. 2014. Genome-wide analysis of Italian sheep diversity reveals strong pattern and cryptic relationships between breeds. Anim. Genet., 45(2): 256–266.
Corbin, L.J., Liu, A.Y.H., Bishop, S.C. & Woolliams, J.A. 2012. Estimation of historical effective population size using linkage disequilibria with marker data. J. Anim. Breed. Genet., 129: 257–270. FOAG. 2007. Farm animal genetic resources in Switzerland. Booklet in the Order of the Federal Office of Agriculture for the First Technical Conference on Animal Genetic Resources, Interlaken, 2007 (available at http://www.blw.admin.ch/themen/00013/00082/00087/index.html? lang=en).
Glowatzki-Mullis, M.-L., Muntwyler, J., Bäumle, E. & Gaillard, C. 2009. Genetic diversity of Swiss sheep breeds in the focus of conser-vation research. J. Anim. Breed. Genet., 126: 164–175.
Groeneveld, E., Westhuizen, B.v.d., Maiwashe, A., Voordewind, F. & Ferraz, J.B.S. 2009. POPREP: a generic report for population man-agement. Genet. Mol. Res., 8(3): 1158–1178.
Hasler, H., Flury, C., Menet, S., Haase, B., Leeb, T., Simianer, H., Poncet, P.A. & Rieder, S. 2011. Genetic diversity in an indigenous horse breed– implications for mating strategies and the control of future inbreeding. J. Anim. Breed. Genet., 128: 394–406.
Hayes, B.J., Visscher, P.M., McPartlan, H.C. & Goddard, M.E. 2003. Novel multilocus measure of linkage disequilibrium to estimate past effective population size. Genome Res., 13: 635–643.
Huson, D. & Bryant, D. 2006. Application of phylogenetic networks in evolutionary studies. Mol. Biol. Evol., 23: 254–267.
Kijas, J.W., Lenstra, J.A., Hayes, B., Boitard, S., Porto Neto, L.R., Cristobal, M.S., Servin, B., McCulloch, R., Whan, V., Gietzen, K., Paiva, S., Barendse, W., Ciani, E., Raadsma, H., McEwan, J. & Dalrymple, B. 2012. Genome-wide analysis of the world’s sheep breeds reveals high levels of historic mixture and strong recent selection. PLoS Biol., 10: e1001258.
Ligges, U. & Mächler, M. 2003. Scatterplot3d– an R package for visu-alizing multivariate data. J. Stat. Softw., 8, 1–20.
Neuditschko, M., Kathkar, M.S. & Raadsma, H.W. 2012. NETVIEW: a high-definition network-visualization approach to detect fine-scale population structures from genome-wide patterns of variation. PLoS One, 7: e48375.
Pritchard, J.K., Stephens, M. & Donnelly, P. 2000. Inference of popula-tion structure using multilocus genotype data. Genetics, 155: 945–959. Purcell, S., Neale, B., Todd-Brown, K., Thomas, L., Ferreira, M.A.R., Bender, D., Maller, J., Sklar, P., de Bakker, P.I.W., Daly, M.J. & Sham, P.C. 2007. PLINK: a toolset for whole-genome association and population-based linkage analysis. Am. J. Hum. Genet., 81: 559–575.
Revell, L.J. 2012. Phytools: an R package for phylogenetic comparative biology (and other things). Methods Ecol. Evol., 3: 217–223. Rosenberg, N.A. 2004. Distruct: a program for the graphical display of
population structure. Mol. Ecol. Notes, 4: 137–138.
Rousset, F. 2008. GENEPOP’ 007: a complete re-implementation of the GENEPOP software for Windows and Linux. Mol. Ecol. Resour., 8: 103–106.
Sarkar, D. 2008. Lattice: Multivariate Data Visualization with R. Springer, New York. ISBN 978-0-387-75968-5.
Shannon, P., Markiel, A., Ozier, O., Baliga, N.S., Wang, J.T., Ramage, D., Amin, N., Schwikowski, B. & Ideker, T. 2003. Cytoscape: a software environment for integrated models of biomole-cular interaction networks. Genome Res., 13: 2498–2504.
Stahlberger-Saitbekova, N., Schläpfer, J., Dolf, G. & Gaillard, C. 2001. Genetic relationships in Swiss sheep breeds based on microsat-ellite analysis. J. Anim. Breed. Genet., 118: 379–387.
Sved, J.A. 1971. Linkage disequilibrium and homozygosity of chromosome segments infinite populations. Theor. Popul. Biol., 2: 125–141.
Wang, D., Sun, Y., Stand, P., Berlin, J.A., Wilcos, M.A. & Li, Q. 2009. Comparison of methods for correcting population stratification in a genome-wide association study of rheumatoid arthritis: principal-component analysis versus multidimensional scaling. BMC Proc., 3: 109. Weir, B.S. & Hill, W.G. 1980. Effect of mating structure on variation in